Free Statistics

of Irreproducible Research!

Author's title

Author*The author of this computation has been verified*
R Software Modulerwasp_arimabackwardselection.wasp
Title produced by softwareARIMA Backward Selection
Date of computationWed, 30 Dec 2009 11:59:08 -0700
Cite this page as followsStatistical Computations at FreeStatistics.org, Office for Research Development and Education, URL https://freestatistics.org/blog/index.php?v=date/2009/Dec/30/t1262199767vhu699rqvkx2i7b.htm/, Retrieved Sun, 28 Apr 2024 23:26:45 +0000
Statistical Computations at FreeStatistics.org, Office for Research Development and Education, URL https://freestatistics.org/blog/index.php?pk=71354, Retrieved Sun, 28 Apr 2024 23:26:45 +0000
QR Codes:

Original text written by user:
IsPrivate?No (this computation is public)
User-defined keywords
Estimated Impact141
Family? (F = Feedback message, R = changed R code, M = changed R Module, P = changed Parameters, D = changed Data)
-     [Univariate Data Series] [data set] [2008-12-01 19:54:57] [b98453cac15ba1066b407e146608df68]
F RMP   [ARIMA Backward Selection] [ARIMA Backward Se...] [2008-12-06 10:27:24] [c94d7012e41b73cfa20d93e879679ede]
-   PD    [ARIMA Backward Selection] [ARIMA backward se...] [2008-12-14 08:46:35] [12d343c4448a5f9e527bb31caeac580b]
-  M D      [ARIMA Backward Selection] [] [2009-12-11 16:14:09] [cf890101a20378422561610e0d41fd9c]
-   P         [ARIMA Backward Selection] [] [2009-12-17 10:01:15] [cf890101a20378422561610e0d41fd9c]
-   PD            [ARIMA Backward Selection] [Arima backward se...] [2009-12-30 18:59:08] [b243db81ea3e1f02fb3382887fb0f701] [Current]
Feedback Forum

Post a new message
Dataseries X:
228
136
174
69
108
149
134
131
180
127
59
59
202
173
296
154
117
86
38
17
52
12
61
65
70
91
111
90
110
100
99
137
139
124
103
75
55
75
65
17
27
17
20
131
26
66
59
35
57
6
24
57
42
55
30
35
22
18
22
82
90
66
64
50
56
99
97
41
59
92
91
47


Summary of computational transaction
Raw Inputview raw input (R code)
Raw Outputview raw output of R engine
Computing time7 seconds
R Server'Gwilym Jenkins' @ 72.249.127.135

\begin{tabular}{lllllllll}
\hline
Summary of computational transaction \tabularnewline
Raw Input & view raw input (R code)  \tabularnewline
Raw Output & view raw output of R engine  \tabularnewline
Computing time & 7 seconds \tabularnewline
R Server & 'Gwilym Jenkins' @ 72.249.127.135 \tabularnewline
\hline
\end{tabular}
%Source: https://freestatistics.org/blog/index.php?pk=71354&T=0

[TABLE]
[ROW][C]Summary of computational transaction[/C][/ROW]
[ROW][C]Raw Input[/C][C]view raw input (R code) [/C][/ROW]
[ROW][C]Raw Output[/C][C]view raw output of R engine [/C][/ROW]
[ROW][C]Computing time[/C][C]7 seconds[/C][/ROW]
[ROW][C]R Server[/C][C]'Gwilym Jenkins' @ 72.249.127.135[/C][/ROW]
[/TABLE]
Source: https://freestatistics.org/blog/index.php?pk=71354&T=0

Globally Unique Identifier (entire table): ba.freestatistics.org/blog/index.php?pk=71354&T=0

As an alternative you can also use a QR Code:  

The GUIDs for individual cells are displayed in the table below:

Summary of computational transaction
Raw Inputview raw input (R code)
Raw Outputview raw output of R engine
Computing time7 seconds
R Server'Gwilym Jenkins' @ 72.249.127.135


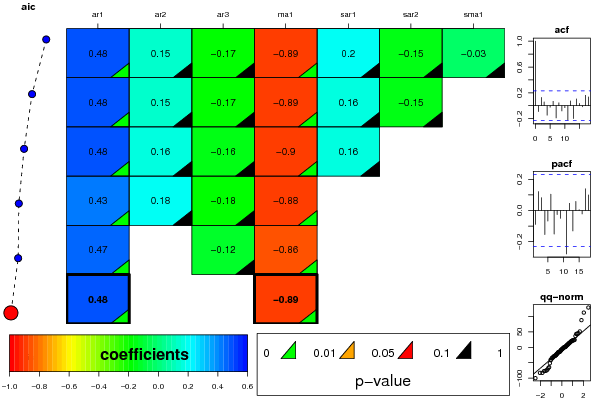
ARIMA Parameter Estimation and Backward Selection
Iterationar1ar2ar3ma1sar1sar2sma1
Estimates ( 1 )0.47680.1511-0.1693-0.88890.1953-0.1525-0.0317
(p-val)(0.0022 )(0.2843 )(0.1872 )(0 )(0.8451 )(0.4582 )(0.975 )
Estimates ( 2 )0.47670.1504-0.1689-0.88880.1643-0.14820
(p-val)(0.0022 )(0.2802 )(0.186 )(0 )(0.2669 )(0.3484 )(NA )
Estimates ( 3 )0.48460.1576-0.1633-0.90240.159200
(p-val)(0.0011 )(0.2567 )(0.1962 )(0 )(0.2653 )(NA )(NA )
Estimates ( 4 )0.43030.1849-0.175-0.8806000
(p-val)(0.0026 )(0.1722 )(0.1659 )(0 )(NA )(NA )(NA )
Estimates ( 5 )0.47050-0.1222-0.8555000
(p-val)(0.0022 )(NA )(0.3236 )(0 )(NA )(NA )(NA )
Estimates ( 6 )0.479900-0.8892000
(p-val)(8e-04 )(NA )(NA )(0 )(NA )(NA )(NA )
Estimates ( 7 )NANANANANANANA
(p-val)(NA )(NA )(NA )(NA )(NA )(NA )(NA )
Estimates ( 8 )NANANANANANANA
(p-val)(NA )(NA )(NA )(NA )(NA )(NA )(NA )
Estimates ( 9 )NANANANANANANA
(p-val)(NA )(NA )(NA )(NA )(NA )(NA )(NA )
Estimates ( 10 )NANANANANANANA
(p-val)(NA )(NA )(NA )(NA )(NA )(NA )(NA )
Estimates ( 11 )NANANANANANANA
(p-val)(NA )(NA )(NA )(NA )(NA )(NA )(NA )
Estimates ( 12 )NANANANANANANA
(p-val)(NA )(NA )(NA )(NA )(NA )(NA )(NA )
Estimates ( 13 )NANANANANANANA
(p-val)(NA )(NA )(NA )(NA )(NA )(NA )(NA )

\begin{tabular}{lllllllll}
\hline
ARIMA Parameter Estimation and Backward Selection \tabularnewline
Iteration & ar1 & ar2 & ar3 & ma1 & sar1 & sar2 & sma1 \tabularnewline
Estimates ( 1 ) & 0.4768 & 0.1511 & -0.1693 & -0.8889 & 0.1953 & -0.1525 & -0.0317 \tabularnewline
(p-val) & (0.0022 ) & (0.2843 ) & (0.1872 ) & (0 ) & (0.8451 ) & (0.4582 ) & (0.975 ) \tabularnewline
Estimates ( 2 ) & 0.4767 & 0.1504 & -0.1689 & -0.8888 & 0.1643 & -0.1482 & 0 \tabularnewline
(p-val) & (0.0022 ) & (0.2802 ) & (0.186 ) & (0 ) & (0.2669 ) & (0.3484 ) & (NA ) \tabularnewline
Estimates ( 3 ) & 0.4846 & 0.1576 & -0.1633 & -0.9024 & 0.1592 & 0 & 0 \tabularnewline
(p-val) & (0.0011 ) & (0.2567 ) & (0.1962 ) & (0 ) & (0.2653 ) & (NA ) & (NA ) \tabularnewline
Estimates ( 4 ) & 0.4303 & 0.1849 & -0.175 & -0.8806 & 0 & 0 & 0 \tabularnewline
(p-val) & (0.0026 ) & (0.1722 ) & (0.1659 ) & (0 ) & (NA ) & (NA ) & (NA ) \tabularnewline
Estimates ( 5 ) & 0.4705 & 0 & -0.1222 & -0.8555 & 0 & 0 & 0 \tabularnewline
(p-val) & (0.0022 ) & (NA ) & (0.3236 ) & (0 ) & (NA ) & (NA ) & (NA ) \tabularnewline
Estimates ( 6 ) & 0.4799 & 0 & 0 & -0.8892 & 0 & 0 & 0 \tabularnewline
(p-val) & (8e-04 ) & (NA ) & (NA ) & (0 ) & (NA ) & (NA ) & (NA ) \tabularnewline
Estimates ( 7 ) & NA & NA & NA & NA & NA & NA & NA \tabularnewline
(p-val) & (NA ) & (NA ) & (NA ) & (NA ) & (NA ) & (NA ) & (NA ) \tabularnewline
Estimates ( 8 ) & NA & NA & NA & NA & NA & NA & NA \tabularnewline
(p-val) & (NA ) & (NA ) & (NA ) & (NA ) & (NA ) & (NA ) & (NA ) \tabularnewline
Estimates ( 9 ) & NA & NA & NA & NA & NA & NA & NA \tabularnewline
(p-val) & (NA ) & (NA ) & (NA ) & (NA ) & (NA ) & (NA ) & (NA ) \tabularnewline
Estimates ( 10 ) & NA & NA & NA & NA & NA & NA & NA \tabularnewline
(p-val) & (NA ) & (NA ) & (NA ) & (NA ) & (NA ) & (NA ) & (NA ) \tabularnewline
Estimates ( 11 ) & NA & NA & NA & NA & NA & NA & NA \tabularnewline
(p-val) & (NA ) & (NA ) & (NA ) & (NA ) & (NA ) & (NA ) & (NA ) \tabularnewline
Estimates ( 12 ) & NA & NA & NA & NA & NA & NA & NA \tabularnewline
(p-val) & (NA ) & (NA ) & (NA ) & (NA ) & (NA ) & (NA ) & (NA ) \tabularnewline
Estimates ( 13 ) & NA & NA & NA & NA & NA & NA & NA \tabularnewline
(p-val) & (NA ) & (NA ) & (NA ) & (NA ) & (NA ) & (NA ) & (NA ) \tabularnewline
\hline
\end{tabular}
%Source: https://freestatistics.org/blog/index.php?pk=71354&T=1

[TABLE]
[ROW][C]ARIMA Parameter Estimation and Backward Selection[/C][/ROW]
[ROW][C]Iteration[/C][C]ar1[/C][C]ar2[/C][C]ar3[/C][C]ma1[/C][C]sar1[/C][C]sar2[/C][C]sma1[/C][/ROW]
[ROW][C]Estimates ( 1 )[/C][C]0.4768[/C][C]0.1511[/C][C]-0.1693[/C][C]-0.8889[/C][C]0.1953[/C][C]-0.1525[/C][C]-0.0317[/C][/ROW]
[ROW][C](p-val)[/C][C](0.0022 )[/C][C](0.2843 )[/C][C](0.1872 )[/C][C](0 )[/C][C](0.8451 )[/C][C](0.4582 )[/C][C](0.975 )[/C][/ROW]
[ROW][C]Estimates ( 2 )[/C][C]0.4767[/C][C]0.1504[/C][C]-0.1689[/C][C]-0.8888[/C][C]0.1643[/C][C]-0.1482[/C][C]0[/C][/ROW]
[ROW][C](p-val)[/C][C](0.0022 )[/C][C](0.2802 )[/C][C](0.186 )[/C][C](0 )[/C][C](0.2669 )[/C][C](0.3484 )[/C][C](NA )[/C][/ROW]
[ROW][C]Estimates ( 3 )[/C][C]0.4846[/C][C]0.1576[/C][C]-0.1633[/C][C]-0.9024[/C][C]0.1592[/C][C]0[/C][C]0[/C][/ROW]
[ROW][C](p-val)[/C][C](0.0011 )[/C][C](0.2567 )[/C][C](0.1962 )[/C][C](0 )[/C][C](0.2653 )[/C][C](NA )[/C][C](NA )[/C][/ROW]
[ROW][C]Estimates ( 4 )[/C][C]0.4303[/C][C]0.1849[/C][C]-0.175[/C][C]-0.8806[/C][C]0[/C][C]0[/C][C]0[/C][/ROW]
[ROW][C](p-val)[/C][C](0.0026 )[/C][C](0.1722 )[/C][C](0.1659 )[/C][C](0 )[/C][C](NA )[/C][C](NA )[/C][C](NA )[/C][/ROW]
[ROW][C]Estimates ( 5 )[/C][C]0.4705[/C][C]0[/C][C]-0.1222[/C][C]-0.8555[/C][C]0[/C][C]0[/C][C]0[/C][/ROW]
[ROW][C](p-val)[/C][C](0.0022 )[/C][C](NA )[/C][C](0.3236 )[/C][C](0 )[/C][C](NA )[/C][C](NA )[/C][C](NA )[/C][/ROW]
[ROW][C]Estimates ( 6 )[/C][C]0.4799[/C][C]0[/C][C]0[/C][C]-0.8892[/C][C]0[/C][C]0[/C][C]0[/C][/ROW]
[ROW][C](p-val)[/C][C](8e-04 )[/C][C](NA )[/C][C](NA )[/C][C](0 )[/C][C](NA )[/C][C](NA )[/C][C](NA )[/C][/ROW]
[ROW][C]Estimates ( 7 )[/C][C]NA[/C][C]NA[/C][C]NA[/C][C]NA[/C][C]NA[/C][C]NA[/C][C]NA[/C][/ROW]
[ROW][C](p-val)[/C][C](NA )[/C][C](NA )[/C][C](NA )[/C][C](NA )[/C][C](NA )[/C][C](NA )[/C][C](NA )[/C][/ROW]
[ROW][C]Estimates ( 8 )[/C][C]NA[/C][C]NA[/C][C]NA[/C][C]NA[/C][C]NA[/C][C]NA[/C][C]NA[/C][/ROW]
[ROW][C](p-val)[/C][C](NA )[/C][C](NA )[/C][C](NA )[/C][C](NA )[/C][C](NA )[/C][C](NA )[/C][C](NA )[/C][/ROW]
[ROW][C]Estimates ( 9 )[/C][C]NA[/C][C]NA[/C][C]NA[/C][C]NA[/C][C]NA[/C][C]NA[/C][C]NA[/C][/ROW]
[ROW][C](p-val)[/C][C](NA )[/C][C](NA )[/C][C](NA )[/C][C](NA )[/C][C](NA )[/C][C](NA )[/C][C](NA )[/C][/ROW]
[ROW][C]Estimates ( 10 )[/C][C]NA[/C][C]NA[/C][C]NA[/C][C]NA[/C][C]NA[/C][C]NA[/C][C]NA[/C][/ROW]
[ROW][C](p-val)[/C][C](NA )[/C][C](NA )[/C][C](NA )[/C][C](NA )[/C][C](NA )[/C][C](NA )[/C][C](NA )[/C][/ROW]
[ROW][C]Estimates ( 11 )[/C][C]NA[/C][C]NA[/C][C]NA[/C][C]NA[/C][C]NA[/C][C]NA[/C][C]NA[/C][/ROW]
[ROW][C](p-val)[/C][C](NA )[/C][C](NA )[/C][C](NA )[/C][C](NA )[/C][C](NA )[/C][C](NA )[/C][C](NA )[/C][/ROW]
[ROW][C]Estimates ( 12 )[/C][C]NA[/C][C]NA[/C][C]NA[/C][C]NA[/C][C]NA[/C][C]NA[/C][C]NA[/C][/ROW]
[ROW][C](p-val)[/C][C](NA )[/C][C](NA )[/C][C](NA )[/C][C](NA )[/C][C](NA )[/C][C](NA )[/C][C](NA )[/C][/ROW]
[ROW][C]Estimates ( 13 )[/C][C]NA[/C][C]NA[/C][C]NA[/C][C]NA[/C][C]NA[/C][C]NA[/C][C]NA[/C][/ROW]
[ROW][C](p-val)[/C][C](NA )[/C][C](NA )[/C][C](NA )[/C][C](NA )[/C][C](NA )[/C][C](NA )[/C][C](NA )[/C][/ROW]
[/TABLE]
Source: https://freestatistics.org/blog/index.php?pk=71354&T=1

Globally Unique Identifier (entire table): ba.freestatistics.org/blog/index.php?pk=71354&T=1

As an alternative you can also use a QR Code:  

The GUIDs for individual cells are displayed in the table below:

ARIMA Parameter Estimation and Backward Selection
Iterationar1ar2ar3ma1sar1sar2sma1
Estimates ( 1 )0.47680.1511-0.1693-0.88890.1953-0.1525-0.0317
(p-val)(0.0022 )(0.2843 )(0.1872 )(0 )(0.8451 )(0.4582 )(0.975 )
Estimates ( 2 )0.47670.1504-0.1689-0.88880.1643-0.14820
(p-val)(0.0022 )(0.2802 )(0.186 )(0 )(0.2669 )(0.3484 )(NA )
Estimates ( 3 )0.48460.1576-0.1633-0.90240.159200
(p-val)(0.0011 )(0.2567 )(0.1962 )(0 )(0.2653 )(NA )(NA )
Estimates ( 4 )0.43030.1849-0.175-0.8806000
(p-val)(0.0026 )(0.1722 )(0.1659 )(0 )(NA )(NA )(NA )
Estimates ( 5 )0.47050-0.1222-0.8555000
(p-val)(0.0022 )(NA )(0.3236 )(0 )(NA )(NA )(NA )
Estimates ( 6 )0.479900-0.8892000
(p-val)(8e-04 )(NA )(NA )(0 )(NA )(NA )(NA )
Estimates ( 7 )NANANANANANANA
(p-val)(NA )(NA )(NA )(NA )(NA )(NA )(NA )
Estimates ( 8 )NANANANANANANA
(p-val)(NA )(NA )(NA )(NA )(NA )(NA )(NA )
Estimates ( 9 )NANANANANANANA
(p-val)(NA )(NA )(NA )(NA )(NA )(NA )(NA )
Estimates ( 10 )NANANANANANANA
(p-val)(NA )(NA )(NA )(NA )(NA )(NA )(NA )
Estimates ( 11 )NANANANANANANA
(p-val)(NA )(NA )(NA )(NA )(NA )(NA )(NA )
Estimates ( 12 )NANANANANANANA
(p-val)(NA )(NA )(NA )(NA )(NA )(NA )(NA )
Estimates ( 13 )NANANANANANANA
(p-val)(NA )(NA )(NA )(NA )(NA )(NA )(NA )


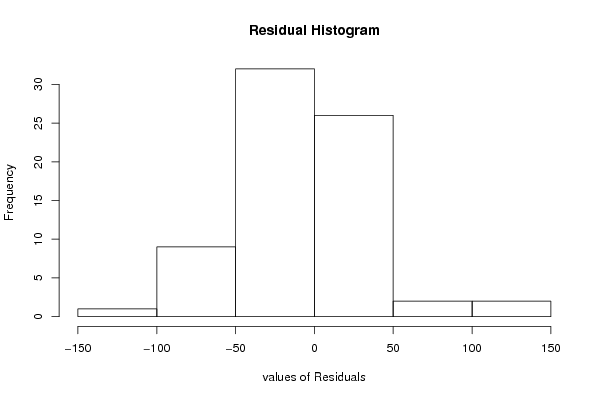
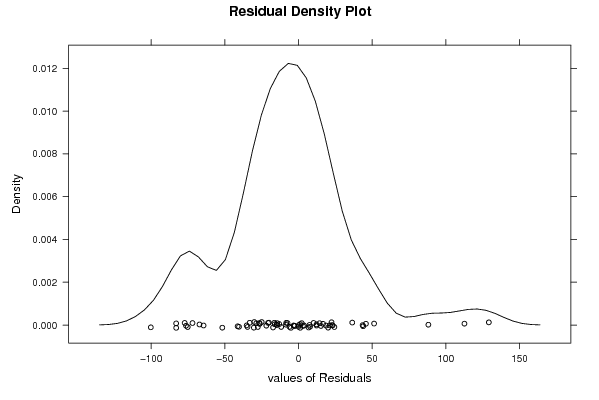
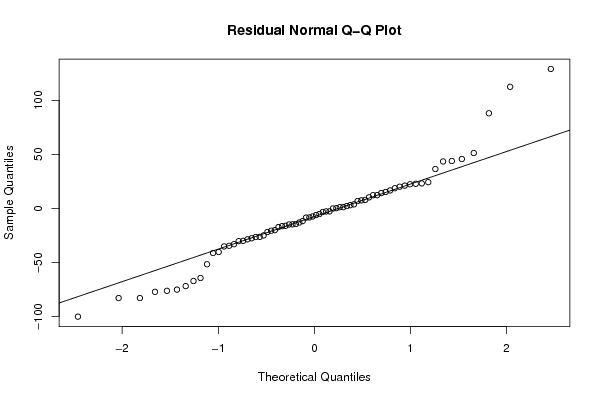
Estimated ARIMA Residuals
Value
0.227999860047256
-83.0326827243008
16.6662018167760
-100.264384684624
-2.69196822358219
24.3289274942082
-26.3739971566723
-13.0584944264463
43.9414709209876
-40.3854668300109
-77.2768758323747
-27.6441961042662
112.632897387270
-8.5029169660312
129.183226288003
-71.9645974698557
-35.1981968278396
-28.6253234794712
-75.2131785624337
-67.234261136554
-16.4068844139807
-76.3559580691649
-0.059688147534017
-14.8270745130506
-14.4546562757030
12.2709541982352
21.1048104084693
-11.7437925869890
22.4007510028948
2.19848734383795
3.0190329078636
43.4978772951455
20.1110878850260
1.14233819812831
-8.31958688276435
-24.9920576929501
-30.0403267751676
1.14297894956210
-21.8554309407889
-64.4375750671347
-20.0983976033248
-33.1225489127551
-26.4997835860098
88.1393308669356
-83.0447077838162
18.7244860418680
3.76712528107821
-30.3187311231783
12.2435822295013
-51.7324833591828
-5.19582469495649
22.7746018066912
-17.2772492186384
7.47696772017756
-20.6860903985904
-2.76810050486253
-16.1317079325722
-14.7404112782318
-6.11761894407737
51.2949169309457
23.1639689887438
-7.45767277909044
10.2468388661759
-3.31448690456206
6.81793684888775
45.7653345601219
15.2097749646527
-41.3130046009868
14.2612037664705
36.4869778051548
7.8429602027243
-34.6192038493137

\begin{tabular}{lllllllll}
\hline
Estimated ARIMA Residuals \tabularnewline
Value \tabularnewline
0.227999860047256 \tabularnewline
-83.0326827243008 \tabularnewline
16.6662018167760 \tabularnewline
-100.264384684624 \tabularnewline
-2.69196822358219 \tabularnewline
24.3289274942082 \tabularnewline
-26.3739971566723 \tabularnewline
-13.0584944264463 \tabularnewline
43.9414709209876 \tabularnewline
-40.3854668300109 \tabularnewline
-77.2768758323747 \tabularnewline
-27.6441961042662 \tabularnewline
112.632897387270 \tabularnewline
-8.5029169660312 \tabularnewline
129.183226288003 \tabularnewline
-71.9645974698557 \tabularnewline
-35.1981968278396 \tabularnewline
-28.6253234794712 \tabularnewline
-75.2131785624337 \tabularnewline
-67.234261136554 \tabularnewline
-16.4068844139807 \tabularnewline
-76.3559580691649 \tabularnewline
-0.059688147534017 \tabularnewline
-14.8270745130506 \tabularnewline
-14.4546562757030 \tabularnewline
12.2709541982352 \tabularnewline
21.1048104084693 \tabularnewline
-11.7437925869890 \tabularnewline
22.4007510028948 \tabularnewline
2.19848734383795 \tabularnewline
3.0190329078636 \tabularnewline
43.4978772951455 \tabularnewline
20.1110878850260 \tabularnewline
1.14233819812831 \tabularnewline
-8.31958688276435 \tabularnewline
-24.9920576929501 \tabularnewline
-30.0403267751676 \tabularnewline
1.14297894956210 \tabularnewline
-21.8554309407889 \tabularnewline
-64.4375750671347 \tabularnewline
-20.0983976033248 \tabularnewline
-33.1225489127551 \tabularnewline
-26.4997835860098 \tabularnewline
88.1393308669356 \tabularnewline
-83.0447077838162 \tabularnewline
18.7244860418680 \tabularnewline
3.76712528107821 \tabularnewline
-30.3187311231783 \tabularnewline
12.2435822295013 \tabularnewline
-51.7324833591828 \tabularnewline
-5.19582469495649 \tabularnewline
22.7746018066912 \tabularnewline
-17.2772492186384 \tabularnewline
7.47696772017756 \tabularnewline
-20.6860903985904 \tabularnewline
-2.76810050486253 \tabularnewline
-16.1317079325722 \tabularnewline
-14.7404112782318 \tabularnewline
-6.11761894407737 \tabularnewline
51.2949169309457 \tabularnewline
23.1639689887438 \tabularnewline
-7.45767277909044 \tabularnewline
10.2468388661759 \tabularnewline
-3.31448690456206 \tabularnewline
6.81793684888775 \tabularnewline
45.7653345601219 \tabularnewline
15.2097749646527 \tabularnewline
-41.3130046009868 \tabularnewline
14.2612037664705 \tabularnewline
36.4869778051548 \tabularnewline
7.8429602027243 \tabularnewline
-34.6192038493137 \tabularnewline
\hline
\end{tabular}
%Source: https://freestatistics.org/blog/index.php?pk=71354&T=2

[TABLE]
[ROW][C]Estimated ARIMA Residuals[/C][/ROW]
[ROW][C]Value[/C][/ROW]
[ROW][C]0.227999860047256[/C][/ROW]
[ROW][C]-83.0326827243008[/C][/ROW]
[ROW][C]16.6662018167760[/C][/ROW]
[ROW][C]-100.264384684624[/C][/ROW]
[ROW][C]-2.69196822358219[/C][/ROW]
[ROW][C]24.3289274942082[/C][/ROW]
[ROW][C]-26.3739971566723[/C][/ROW]
[ROW][C]-13.0584944264463[/C][/ROW]
[ROW][C]43.9414709209876[/C][/ROW]
[ROW][C]-40.3854668300109[/C][/ROW]
[ROW][C]-77.2768758323747[/C][/ROW]
[ROW][C]-27.6441961042662[/C][/ROW]
[ROW][C]112.632897387270[/C][/ROW]
[ROW][C]-8.5029169660312[/C][/ROW]
[ROW][C]129.183226288003[/C][/ROW]
[ROW][C]-71.9645974698557[/C][/ROW]
[ROW][C]-35.1981968278396[/C][/ROW]
[ROW][C]-28.6253234794712[/C][/ROW]
[ROW][C]-75.2131785624337[/C][/ROW]
[ROW][C]-67.234261136554[/C][/ROW]
[ROW][C]-16.4068844139807[/C][/ROW]
[ROW][C]-76.3559580691649[/C][/ROW]
[ROW][C]-0.059688147534017[/C][/ROW]
[ROW][C]-14.8270745130506[/C][/ROW]
[ROW][C]-14.4546562757030[/C][/ROW]
[ROW][C]12.2709541982352[/C][/ROW]
[ROW][C]21.1048104084693[/C][/ROW]
[ROW][C]-11.7437925869890[/C][/ROW]
[ROW][C]22.4007510028948[/C][/ROW]
[ROW][C]2.19848734383795[/C][/ROW]
[ROW][C]3.0190329078636[/C][/ROW]
[ROW][C]43.4978772951455[/C][/ROW]
[ROW][C]20.1110878850260[/C][/ROW]
[ROW][C]1.14233819812831[/C][/ROW]
[ROW][C]-8.31958688276435[/C][/ROW]
[ROW][C]-24.9920576929501[/C][/ROW]
[ROW][C]-30.0403267751676[/C][/ROW]
[ROW][C]1.14297894956210[/C][/ROW]
[ROW][C]-21.8554309407889[/C][/ROW]
[ROW][C]-64.4375750671347[/C][/ROW]
[ROW][C]-20.0983976033248[/C][/ROW]
[ROW][C]-33.1225489127551[/C][/ROW]
[ROW][C]-26.4997835860098[/C][/ROW]
[ROW][C]88.1393308669356[/C][/ROW]
[ROW][C]-83.0447077838162[/C][/ROW]
[ROW][C]18.7244860418680[/C][/ROW]
[ROW][C]3.76712528107821[/C][/ROW]
[ROW][C]-30.3187311231783[/C][/ROW]
[ROW][C]12.2435822295013[/C][/ROW]
[ROW][C]-51.7324833591828[/C][/ROW]
[ROW][C]-5.19582469495649[/C][/ROW]
[ROW][C]22.7746018066912[/C][/ROW]
[ROW][C]-17.2772492186384[/C][/ROW]
[ROW][C]7.47696772017756[/C][/ROW]
[ROW][C]-20.6860903985904[/C][/ROW]
[ROW][C]-2.76810050486253[/C][/ROW]
[ROW][C]-16.1317079325722[/C][/ROW]
[ROW][C]-14.7404112782318[/C][/ROW]
[ROW][C]-6.11761894407737[/C][/ROW]
[ROW][C]51.2949169309457[/C][/ROW]
[ROW][C]23.1639689887438[/C][/ROW]
[ROW][C]-7.45767277909044[/C][/ROW]
[ROW][C]10.2468388661759[/C][/ROW]
[ROW][C]-3.31448690456206[/C][/ROW]
[ROW][C]6.81793684888775[/C][/ROW]
[ROW][C]45.7653345601219[/C][/ROW]
[ROW][C]15.2097749646527[/C][/ROW]
[ROW][C]-41.3130046009868[/C][/ROW]
[ROW][C]14.2612037664705[/C][/ROW]
[ROW][C]36.4869778051548[/C][/ROW]
[ROW][C]7.8429602027243[/C][/ROW]
[ROW][C]-34.6192038493137[/C][/ROW]
[/TABLE]
Source: https://freestatistics.org/blog/index.php?pk=71354&T=2

Globally Unique Identifier (entire table): ba.freestatistics.org/blog/index.php?pk=71354&T=2

As an alternative you can also use a QR Code:  

The GUIDs for individual cells are displayed in the table below:

Estimated ARIMA Residuals
Value
0.227999860047256
-83.0326827243008
16.6662018167760
-100.264384684624
-2.69196822358219
24.3289274942082
-26.3739971566723
-13.0584944264463
43.9414709209876
-40.3854668300109
-77.2768758323747
-27.6441961042662
112.632897387270
-8.5029169660312
129.183226288003
-71.9645974698557
-35.1981968278396
-28.6253234794712
-75.2131785624337
-67.234261136554
-16.4068844139807
-76.3559580691649
-0.059688147534017
-14.8270745130506
-14.4546562757030
12.2709541982352
21.1048104084693
-11.7437925869890
22.4007510028948
2.19848734383795
3.0190329078636
43.4978772951455
20.1110878850260
1.14233819812831
-8.31958688276435
-24.9920576929501
-30.0403267751676
1.14297894956210
-21.8554309407889
-64.4375750671347
-20.0983976033248
-33.1225489127551
-26.4997835860098
88.1393308669356
-83.0447077838162
18.7244860418680
3.76712528107821
-30.3187311231783
12.2435822295013
-51.7324833591828
-5.19582469495649
22.7746018066912
-17.2772492186384
7.47696772017756
-20.6860903985904
-2.76810050486253
-16.1317079325722
-14.7404112782318
-6.11761894407737
51.2949169309457
23.1639689887438
-7.45767277909044
10.2468388661759
-3.31448690456206
6.81793684888775
45.7653345601219
15.2097749646527
-41.3130046009868
14.2612037664705
36.4869778051548
7.8429602027243
-34.6192038493137


Parameters (Session):
par1 = 60 ; par2 = 1 ; par3 = 0 ; par4 = 0 ; par5 = 12 ; par6 = White Noise ; par7 = 0.95 ;
Parameters (R input):
par1 = FALSE ; par2 = 1 ; par3 = 1 ; par4 = 0 ; par5 = 12 ; par6 = 3 ; par7 = 1 ; par8 = 2 ; par9 = 1 ;
R code (references can be found in the software module):
library(lattice)
if (par1 == 'TRUE') par1 <- TRUE
if (par1 == 'FALSE') par1 <- FALSE
par2 <- as.numeric(par2) #Box-Cox lambda transformation parameter
par3 <- as.numeric(par3) #degree of non-seasonal differencing
par4 <- as.numeric(par4) #degree of seasonal differencing
par5 <- as.numeric(par5) #seasonal period
par6 <- as.numeric(par6) #degree (p) of the non-seasonal AR(p) polynomial
par7 <- as.numeric(par7) #degree (q) of the non-seasonal MA(q) polynomial
par8 <- as.numeric(par8) #degree (P) of the seasonal AR(P) polynomial
par9 <- as.numeric(par9) #degree (Q) of the seasonal MA(Q) polynomial
armaGR <- function(arima.out, names, n){
try1 <- arima.out$coef
try2 <- sqrt(diag(arima.out$var.coef))
try.data.frame <- data.frame(matrix(NA,ncol=4,nrow=length(names)))
dimnames(try.data.frame) <- list(names,c('coef','std','tstat','pv'))
try.data.frame[,1] <- try1
for(i in 1:length(try2)) try.data.frame[which(rownames(try.data.frame)==names(try2)[i]),2] <- try2[i]
try.data.frame[,3] <- try.data.frame[,1] / try.data.frame[,2]
try.data.frame[,4] <- round((1-pt(abs(try.data.frame[,3]),df=n-(length(try2)+1)))*2,5)
vector <- rep(NA,length(names))
vector[is.na(try.data.frame[,4])] <- 0
maxi <- which.max(try.data.frame[,4])
continue <- max(try.data.frame[,4],na.rm=TRUE) > .05
vector[maxi] <- 0
list(summary=try.data.frame,next.vector=vector,continue=continue)
}
arimaSelect <- function(series, order=c(13,0,0), seasonal=list(order=c(2,0,0),period=12), include.mean=F){
nrc <- order[1]+order[3]+seasonal$order[1]+seasonal$order[3]
coeff <- matrix(NA, nrow=nrc*2, ncol=nrc)
pval <- matrix(NA, nrow=nrc*2, ncol=nrc)
mylist <- rep(list(NULL), nrc)
names <- NULL
if(order[1] > 0) names <- paste('ar',1:order[1],sep='')
if(order[3] > 0) names <- c( names , paste('ma',1:order[3],sep='') )
if(seasonal$order[1] > 0) names <- c(names, paste('sar',1:seasonal$order[1],sep=''))
if(seasonal$order[3] > 0) names <- c(names, paste('sma',1:seasonal$order[3],sep=''))
arima.out <- arima(series, order=order, seasonal=seasonal, include.mean=include.mean, method='ML')
mylist[[1]] <- arima.out
last.arma <- armaGR(arima.out, names, length(series))
mystop <- FALSE
i <- 1
coeff[i,] <- last.arma[[1]][,1]
pval [i,] <- last.arma[[1]][,4]
i <- 2
aic <- arima.out$aic
while(!mystop){
mylist[[i]] <- arima.out
arima.out <- arima(series, order=order, seasonal=seasonal, include.mean=include.mean, method='ML', fixed=last.arma$next.vector)
aic <- c(aic, arima.out$aic)
last.arma <- armaGR(arima.out, names, length(series))
mystop <- !last.arma$continue
coeff[i,] <- last.arma[[1]][,1]
pval [i,] <- last.arma[[1]][,4]
i <- i+1
}
list(coeff, pval, mylist, aic=aic)
}
arimaSelectplot <- function(arimaSelect.out,noms,choix){
noms <- names(arimaSelect.out[[3]][[1]]$coef)
coeff <- arimaSelect.out[[1]]
k <- min(which(is.na(coeff[,1])))-1
coeff <- coeff[1:k,]
pval <- arimaSelect.out[[2]][1:k,]
aic <- arimaSelect.out$aic[1:k]
coeff[coeff==0] <- NA
n <- ncol(coeff)
if(missing(choix)) choix <- k
layout(matrix(c(1,1,1,2,
3,3,3,2,
3,3,3,4,
5,6,7,7),nr=4),
widths=c(10,35,45,15),
heights=c(30,30,15,15))
couleurs <- rainbow(75)[1:50]#(50)
ticks <- pretty(coeff)
par(mar=c(1,1,3,1))
plot(aic,k:1-.5,type='o',pch=21,bg='blue',cex=2,axes=F,lty=2,xpd=NA)
points(aic[choix],k-choix+.5,pch=21,cex=4,bg=2,xpd=NA)
title('aic',line=2)
par(mar=c(3,0,0,0))
plot(0,axes=F,xlab='',ylab='',xlim=range(ticks),ylim=c(.1,1))
rect(xleft = min(ticks) + (0:49)/50*(max(ticks)-min(ticks)),
xright = min(ticks) + (1:50)/50*(max(ticks)-min(ticks)),
ytop = rep(1,50),
ybottom= rep(0,50),col=couleurs,border=NA)
axis(1,ticks)
rect(xleft=min(ticks),xright=max(ticks),ytop=1,ybottom=0)
text(mean(coeff,na.rm=T),.5,'coefficients',cex=2,font=2)
par(mar=c(1,1,3,1))
image(1:n,1:k,t(coeff[k:1,]),axes=F,col=couleurs,zlim=range(ticks))
for(i in 1:n) for(j in 1:k) if(!is.na(coeff[j,i])) {
if(pval[j,i]<.01) symb = 'green'
else if( (pval[j,i]<.05) & (pval[j,i]>=.01)) symb = 'orange'
else if( (pval[j,i]<.1) & (pval[j,i]>=.05)) symb = 'red'
else symb = 'black'
polygon(c(i+.5 ,i+.2 ,i+.5 ,i+.5),
c(k-j+0.5,k-j+0.5,k-j+0.8,k-j+0.5),
col=symb)
if(j==choix) {
rect(xleft=i-.5,
xright=i+.5,
ybottom=k-j+1.5,
ytop=k-j+.5,
lwd=4)
text(i,
k-j+1,
round(coeff[j,i],2),
cex=1.2,
font=2)
}
else{
rect(xleft=i-.5,xright=i+.5,ybottom=k-j+1.5,ytop=k-j+.5)
text(i,k-j+1,round(coeff[j,i],2),cex=1.2,font=1)
}
}
axis(3,1:n,noms)
par(mar=c(0.5,0,0,0.5))
plot(0,axes=F,xlab='',ylab='',type='n',xlim=c(0,8),ylim=c(-.2,.8))
cols <- c('green','orange','red','black')
niv <- c('0','0.01','0.05','0.1')
for(i in 0:3){
polygon(c(1+2*i ,1+2*i ,1+2*i-.5 ,1+2*i),
c(.4 ,.7 , .4 , .4),
col=cols[i+1])
text(2*i,0.5,niv[i+1],cex=1.5)
}
text(8,.5,1,cex=1.5)
text(4,0,'p-value',cex=2)
box()
residus <- arimaSelect.out[[3]][[choix]]$res
par(mar=c(1,2,4,1))
acf(residus,main='')
title('acf',line=.5)
par(mar=c(1,2,4,1))
pacf(residus,main='')
title('pacf',line=.5)
par(mar=c(2,2,4,1))
qqnorm(residus,main='')
title('qq-norm',line=.5)
qqline(residus)
residus
}
if (par2 == 0) x <- log(x)
if (par2 != 0) x <- x^par2
(selection <- arimaSelect(x, order=c(par6,par3,par7), seasonal=list(order=c(par8,par4,par9), period=par5)))
bitmap(file='test1.png')
resid <- arimaSelectplot(selection)
dev.off()
resid
bitmap(file='test2.png')
acf(resid,length(resid)/2, main='Residual Autocorrelation Function')
dev.off()
bitmap(file='test3.png')
pacf(resid,length(resid)/2, main='Residual Partial Autocorrelation Function')
dev.off()
bitmap(file='test4.png')
cpgram(resid, main='Residual Cumulative Periodogram')
dev.off()
bitmap(file='test5.png')
hist(resid, main='Residual Histogram', xlab='values of Residuals')
dev.off()
bitmap(file='test6.png')
densityplot(~resid,col='black',main='Residual Density Plot', xlab='values of Residuals')
dev.off()
bitmap(file='test7.png')
qqnorm(resid, main='Residual Normal Q-Q Plot')
qqline(resid)
dev.off()
ncols <- length(selection[[1]][1,])
nrows <- length(selection[[2]][,1])-1
load(file='createtable')
a<-table.start()
a<-table.row.start(a)
a<-table.element(a,'ARIMA Parameter Estimation and Backward Selection', ncols+1,TRUE)
a<-table.row.end(a)
a<-table.row.start(a)
a<-table.element(a,'Iteration', header=TRUE)
for (i in 1:ncols) {
a<-table.element(a,names(selection[[3]][[1]]$coef)[i],header=TRUE)
}
a<-table.row.end(a)
for (j in 1:nrows) {
a<-table.row.start(a)
mydum <- 'Estimates ('
mydum <- paste(mydum,j)
mydum <- paste(mydum,')')
a<-table.element(a,mydum, header=TRUE)
for (i in 1:ncols) {
a<-table.element(a,round(selection[[1]][j,i],4))
}
a<-table.row.end(a)
a<-table.row.start(a)
a<-table.element(a,'(p-val)', header=TRUE)
for (i in 1:ncols) {
mydum <- '('
mydum <- paste(mydum,round(selection[[2]][j,i],4),sep='')
mydum <- paste(mydum,')')
a<-table.element(a,mydum)
}
a<-table.row.end(a)
}
a<-table.end(a)
table.save(a,file='mytable.tab')
a<-table.start()
a<-table.row.start(a)
a<-table.element(a,'Estimated ARIMA Residuals', 1,TRUE)
a<-table.row.end(a)
a<-table.row.start(a)
a<-table.element(a,'Value', 1,TRUE)
a<-table.row.end(a)
for (i in (par4*par5+par3):length(resid)) {
a<-table.row.start(a)
a<-table.element(a,resid[i])
a<-table.row.end(a)
}
a<-table.end(a)
table.save(a,file='mytable1.tab')