Free Statistics

of Irreproducible Research!

Author's title

Author*The author of this computation has been verified*
R Software Modulerwasp_edauni.wasp
Title produced by softwareUnivariate Explorative Data Analysis
Date of computationWed, 30 Dec 2009 11:12:55 -0700
Cite this page as followsStatistical Computations at FreeStatistics.org, Office for Research Development and Education, URL https://freestatistics.org/blog/index.php?v=date/2009/Dec/30/t1262196949s4brs0cilhc1i80.htm/, Retrieved Mon, 29 Apr 2024 06:09:14 +0000
Statistical Computations at FreeStatistics.org, Office for Research Development and Education, URL https://freestatistics.org/blog/index.php?pk=71346, Retrieved Mon, 29 Apr 2024 06:09:14 +0000
QR Codes:

Original text written by user:
IsPrivate?No (this computation is public)
User-defined keywords
Estimated Impact127
Family? (F = Feedback message, R = changed R code, M = changed R Module, P = changed Parameters, D = changed Data)
-     [Central Tendency] [SHW_WS3_Yt=c+Xt] [2009-10-16 08:10:06] [8b1aef4e7013bd33fbc2a5833375c5f5]
- RMPD  [Univariate Explorative Data Analysis] [] [2009-11-02 10:43:25] [8b1aef4e7013bd33fbc2a5833375c5f5]
-    D      [Univariate Explorative Data Analysis] [] [2009-12-30 18:12:55] [84778c3520b84fd5786bccf2e25a5aef] [Current]
Feedback Forum

Post a new message
Dataseries X:
96.428
96.407
108.792
110.937
111.597
110.472
108.737
109.142
112.084
112.136
109.942
108.566
107.780
108.777
124.518
126.663
125.823
121.958
118.332
118.694
122.622
122.610
121.704
117.735
117.875
118.683
130.422
133.724
134.608
132.588
127.678
128.439
129.047
128.338
128.676
124.684
123.298
124.690
136.916
138.611
137.527
134.206
130.335
130.267
131.243
130.491
129.391
127.258
125.825
125.738
135.946
138.452
137.162
129.340
125.047
122.025
124.027
122.083
120.583
117.954
115.466
113.815
125.185
128.193
126.241
120.357
118.259
118.151
119.714
118.554
115.031
114.049
110.140
111.925
122.371
124.119
122.656
124.059
124.590
128.119
135.225
137.772
136.568
137.618
133.514
136.914
147.743
151.360
147.905
143.454


Summary of computational transaction
Raw Inputview raw input (R code)
Raw Outputview raw output of R engine
Computing time2 seconds
R Server'Gwilym Jenkins' @ 72.249.127.135

\begin{tabular}{lllllllll}
\hline
Summary of computational transaction \tabularnewline
Raw Input & view raw input (R code)  \tabularnewline
Raw Output & view raw output of R engine  \tabularnewline
Computing time & 2 seconds \tabularnewline
R Server & 'Gwilym Jenkins' @ 72.249.127.135 \tabularnewline
\hline
\end{tabular}
%Source: https://freestatistics.org/blog/index.php?pk=71346&T=0

[TABLE]
[ROW][C]Summary of computational transaction[/C][/ROW]
[ROW][C]Raw Input[/C][C]view raw input (R code) [/C][/ROW]
[ROW][C]Raw Output[/C][C]view raw output of R engine [/C][/ROW]
[ROW][C]Computing time[/C][C]2 seconds[/C][/ROW]
[ROW][C]R Server[/C][C]'Gwilym Jenkins' @ 72.249.127.135[/C][/ROW]
[/TABLE]
Source: https://freestatistics.org/blog/index.php?pk=71346&T=0

Globally Unique Identifier (entire table): ba.freestatistics.org/blog/index.php?pk=71346&T=0

As an alternative you can also use a QR Code:  

The GUIDs for individual cells are displayed in the table below:

Summary of computational transaction
Raw Inputview raw input (R code)
Raw Outputview raw output of R engine
Computing time2 seconds
R Server'Gwilym Jenkins' @ 72.249.127.135


Descriptive Statistics
# observations90
minimum96.407
Q1118.00325
median124.554
mean124.163333333333
Q3130.40025
maximum151.36

\begin{tabular}{lllllllll}
\hline
Descriptive Statistics \tabularnewline
# observations & 90 \tabularnewline
minimum & 96.407 \tabularnewline
Q1 & 118.00325 \tabularnewline
median & 124.554 \tabularnewline
mean & 124.163333333333 \tabularnewline
Q3 & 130.40025 \tabularnewline
maximum & 151.36 \tabularnewline
\hline
\end{tabular}
%Source: https://freestatistics.org/blog/index.php?pk=71346&T=1

[TABLE]
[ROW][C]Descriptive Statistics[/C][/ROW]
[ROW][C]# observations[/C][C]90[/C][/ROW]
[ROW][C]minimum[/C][C]96.407[/C][/ROW]
[ROW][C]Q1[/C][C]118.00325[/C][/ROW]
[ROW][C]median[/C][C]124.554[/C][/ROW]
[ROW][C]mean[/C][C]124.163333333333[/C][/ROW]
[ROW][C]Q3[/C][C]130.40025[/C][/ROW]
[ROW][C]maximum[/C][C]151.36[/C][/ROW]
[/TABLE]
Source: https://freestatistics.org/blog/index.php?pk=71346&T=1

Globally Unique Identifier (entire table): ba.freestatistics.org/blog/index.php?pk=71346&T=1

As an alternative you can also use a QR Code:  

The GUIDs for individual cells are displayed in the table below:

Descriptive Statistics
# observations90
minimum96.407
Q1118.00325
median124.554
mean124.163333333333
Q3130.40025
maximum151.36


Parameters (Session):
par1 = 0 ; par2 = 36 ;
Parameters (R input):
par1 = 0 ; par2 = 36 ;
R code (references can be found in the software module):
par1 <- as.numeric(par1)
par2 <- as.numeric(par2)
x <- as.ts(x)
library(lattice)
bitmap(file='pic1.png')
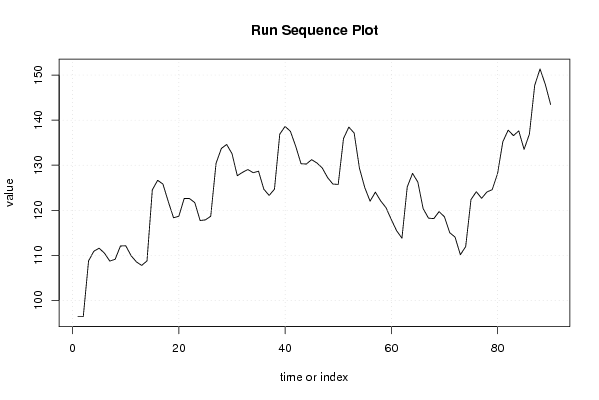
plot(x,type='l',main='Run Sequence Plot',xlab='time or index',ylab='value')
grid()
dev.off()
bitmap(file='pic2.png')
hist(x)
grid()
dev.off()
bitmap(file='pic3.png')
if (par1 > 0)
{
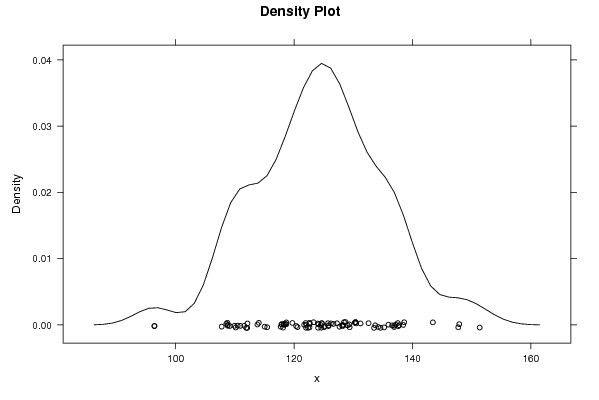
densityplot(~x,col='black',main=paste('Density Plot bw = ',par1),bw=par1)
} else {
densityplot(~x,col='black',main='Density Plot')
}
dev.off()
bitmap(file='pic4.png')
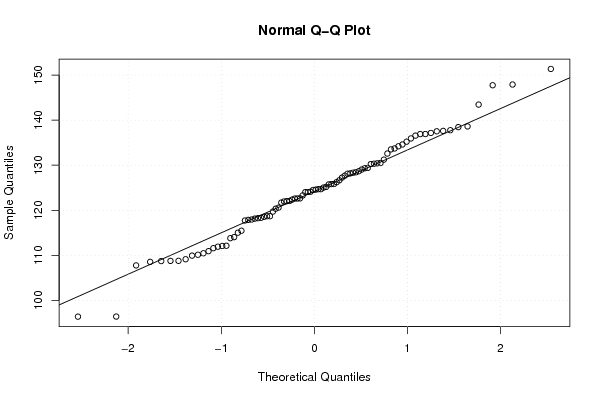
qqnorm(x)
qqline(x)
grid()
dev.off()
if (par2 > 0)
{
bitmap(file='lagplot1.png')
dum <- cbind(lag(x,k=1),x)
dum
dum1 <- dum[2:length(x),]
dum1
z <- as.data.frame(dum1)
z
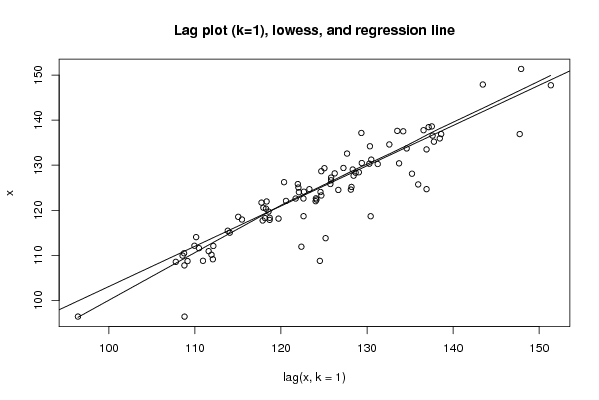
plot(z,main='Lag plot (k=1), lowess, and regression line')
lines(lowess(z))
abline(lm(z))
dev.off()
if (par2 > 1) {
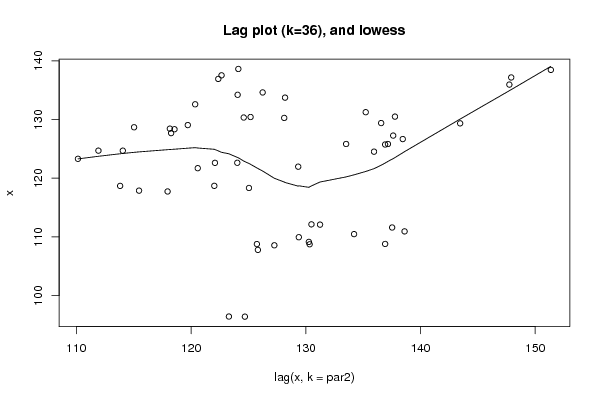
bitmap(file='lagplotpar2.png')
dum <- cbind(lag(x,k=par2),x)
dum
dum1 <- dum[(par2+1):length(x),]
dum1
z <- as.data.frame(dum1)
z
mylagtitle <- 'Lag plot (k='
mylagtitle <- paste(mylagtitle,par2,sep='')
mylagtitle <- paste(mylagtitle,'), and lowess',sep='')
plot(z,main=mylagtitle)
lines(lowess(z))
dev.off()
}
bitmap(file='pic5.png')
acf(x,lag.max=par2,main='Autocorrelation Function')
grid()
dev.off()
}
summary(x)
load(file='createtable')
a<-table.start()
a<-table.row.start(a)
a<-table.element(a,'Descriptive Statistics',2,TRUE)
a<-table.row.end(a)
a<-table.row.start(a)
a<-table.element(a,'# observations',header=TRUE)
a<-table.element(a,length(x))
a<-table.row.end(a)
a<-table.row.start(a)
a<-table.element(a,'minimum',header=TRUE)
a<-table.element(a,min(x))
a<-table.row.end(a)
a<-table.row.start(a)
a<-table.element(a,'Q1',header=TRUE)
a<-table.element(a,quantile(x,0.25))
a<-table.row.end(a)
a<-table.row.start(a)
a<-table.element(a,'median',header=TRUE)
a<-table.element(a,median(x))
a<-table.row.end(a)
a<-table.row.start(a)
a<-table.element(a,'mean',header=TRUE)
a<-table.element(a,mean(x))
a<-table.row.end(a)
a<-table.row.start(a)
a<-table.element(a,'Q3',header=TRUE)
a<-table.element(a,quantile(x,0.75))
a<-table.row.end(a)
a<-table.row.start(a)
a<-table.element(a,'maximum',header=TRUE)
a<-table.element(a,max(x))
a<-table.row.end(a)
a<-table.end(a)
table.save(a,file='mytable.tab')