| Multiple Linear Regression - Estimated Regression Equation |
| Werkloosheid[t] = + 402.296605635782 -0.000281740366301887Export[t] + 12.2479148725478M1[t] + 8.04473827591623M2[t] -2.35386429189957M3[t] -16.2446090803411M4[t] -26.3525719887406M5[t] -27.6500485207064M6[t] + 11.8023026228968M7[t] + 19.7450661823929M8[t] + 14.0436527713366M9[t] + 1.46631411513886M10[t] -8.37732368405701M11[t] -1.03233630798111t + e[t] |
| Multiple Linear Regression - Ordinary Least Squares | |||||
| Variable | Parameter | S.D. | T-STAT H0: parameter = 0 | 2-tail p-value | 1-tail p-value |
| (Intercept) | 402.296605635782 | 31.805243 | 12.6488 | 0 | 0 |
| Export | -0.000281740366301887 | 0.006777 | -0.0416 | 0.967015 | 0.483508 |
| M1 | 12.2479148725478 | 14.160889 | 0.8649 | 0.391481 | 0.19574 |
| M2 | 8.04473827591623 | 14.635625 | 0.5497 | 0.58515 | 0.292575 |
| M3 | -2.35386429189957 | 15.442257 | -0.1524 | 0.8795 | 0.43975 |
| M4 | -16.2446090803411 | 14.677951 | -1.1067 | 0.274041 | 0.13702 |
| M5 | -26.3525719887406 | 14.879461 | -1.7711 | 0.083033 | 0.041517 |
| M6 | -27.6500485207064 | 15.256046 | -1.8124 | 0.076315 | 0.038158 |
| M7 | 11.8023026228968 | 15.333147 | 0.7697 | 0.445315 | 0.222657 |
| M8 | 19.7450661823929 | 14.663258 | 1.3466 | 0.184578 | 0.092289 |
| M9 | 14.0436527713366 | 15.031505 | 0.9343 | 0.354934 | 0.177467 |
| M10 | 1.46631411513886 | 14.91632 | 0.0983 | 0.92211 | 0.461055 |
| M11 | -8.37732368405701 | 14.562618 | -0.5753 | 0.567858 | 0.283929 |
| t | -1.03233630798111 | 0.265501 | -3.8883 | 0.000316 | 0.000158 |
| Multiple Linear Regression - Regression Statistics | |
| Multiple R | 0.757394894570616 |
| R-squared | 0.573647026321634 |
| Adjusted R-squared | 0.455719608070171 |
| F-TEST (value) | 4.86440757227819 |
| F-TEST (DF numerator) | 13 |
| F-TEST (DF denominator) | 47 |
| p-value | 2.72288071523352e-05 |
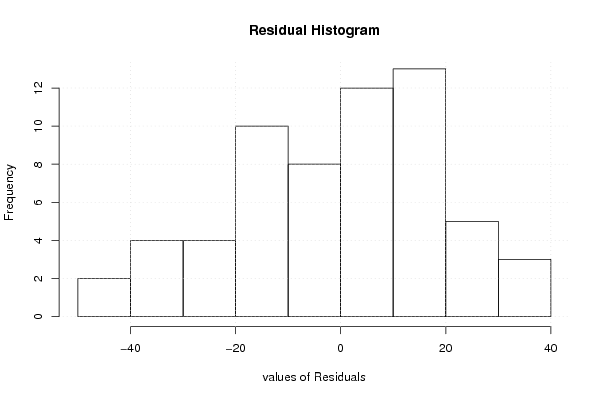
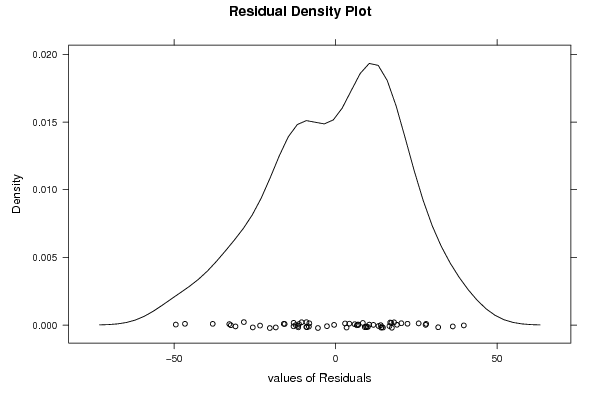
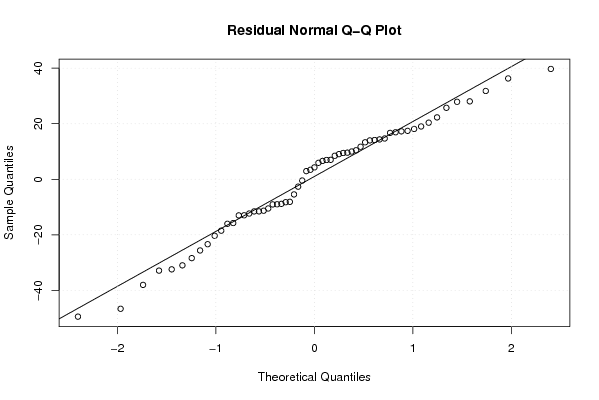
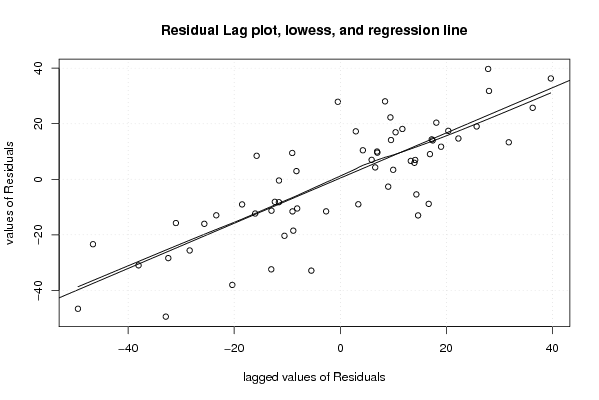
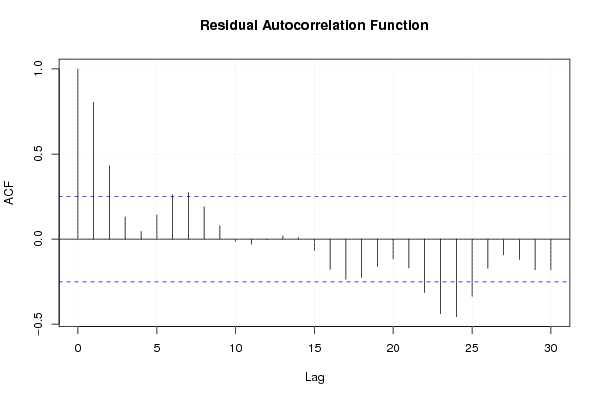
| Multiple Linear Regression - Residual Statistics | |
| Residual Standard Deviation | 22.8968501011770 |
| Sum Squared Residuals | 24640.4899941212 |
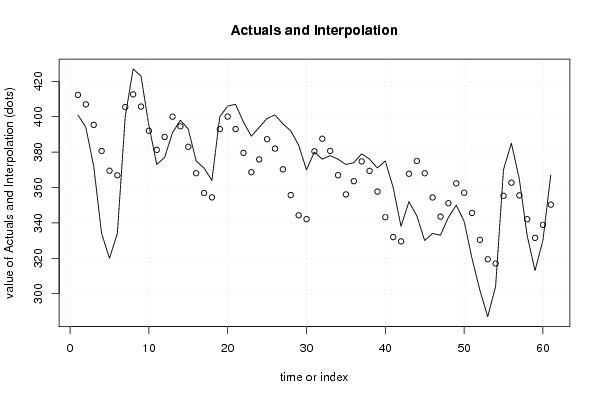
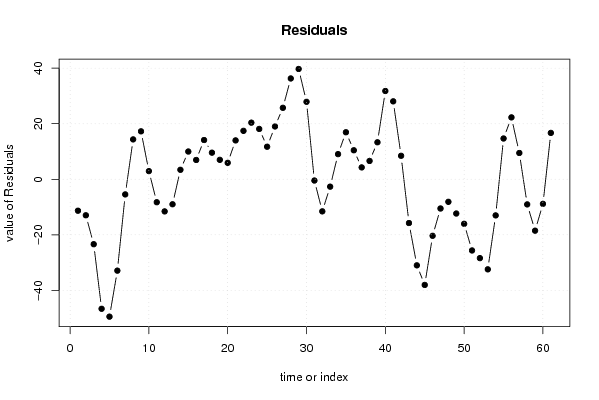
| Multiple Linear Regression - Actuals, Interpolation, and Residuals | |||
| Time or Index | Actuals | Interpolation Forecast | Residuals Prediction Error |
| 1 | 401 | 412.32228193731 | -11.3222819373099 |
| 2 | 394 | 406.972974098748 | -12.9729740987476 |
| 3 | 372 | 395.387641502217 | -23.3876415022173 |
| 4 | 334 | 380.640535438587 | -46.6405354385868 |
| 5 | 320 | 369.475274025752 | -49.4752740257518 |
| 6 | 334 | 366.903333515005 | -32.9033335150051 |
| 7 | 400 | 405.455118319947 | -5.45511831994658 |
| 8 | 427 | 412.646637934921 | 14.3533620650791 |
| 9 | 423 | 405.740970244366 | 17.2590297556339 |
| 10 | 395 | 392.066579518048 | 2.93342048195222 |
| 11 | 373 | 381.265125737758 | -8.26512573775767 |
| 12 | 377 | 388.574951916119 | -11.5749519161191 |
| 13 | 391 | 400.009696311632 | -9.009696311632 |
| 14 | 398 | 394.595193752308 | 3.40480624769224 |
| 15 | 393 | 383.013072995953 | 9.98692700404674 |
| 16 | 375 | 368.053421999985 | 6.94657800001536 |
| 17 | 371 | 356.868157021142 | 14.1318429788578 |
| 18 | 364 | 354.426662299993 | 9.57333770000674 |
| 19 | 400 | 393.002028773594 | 6.99797122640577 |
| 20 | 406 | 400.079443540216 | 5.92055645978371 |
| 21 | 407 | 393.011380702525 | 13.9886192974749 |
| 22 | 397 | 379.565453239241 | 17.4345467607591 |
| 23 | 389 | 368.621269789382 | 20.3787302106177 |
| 24 | 394 | 375.880946182542 | 18.1190538174581 |
| 25 | 399 | 387.28345948015 | 11.7165405198501 |
| 26 | 401 | 381.985597432475 | 19.0144025675254 |
| 27 | 396 | 370.270241656896 | 25.729758343104 |
| 28 | 392 | 355.697307487713 | 36.3026925122867 |
| 29 | 384 | 344.276817477045 | 39.7231825229545 |
| 30 | 370 | 342.107793864147 | 27.8922061358529 |
| 31 | 380 | 380.456021254435 | -0.456021254435470 |
| 32 | 376 | 387.557214907973 | -11.5572149079734 |
| 33 | 378 | 380.665380669404 | -2.66538066940401 |
| 34 | 376 | 366.950926462998 | 9.04907353700247 |
| 35 | 373 | 356.076079317286 | 16.9239206827142 |
| 36 | 374 | 363.561063481377 | 10.4389365186229 |
| 37 | 379 | 374.734409165035 | 4.2655908349649 |
| 38 | 376 | 369.403245406063 | 6.59675459393705 |
| 39 | 371 | 357.689749116902 | 13.3102508830981 |
| 40 | 375 | 343.2117896252 | 31.7882103748004 |
| 41 | 360 | 331.942368798943 | 28.0576312010572 |
| 42 | 338 | 329.547981067040 | 8.45201893296043 |
| 43 | 352 | 367.767227717635 | -15.7672277176349 |
| 44 | 344 | 374.997120370500 | -30.9971203704996 |
| 45 | 330 | 368.045698044457 | -38.0456980444573 |
| 46 | 334 | 354.361869015868 | -20.3618690158678 |
| 47 | 333 | 343.523817161995 | -10.5238171619951 |
| 48 | 343 | 351.123413307098 | -8.12341330709804 |
| 49 | 350 | 362.339780744690 | -12.3397807446904 |
| 50 | 341 | 357.042989310407 | -16.0429893104070 |
| 51 | 320 | 345.639294728032 | -25.6392947280315 |
| 52 | 302 | 330.396945448516 | -28.3969454485156 |
| 53 | 287 | 319.437382677118 | -32.4373826771176 |
| 54 | 304 | 317.014229253815 | -13.0142292538149 |
| 55 | 370 | 355.319603934389 | 14.6803960656112 |
| 56 | 385 | 362.71958324639 | 22.2804167536101 |
| 57 | 365 | 355.536570339247 | 9.46342966075253 |
| 58 | 333 | 342.055171763846 | -9.05517176384593 |
| 59 | 313 | 331.513707993579 | -18.5137079935792 |
| 60 | 330 | 338.859625112864 | -8.85962511286389 |
| 61 | 367 | 350.310372361183 | 16.6896276388172 |
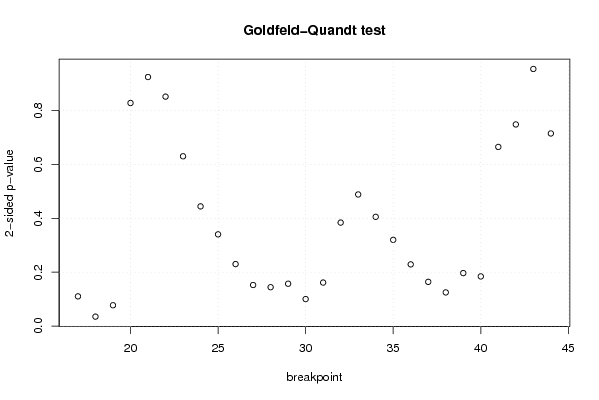
| Goldfeld-Quandt test for Heteroskedasticity | |||
| p-values | Alternative Hypothesis | ||
| breakpoint index | greater | 2-sided | less |
| 17 | 0.0551487505532761 | 0.110297501106552 | 0.944851249446724 |
| 18 | 0.0174735385647804 | 0.0349470771295608 | 0.98252646143522 |
| 19 | 0.0386114333343126 | 0.0772228666686252 | 0.961388566665687 |
| 20 | 0.413973951537776 | 0.827947903075551 | 0.586026048462224 |
| 21 | 0.537793291631677 | 0.924413416736646 | 0.462206708368323 |
| 22 | 0.425768943352035 | 0.85153788670407 | 0.574231056647965 |
| 23 | 0.315064701286897 | 0.630129402573794 | 0.684935298713103 |
| 24 | 0.222106440758586 | 0.444212881517171 | 0.777893559241414 |
| 25 | 0.170201798652701 | 0.340403597305402 | 0.829798201347299 |
| 26 | 0.115038719672443 | 0.230077439344887 | 0.884961280327557 |
| 27 | 0.0761837712162595 | 0.152367542432519 | 0.92381622878374 |
| 28 | 0.0721165099217812 | 0.144233019843562 | 0.927883490078219 |
| 29 | 0.078560786396099 | 0.157121572792198 | 0.9214392136039 |
| 30 | 0.0500830077104435 | 0.100166015420887 | 0.949916992289557 |
| 31 | 0.0807243804694465 | 0.161448760938893 | 0.919275619530553 |
| 32 | 0.192050222444525 | 0.384100444889051 | 0.807949777555475 |
| 33 | 0.244215712394809 | 0.488431424789618 | 0.755784287605191 |
| 34 | 0.202721794058848 | 0.405443588117697 | 0.797278205941152 |
| 35 | 0.160028535124598 | 0.320057070249196 | 0.839971464875402 |
| 36 | 0.114484504644782 | 0.228969009289563 | 0.885515495355218 |
| 37 | 0.0820586557301155 | 0.164117311460231 | 0.917941344269884 |
| 38 | 0.062460689060049 | 0.124921378120098 | 0.937539310939951 |
| 39 | 0.098310601894288 | 0.196621203788576 | 0.901689398105712 |
| 40 | 0.0921590016477914 | 0.184318003295583 | 0.907840998352209 |
| 41 | 0.332438396113481 | 0.664876792226962 | 0.667561603886519 |
| 42 | 0.625822655704349 | 0.748354688591303 | 0.374177344295651 |
| 43 | 0.522839768532824 | 0.954320462934352 | 0.477160231467176 |
| 44 | 0.642535187818652 | 0.714929624362696 | 0.357464812181348 |
| Meta Analysis of Goldfeld-Quandt test for Heteroskedasticity | |||
| Description | # significant tests | % significant tests | OK/NOK |
| 1% type I error level | 0 | 0 | OK |
| 5% type I error level | 1 | 0.0357142857142857 | OK |
| 10% type I error level | 2 | 0.0714285714285714 | OK |