Free Statistics

of Irreproducible Research!

Author's title

Author*The author of this computation has been verified*
R Software Modulerwasp_multipleregression.wasp
Title produced by softwareMultiple Regression
Date of computationWed, 30 Dec 2009 09:37:41 -0700
Cite this page as followsStatistical Computations at FreeStatistics.org, Office for Research Development and Education, URL https://freestatistics.org/blog/index.php?v=date/2009/Dec/30/t12621911221vo89p0x6tmzkyc.htm/, Retrieved Mon, 29 Apr 2024 04:04:21 +0000
Statistical Computations at FreeStatistics.org, Office for Research Development and Education, URL https://freestatistics.org/blog/index.php?pk=71323, Retrieved Mon, 29 Apr 2024 04:04:21 +0000
QR Codes:

Original text written by user:
IsPrivate?No (this computation is public)
User-defined keywords
Estimated Impact132
Family? (F = Feedback message, R = changed R code, M = changed R Module, P = changed Parameters, D = changed Data)
-     [ARIMA Backward Selection] [arima backward se...] [2008-12-17 10:56:10] [11edab5c4db3615abbf782b1c6e7cacf]
- RMPD  [Central Tendency] [central tendency ...] [2008-12-23 10:31:31] [74be16979710d4c4e7c6647856088456]
- RMPD    [ARIMA Forecasting] [paper arima forec...] [2009-12-30 15:31:43] [db72903d7941c8279d5ce0e4e873d517]
- RMPD        [Multiple Regression] [paper multiple re...] [2009-12-30 16:37:41] [1b03feaac1d41902024770a37504c07f] [Current]
Feedback Forum

Post a new message
Dataseries X:
4223.4 401
4627.3 394
5175.3 372
4550.7 334
4639.3 320
5498.7 334
5031.0 400
4033.3 427
4643.5 423
4873.2 395
4608.7 373
4733.5 377
3955.6 391
4590.9 398
5127.5 393
5257.3 375
5416.9 371
5813.3 364
5261.9 400
4669.2 406
5855.8 407
5274.6 397
5516.7 389
5819.5 394
5156.0 399
5377.3 401
6386.8 396
5144.0 392
6138.5 384
5567.8 370
5822.6 380
5145.5 376
5706.6 378
6078.5 376
6074.5 373
5577.6 374
5727.5 379
6067.0 376
7069.9 371
5490.0 375
5948.3 360
6177.5 338
6890.1 352
5756.2 344
6528.8 330
6792.0 334
6657.4 333
5753.7 343
5750.9 350
5968.4 341
5871.7 320
7004.9 302
6363.4 287
6694.7 304
7101.6 370
5364.0 385
6958.6 365
6503.3 333
5316.0 313
5312.7 330
4478.0 367


Summary of computational transaction
Raw Inputview raw input (R code)
Raw Outputview raw output of R engine
Computing time3 seconds
R Server'Gwilym Jenkins' @ 72.249.127.135

\begin{tabular}{lllllllll}
\hline
Summary of computational transaction \tabularnewline
Raw Input & view raw input (R code)  \tabularnewline
Raw Output & view raw output of R engine  \tabularnewline
Computing time & 3 seconds \tabularnewline
R Server & 'Gwilym Jenkins' @ 72.249.127.135 \tabularnewline
\hline
\end{tabular}
%Source: https://freestatistics.org/blog/index.php?pk=71323&T=0

[TABLE]
[ROW][C]Summary of computational transaction[/C][/ROW]
[ROW][C]Raw Input[/C][C]view raw input (R code) [/C][/ROW]
[ROW][C]Raw Output[/C][C]view raw output of R engine [/C][/ROW]
[ROW][C]Computing time[/C][C]3 seconds[/C][/ROW]
[ROW][C]R Server[/C][C]'Gwilym Jenkins' @ 72.249.127.135[/C][/ROW]
[/TABLE]
Source: https://freestatistics.org/blog/index.php?pk=71323&T=0

Globally Unique Identifier (entire table): ba.freestatistics.org/blog/index.php?pk=71323&T=0

As an alternative you can also use a QR Code:  

The GUIDs for individual cells are displayed in the table below:

Summary of computational transaction
Raw Inputview raw input (R code)
Raw Outputview raw output of R engine
Computing time3 seconds
R Server'Gwilym Jenkins' @ 72.249.127.135


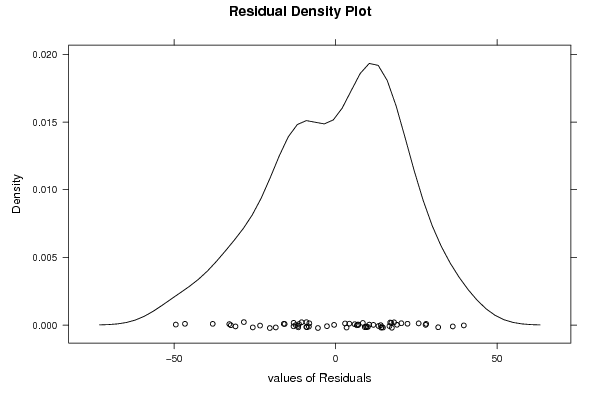
Multiple Linear Regression - Estimated Regression Equation
Werkloosheid[t] = + 402.296605635782 -0.000281740366301887Export[t] + 12.2479148725478M1[t] + 8.04473827591623M2[t] -2.35386429189957M3[t] -16.2446090803411M4[t] -26.3525719887406M5[t] -27.6500485207064M6[t] + 11.8023026228968M7[t] + 19.7450661823929M8[t] + 14.0436527713366M9[t] + 1.46631411513886M10[t] -8.37732368405701M11[t] -1.03233630798111t + e[t]

\begin{tabular}{lllllllll}
\hline
Multiple Linear Regression - Estimated Regression Equation \tabularnewline
Werkloosheid[t] =  +  402.296605635782 -0.000281740366301887Export[t] +  12.2479148725478M1[t] +  8.04473827591623M2[t] -2.35386429189957M3[t] -16.2446090803411M4[t] -26.3525719887406M5[t] -27.6500485207064M6[t] +  11.8023026228968M7[t] +  19.7450661823929M8[t] +  14.0436527713366M9[t] +  1.46631411513886M10[t] -8.37732368405701M11[t] -1.03233630798111t  + e[t] \tabularnewline
\hline
\end{tabular}
%Source: https://freestatistics.org/blog/index.php?pk=71323&T=1

[TABLE]
[ROW][C]Multiple Linear Regression - Estimated Regression Equation[/C][/ROW]
[ROW][C]Werkloosheid[t] =  +  402.296605635782 -0.000281740366301887Export[t] +  12.2479148725478M1[t] +  8.04473827591623M2[t] -2.35386429189957M3[t] -16.2446090803411M4[t] -26.3525719887406M5[t] -27.6500485207064M6[t] +  11.8023026228968M7[t] +  19.7450661823929M8[t] +  14.0436527713366M9[t] +  1.46631411513886M10[t] -8.37732368405701M11[t] -1.03233630798111t  + e[t][/C][/ROW]
[/TABLE]
Source: https://freestatistics.org/blog/index.php?pk=71323&T=1

Globally Unique Identifier (entire table): ba.freestatistics.org/blog/index.php?pk=71323&T=1

As an alternative you can also use a QR Code:  

The GUIDs for individual cells are displayed in the table below:

Multiple Linear Regression - Estimated Regression Equation
Werkloosheid[t] = + 402.296605635782 -0.000281740366301887Export[t] + 12.2479148725478M1[t] + 8.04473827591623M2[t] -2.35386429189957M3[t] -16.2446090803411M4[t] -26.3525719887406M5[t] -27.6500485207064M6[t] + 11.8023026228968M7[t] + 19.7450661823929M8[t] + 14.0436527713366M9[t] + 1.46631411513886M10[t] -8.37732368405701M11[t] -1.03233630798111t + e[t]


Multiple Linear Regression - Ordinary Least Squares
VariableParameterS.D.T-STATH0: parameter = 02-tail p-value1-tail p-value
(Intercept)402.29660563578231.80524312.648800
Export-0.0002817403663018870.006777-0.04160.9670150.483508
M112.247914872547814.1608890.86490.3914810.19574
M28.0447382759162314.6356250.54970.585150.292575
M3-2.3538642918995715.442257-0.15240.87950.43975
M4-16.244609080341114.677951-1.10670.2740410.13702
M5-26.352571988740614.879461-1.77110.0830330.041517
M6-27.650048520706415.256046-1.81240.0763150.038158
M711.802302622896815.3331470.76970.4453150.222657
M819.745066182392914.6632581.34660.1845780.092289
M914.043652771336615.0315050.93430.3549340.177467
M101.4663141151388614.916320.09830.922110.461055
M11-8.3773236840570114.562618-0.57530.5678580.283929
t-1.032336307981110.265501-3.88830.0003160.000158

\begin{tabular}{lllllllll}
\hline
Multiple Linear Regression - Ordinary Least Squares \tabularnewline
Variable & Parameter & S.D. & T-STATH0: parameter = 0 & 2-tail p-value & 1-tail p-value \tabularnewline
(Intercept) & 402.296605635782 & 31.805243 & 12.6488 & 0 & 0 \tabularnewline
Export & -0.000281740366301887 & 0.006777 & -0.0416 & 0.967015 & 0.483508 \tabularnewline
M1 & 12.2479148725478 & 14.160889 & 0.8649 & 0.391481 & 0.19574 \tabularnewline
M2 & 8.04473827591623 & 14.635625 & 0.5497 & 0.58515 & 0.292575 \tabularnewline
M3 & -2.35386429189957 & 15.442257 & -0.1524 & 0.8795 & 0.43975 \tabularnewline
M4 & -16.2446090803411 & 14.677951 & -1.1067 & 0.274041 & 0.13702 \tabularnewline
M5 & -26.3525719887406 & 14.879461 & -1.7711 & 0.083033 & 0.041517 \tabularnewline
M6 & -27.6500485207064 & 15.256046 & -1.8124 & 0.076315 & 0.038158 \tabularnewline
M7 & 11.8023026228968 & 15.333147 & 0.7697 & 0.445315 & 0.222657 \tabularnewline
M8 & 19.7450661823929 & 14.663258 & 1.3466 & 0.184578 & 0.092289 \tabularnewline
M9 & 14.0436527713366 & 15.031505 & 0.9343 & 0.354934 & 0.177467 \tabularnewline
M10 & 1.46631411513886 & 14.91632 & 0.0983 & 0.92211 & 0.461055 \tabularnewline
M11 & -8.37732368405701 & 14.562618 & -0.5753 & 0.567858 & 0.283929 \tabularnewline
t & -1.03233630798111 & 0.265501 & -3.8883 & 0.000316 & 0.000158 \tabularnewline
\hline
\end{tabular}
%Source: https://freestatistics.org/blog/index.php?pk=71323&T=2

[TABLE]
[ROW][C]Multiple Linear Regression - Ordinary Least Squares[/C][/ROW]
[ROW][C]Variable[/C][C]Parameter[/C][C]S.D.[/C][C]T-STATH0: parameter = 0[/C][C]2-tail p-value[/C][C]1-tail p-value[/C][/ROW]
[ROW][C](Intercept)[/C][C]402.296605635782[/C][C]31.805243[/C][C]12.6488[/C][C]0[/C][C]0[/C][/ROW]
[ROW][C]Export[/C][C]-0.000281740366301887[/C][C]0.006777[/C][C]-0.0416[/C][C]0.967015[/C][C]0.483508[/C][/ROW]
[ROW][C]M1[/C][C]12.2479148725478[/C][C]14.160889[/C][C]0.8649[/C][C]0.391481[/C][C]0.19574[/C][/ROW]
[ROW][C]M2[/C][C]8.04473827591623[/C][C]14.635625[/C][C]0.5497[/C][C]0.58515[/C][C]0.292575[/C][/ROW]
[ROW][C]M3[/C][C]-2.35386429189957[/C][C]15.442257[/C][C]-0.1524[/C][C]0.8795[/C][C]0.43975[/C][/ROW]
[ROW][C]M4[/C][C]-16.2446090803411[/C][C]14.677951[/C][C]-1.1067[/C][C]0.274041[/C][C]0.13702[/C][/ROW]
[ROW][C]M5[/C][C]-26.3525719887406[/C][C]14.879461[/C][C]-1.7711[/C][C]0.083033[/C][C]0.041517[/C][/ROW]
[ROW][C]M6[/C][C]-27.6500485207064[/C][C]15.256046[/C][C]-1.8124[/C][C]0.076315[/C][C]0.038158[/C][/ROW]
[ROW][C]M7[/C][C]11.8023026228968[/C][C]15.333147[/C][C]0.7697[/C][C]0.445315[/C][C]0.222657[/C][/ROW]
[ROW][C]M8[/C][C]19.7450661823929[/C][C]14.663258[/C][C]1.3466[/C][C]0.184578[/C][C]0.092289[/C][/ROW]
[ROW][C]M9[/C][C]14.0436527713366[/C][C]15.031505[/C][C]0.9343[/C][C]0.354934[/C][C]0.177467[/C][/ROW]
[ROW][C]M10[/C][C]1.46631411513886[/C][C]14.91632[/C][C]0.0983[/C][C]0.92211[/C][C]0.461055[/C][/ROW]
[ROW][C]M11[/C][C]-8.37732368405701[/C][C]14.562618[/C][C]-0.5753[/C][C]0.567858[/C][C]0.283929[/C][/ROW]
[ROW][C]t[/C][C]-1.03233630798111[/C][C]0.265501[/C][C]-3.8883[/C][C]0.000316[/C][C]0.000158[/C][/ROW]
[/TABLE]
Source: https://freestatistics.org/blog/index.php?pk=71323&T=2

Globally Unique Identifier (entire table): ba.freestatistics.org/blog/index.php?pk=71323&T=2

As an alternative you can also use a QR Code:  

The GUIDs for individual cells are displayed in the table below:

Multiple Linear Regression - Ordinary Least Squares
VariableParameterS.D.T-STATH0: parameter = 02-tail p-value1-tail p-value
(Intercept)402.29660563578231.80524312.648800
Export-0.0002817403663018870.006777-0.04160.9670150.483508
M112.247914872547814.1608890.86490.3914810.19574
M28.0447382759162314.6356250.54970.585150.292575
M3-2.3538642918995715.442257-0.15240.87950.43975
M4-16.244609080341114.677951-1.10670.2740410.13702
M5-26.352571988740614.879461-1.77110.0830330.041517
M6-27.650048520706415.256046-1.81240.0763150.038158
M711.802302622896815.3331470.76970.4453150.222657
M819.745066182392914.6632581.34660.1845780.092289
M914.043652771336615.0315050.93430.3549340.177467
M101.4663141151388614.916320.09830.922110.461055
M11-8.3773236840570114.562618-0.57530.5678580.283929
t-1.032336307981110.265501-3.88830.0003160.000158


Multiple Linear Regression - Regression Statistics
Multiple R0.757394894570616
R-squared0.573647026321634
Adjusted R-squared0.455719608070171
F-TEST (value)4.86440757227819
F-TEST (DF numerator)13
F-TEST (DF denominator)47
p-value2.72288071523352e-05
Multiple Linear Regression - Residual Statistics
Residual Standard Deviation22.8968501011770
Sum Squared Residuals24640.4899941212

\begin{tabular}{lllllllll}
\hline
Multiple Linear Regression - Regression Statistics \tabularnewline
Multiple R & 0.757394894570616 \tabularnewline
R-squared & 0.573647026321634 \tabularnewline
Adjusted R-squared & 0.455719608070171 \tabularnewline
F-TEST (value) & 4.86440757227819 \tabularnewline
F-TEST (DF numerator) & 13 \tabularnewline
F-TEST (DF denominator) & 47 \tabularnewline
p-value & 2.72288071523352e-05 \tabularnewline
Multiple Linear Regression - Residual Statistics \tabularnewline
Residual Standard Deviation & 22.8968501011770 \tabularnewline
Sum Squared Residuals & 24640.4899941212 \tabularnewline
\hline
\end{tabular}
%Source: https://freestatistics.org/blog/index.php?pk=71323&T=3

[TABLE]
[ROW][C]Multiple Linear Regression - Regression Statistics[/C][/ROW]
[ROW][C]Multiple R[/C][C]0.757394894570616[/C][/ROW]
[ROW][C]R-squared[/C][C]0.573647026321634[/C][/ROW]
[ROW][C]Adjusted R-squared[/C][C]0.455719608070171[/C][/ROW]
[ROW][C]F-TEST (value)[/C][C]4.86440757227819[/C][/ROW]
[ROW][C]F-TEST (DF numerator)[/C][C]13[/C][/ROW]
[ROW][C]F-TEST (DF denominator)[/C][C]47[/C][/ROW]
[ROW][C]p-value[/C][C]2.72288071523352e-05[/C][/ROW]
[ROW][C]Multiple Linear Regression - Residual Statistics[/C][/ROW]
[ROW][C]Residual Standard Deviation[/C][C]22.8968501011770[/C][/ROW]
[ROW][C]Sum Squared Residuals[/C][C]24640.4899941212[/C][/ROW]
[/TABLE]
Source: https://freestatistics.org/blog/index.php?pk=71323&T=3

Globally Unique Identifier (entire table): ba.freestatistics.org/blog/index.php?pk=71323&T=3

As an alternative you can also use a QR Code:  

The GUIDs for individual cells are displayed in the table below:

Multiple Linear Regression - Regression Statistics
Multiple R0.757394894570616
R-squared0.573647026321634
Adjusted R-squared0.455719608070171
F-TEST (value)4.86440757227819
F-TEST (DF numerator)13
F-TEST (DF denominator)47
p-value2.72288071523352e-05
Multiple Linear Regression - Residual Statistics
Residual Standard Deviation22.8968501011770
Sum Squared Residuals24640.4899941212


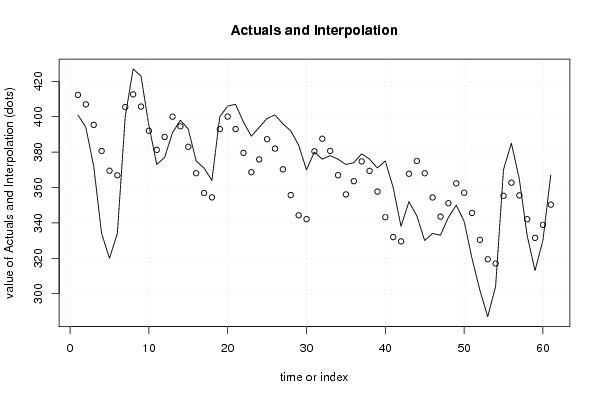
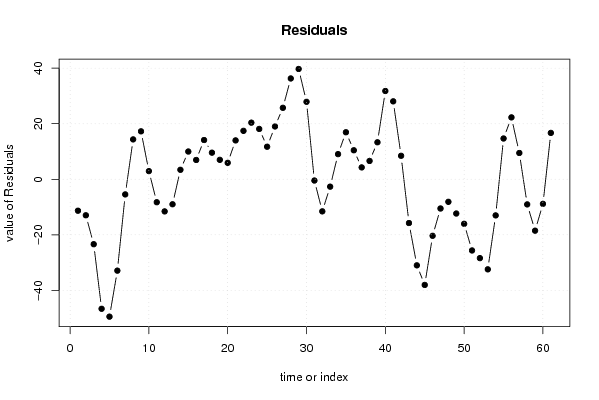
Multiple Linear Regression - Actuals, Interpolation, and Residuals
Time or IndexActualsInterpolationForecastResidualsPrediction Error
1401412.32228193731-11.3222819373099
2394406.972974098748-12.9729740987476
3372395.387641502217-23.3876415022173
4334380.640535438587-46.6405354385868
5320369.475274025752-49.4752740257518
6334366.903333515005-32.9033335150051
7400405.455118319947-5.45511831994658
8427412.64663793492114.3533620650791
9423405.74097024436617.2590297556339
10395392.0665795180482.93342048195222
11373381.265125737758-8.26512573775767
12377388.574951916119-11.5749519161191
13391400.009696311632-9.009696311632
14398394.5951937523083.40480624769224
15393383.0130729959539.98692700404674
16375368.0534219999856.94657800001536
17371356.86815702114214.1318429788578
18364354.4266622999939.57333770000674
19400393.0020287735946.99797122640577
20406400.0794435402165.92055645978371
21407393.01138070252513.9886192974749
22397379.56545323924117.4345467607591
23389368.62126978938220.3787302106177
24394375.88094618254218.1190538174581
25399387.2834594801511.7165405198501
26401381.98559743247519.0144025675254
27396370.27024165689625.729758343104
28392355.69730748771336.3026925122867
29384344.27681747704539.7231825229545
30370342.10779386414727.8922061358529
31380380.456021254435-0.456021254435470
32376387.557214907973-11.5572149079734
33378380.665380669404-2.66538066940401
34376366.9509264629989.04907353700247
35373356.07607931728616.9239206827142
36374363.56106348137710.4389365186229
37379374.7344091650354.2655908349649
38376369.4032454060636.59675459393705
39371357.68974911690213.3102508830981
40375343.211789625231.7882103748004
41360331.94236879894328.0576312010572
42338329.5479810670408.45201893296043
43352367.767227717635-15.7672277176349
44344374.997120370500-30.9971203704996
45330368.045698044457-38.0456980444573
46334354.361869015868-20.3618690158678
47333343.523817161995-10.5238171619951
48343351.123413307098-8.12341330709804
49350362.339780744690-12.3397807446904
50341357.042989310407-16.0429893104070
51320345.639294728032-25.6392947280315
52302330.396945448516-28.3969454485156
53287319.437382677118-32.4373826771176
54304317.014229253815-13.0142292538149
55370355.31960393438914.6803960656112
56385362.7195832463922.2804167536101
57365355.5365703392479.46342966075253
58333342.055171763846-9.05517176384593
59313331.513707993579-18.5137079935792
60330338.859625112864-8.85962511286389
61367350.31037236118316.6896276388172

\begin{tabular}{lllllllll}
\hline
Multiple Linear Regression - Actuals, Interpolation, and Residuals \tabularnewline
Time or Index & Actuals & InterpolationForecast & ResidualsPrediction Error \tabularnewline
1 & 401 & 412.32228193731 & -11.3222819373099 \tabularnewline
2 & 394 & 406.972974098748 & -12.9729740987476 \tabularnewline
3 & 372 & 395.387641502217 & -23.3876415022173 \tabularnewline
4 & 334 & 380.640535438587 & -46.6405354385868 \tabularnewline
5 & 320 & 369.475274025752 & -49.4752740257518 \tabularnewline
6 & 334 & 366.903333515005 & -32.9033335150051 \tabularnewline
7 & 400 & 405.455118319947 & -5.45511831994658 \tabularnewline
8 & 427 & 412.646637934921 & 14.3533620650791 \tabularnewline
9 & 423 & 405.740970244366 & 17.2590297556339 \tabularnewline
10 & 395 & 392.066579518048 & 2.93342048195222 \tabularnewline
11 & 373 & 381.265125737758 & -8.26512573775767 \tabularnewline
12 & 377 & 388.574951916119 & -11.5749519161191 \tabularnewline
13 & 391 & 400.009696311632 & -9.009696311632 \tabularnewline
14 & 398 & 394.595193752308 & 3.40480624769224 \tabularnewline
15 & 393 & 383.013072995953 & 9.98692700404674 \tabularnewline
16 & 375 & 368.053421999985 & 6.94657800001536 \tabularnewline
17 & 371 & 356.868157021142 & 14.1318429788578 \tabularnewline
18 & 364 & 354.426662299993 & 9.57333770000674 \tabularnewline
19 & 400 & 393.002028773594 & 6.99797122640577 \tabularnewline
20 & 406 & 400.079443540216 & 5.92055645978371 \tabularnewline
21 & 407 & 393.011380702525 & 13.9886192974749 \tabularnewline
22 & 397 & 379.565453239241 & 17.4345467607591 \tabularnewline
23 & 389 & 368.621269789382 & 20.3787302106177 \tabularnewline
24 & 394 & 375.880946182542 & 18.1190538174581 \tabularnewline
25 & 399 & 387.28345948015 & 11.7165405198501 \tabularnewline
26 & 401 & 381.985597432475 & 19.0144025675254 \tabularnewline
27 & 396 & 370.270241656896 & 25.729758343104 \tabularnewline
28 & 392 & 355.697307487713 & 36.3026925122867 \tabularnewline
29 & 384 & 344.276817477045 & 39.7231825229545 \tabularnewline
30 & 370 & 342.107793864147 & 27.8922061358529 \tabularnewline
31 & 380 & 380.456021254435 & -0.456021254435470 \tabularnewline
32 & 376 & 387.557214907973 & -11.5572149079734 \tabularnewline
33 & 378 & 380.665380669404 & -2.66538066940401 \tabularnewline
34 & 376 & 366.950926462998 & 9.04907353700247 \tabularnewline
35 & 373 & 356.076079317286 & 16.9239206827142 \tabularnewline
36 & 374 & 363.561063481377 & 10.4389365186229 \tabularnewline
37 & 379 & 374.734409165035 & 4.2655908349649 \tabularnewline
38 & 376 & 369.403245406063 & 6.59675459393705 \tabularnewline
39 & 371 & 357.689749116902 & 13.3102508830981 \tabularnewline
40 & 375 & 343.2117896252 & 31.7882103748004 \tabularnewline
41 & 360 & 331.942368798943 & 28.0576312010572 \tabularnewline
42 & 338 & 329.547981067040 & 8.45201893296043 \tabularnewline
43 & 352 & 367.767227717635 & -15.7672277176349 \tabularnewline
44 & 344 & 374.997120370500 & -30.9971203704996 \tabularnewline
45 & 330 & 368.045698044457 & -38.0456980444573 \tabularnewline
46 & 334 & 354.361869015868 & -20.3618690158678 \tabularnewline
47 & 333 & 343.523817161995 & -10.5238171619951 \tabularnewline
48 & 343 & 351.123413307098 & -8.12341330709804 \tabularnewline
49 & 350 & 362.339780744690 & -12.3397807446904 \tabularnewline
50 & 341 & 357.042989310407 & -16.0429893104070 \tabularnewline
51 & 320 & 345.639294728032 & -25.6392947280315 \tabularnewline
52 & 302 & 330.396945448516 & -28.3969454485156 \tabularnewline
53 & 287 & 319.437382677118 & -32.4373826771176 \tabularnewline
54 & 304 & 317.014229253815 & -13.0142292538149 \tabularnewline
55 & 370 & 355.319603934389 & 14.6803960656112 \tabularnewline
56 & 385 & 362.71958324639 & 22.2804167536101 \tabularnewline
57 & 365 & 355.536570339247 & 9.46342966075253 \tabularnewline
58 & 333 & 342.055171763846 & -9.05517176384593 \tabularnewline
59 & 313 & 331.513707993579 & -18.5137079935792 \tabularnewline
60 & 330 & 338.859625112864 & -8.85962511286389 \tabularnewline
61 & 367 & 350.310372361183 & 16.6896276388172 \tabularnewline
\hline
\end{tabular}
%Source: https://freestatistics.org/blog/index.php?pk=71323&T=4

[TABLE]
[ROW][C]Multiple Linear Regression - Actuals, Interpolation, and Residuals[/C][/ROW]
[ROW][C]Time or Index[/C][C]Actuals[/C][C]InterpolationForecast[/C][C]ResidualsPrediction Error[/C][/ROW]
[ROW][C]1[/C][C]401[/C][C]412.32228193731[/C][C]-11.3222819373099[/C][/ROW]
[ROW][C]2[/C][C]394[/C][C]406.972974098748[/C][C]-12.9729740987476[/C][/ROW]
[ROW][C]3[/C][C]372[/C][C]395.387641502217[/C][C]-23.3876415022173[/C][/ROW]
[ROW][C]4[/C][C]334[/C][C]380.640535438587[/C][C]-46.6405354385868[/C][/ROW]
[ROW][C]5[/C][C]320[/C][C]369.475274025752[/C][C]-49.4752740257518[/C][/ROW]
[ROW][C]6[/C][C]334[/C][C]366.903333515005[/C][C]-32.9033335150051[/C][/ROW]
[ROW][C]7[/C][C]400[/C][C]405.455118319947[/C][C]-5.45511831994658[/C][/ROW]
[ROW][C]8[/C][C]427[/C][C]412.646637934921[/C][C]14.3533620650791[/C][/ROW]
[ROW][C]9[/C][C]423[/C][C]405.740970244366[/C][C]17.2590297556339[/C][/ROW]
[ROW][C]10[/C][C]395[/C][C]392.066579518048[/C][C]2.93342048195222[/C][/ROW]
[ROW][C]11[/C][C]373[/C][C]381.265125737758[/C][C]-8.26512573775767[/C][/ROW]
[ROW][C]12[/C][C]377[/C][C]388.574951916119[/C][C]-11.5749519161191[/C][/ROW]
[ROW][C]13[/C][C]391[/C][C]400.009696311632[/C][C]-9.009696311632[/C][/ROW]
[ROW][C]14[/C][C]398[/C][C]394.595193752308[/C][C]3.40480624769224[/C][/ROW]
[ROW][C]15[/C][C]393[/C][C]383.013072995953[/C][C]9.98692700404674[/C][/ROW]
[ROW][C]16[/C][C]375[/C][C]368.053421999985[/C][C]6.94657800001536[/C][/ROW]
[ROW][C]17[/C][C]371[/C][C]356.868157021142[/C][C]14.1318429788578[/C][/ROW]
[ROW][C]18[/C][C]364[/C][C]354.426662299993[/C][C]9.57333770000674[/C][/ROW]
[ROW][C]19[/C][C]400[/C][C]393.002028773594[/C][C]6.99797122640577[/C][/ROW]
[ROW][C]20[/C][C]406[/C][C]400.079443540216[/C][C]5.92055645978371[/C][/ROW]
[ROW][C]21[/C][C]407[/C][C]393.011380702525[/C][C]13.9886192974749[/C][/ROW]
[ROW][C]22[/C][C]397[/C][C]379.565453239241[/C][C]17.4345467607591[/C][/ROW]
[ROW][C]23[/C][C]389[/C][C]368.621269789382[/C][C]20.3787302106177[/C][/ROW]
[ROW][C]24[/C][C]394[/C][C]375.880946182542[/C][C]18.1190538174581[/C][/ROW]
[ROW][C]25[/C][C]399[/C][C]387.28345948015[/C][C]11.7165405198501[/C][/ROW]
[ROW][C]26[/C][C]401[/C][C]381.985597432475[/C][C]19.0144025675254[/C][/ROW]
[ROW][C]27[/C][C]396[/C][C]370.270241656896[/C][C]25.729758343104[/C][/ROW]
[ROW][C]28[/C][C]392[/C][C]355.697307487713[/C][C]36.3026925122867[/C][/ROW]
[ROW][C]29[/C][C]384[/C][C]344.276817477045[/C][C]39.7231825229545[/C][/ROW]
[ROW][C]30[/C][C]370[/C][C]342.107793864147[/C][C]27.8922061358529[/C][/ROW]
[ROW][C]31[/C][C]380[/C][C]380.456021254435[/C][C]-0.456021254435470[/C][/ROW]
[ROW][C]32[/C][C]376[/C][C]387.557214907973[/C][C]-11.5572149079734[/C][/ROW]
[ROW][C]33[/C][C]378[/C][C]380.665380669404[/C][C]-2.66538066940401[/C][/ROW]
[ROW][C]34[/C][C]376[/C][C]366.950926462998[/C][C]9.04907353700247[/C][/ROW]
[ROW][C]35[/C][C]373[/C][C]356.076079317286[/C][C]16.9239206827142[/C][/ROW]
[ROW][C]36[/C][C]374[/C][C]363.561063481377[/C][C]10.4389365186229[/C][/ROW]
[ROW][C]37[/C][C]379[/C][C]374.734409165035[/C][C]4.2655908349649[/C][/ROW]
[ROW][C]38[/C][C]376[/C][C]369.403245406063[/C][C]6.59675459393705[/C][/ROW]
[ROW][C]39[/C][C]371[/C][C]357.689749116902[/C][C]13.3102508830981[/C][/ROW]
[ROW][C]40[/C][C]375[/C][C]343.2117896252[/C][C]31.7882103748004[/C][/ROW]
[ROW][C]41[/C][C]360[/C][C]331.942368798943[/C][C]28.0576312010572[/C][/ROW]
[ROW][C]42[/C][C]338[/C][C]329.547981067040[/C][C]8.45201893296043[/C][/ROW]
[ROW][C]43[/C][C]352[/C][C]367.767227717635[/C][C]-15.7672277176349[/C][/ROW]
[ROW][C]44[/C][C]344[/C][C]374.997120370500[/C][C]-30.9971203704996[/C][/ROW]
[ROW][C]45[/C][C]330[/C][C]368.045698044457[/C][C]-38.0456980444573[/C][/ROW]
[ROW][C]46[/C][C]334[/C][C]354.361869015868[/C][C]-20.3618690158678[/C][/ROW]
[ROW][C]47[/C][C]333[/C][C]343.523817161995[/C][C]-10.5238171619951[/C][/ROW]
[ROW][C]48[/C][C]343[/C][C]351.123413307098[/C][C]-8.12341330709804[/C][/ROW]
[ROW][C]49[/C][C]350[/C][C]362.339780744690[/C][C]-12.3397807446904[/C][/ROW]
[ROW][C]50[/C][C]341[/C][C]357.042989310407[/C][C]-16.0429893104070[/C][/ROW]
[ROW][C]51[/C][C]320[/C][C]345.639294728032[/C][C]-25.6392947280315[/C][/ROW]
[ROW][C]52[/C][C]302[/C][C]330.396945448516[/C][C]-28.3969454485156[/C][/ROW]
[ROW][C]53[/C][C]287[/C][C]319.437382677118[/C][C]-32.4373826771176[/C][/ROW]
[ROW][C]54[/C][C]304[/C][C]317.014229253815[/C][C]-13.0142292538149[/C][/ROW]
[ROW][C]55[/C][C]370[/C][C]355.319603934389[/C][C]14.6803960656112[/C][/ROW]
[ROW][C]56[/C][C]385[/C][C]362.71958324639[/C][C]22.2804167536101[/C][/ROW]
[ROW][C]57[/C][C]365[/C][C]355.536570339247[/C][C]9.46342966075253[/C][/ROW]
[ROW][C]58[/C][C]333[/C][C]342.055171763846[/C][C]-9.05517176384593[/C][/ROW]
[ROW][C]59[/C][C]313[/C][C]331.513707993579[/C][C]-18.5137079935792[/C][/ROW]
[ROW][C]60[/C][C]330[/C][C]338.859625112864[/C][C]-8.85962511286389[/C][/ROW]
[ROW][C]61[/C][C]367[/C][C]350.310372361183[/C][C]16.6896276388172[/C][/ROW]
[/TABLE]
Source: https://freestatistics.org/blog/index.php?pk=71323&T=4

Globally Unique Identifier (entire table): ba.freestatistics.org/blog/index.php?pk=71323&T=4

As an alternative you can also use a QR Code:  

The GUIDs for individual cells are displayed in the table below:

Multiple Linear Regression - Actuals, Interpolation, and Residuals
Time or IndexActualsInterpolationForecastResidualsPrediction Error
1401412.32228193731-11.3222819373099
2394406.972974098748-12.9729740987476
3372395.387641502217-23.3876415022173
4334380.640535438587-46.6405354385868
5320369.475274025752-49.4752740257518
6334366.903333515005-32.9033335150051
7400405.455118319947-5.45511831994658
8427412.64663793492114.3533620650791
9423405.74097024436617.2590297556339
10395392.0665795180482.93342048195222
11373381.265125737758-8.26512573775767
12377388.574951916119-11.5749519161191
13391400.009696311632-9.009696311632
14398394.5951937523083.40480624769224
15393383.0130729959539.98692700404674
16375368.0534219999856.94657800001536
17371356.86815702114214.1318429788578
18364354.4266622999939.57333770000674
19400393.0020287735946.99797122640577
20406400.0794435402165.92055645978371
21407393.01138070252513.9886192974749
22397379.56545323924117.4345467607591
23389368.62126978938220.3787302106177
24394375.88094618254218.1190538174581
25399387.2834594801511.7165405198501
26401381.98559743247519.0144025675254
27396370.27024165689625.729758343104
28392355.69730748771336.3026925122867
29384344.27681747704539.7231825229545
30370342.10779386414727.8922061358529
31380380.456021254435-0.456021254435470
32376387.557214907973-11.5572149079734
33378380.665380669404-2.66538066940401
34376366.9509264629989.04907353700247
35373356.07607931728616.9239206827142
36374363.56106348137710.4389365186229
37379374.7344091650354.2655908349649
38376369.4032454060636.59675459393705
39371357.68974911690213.3102508830981
40375343.211789625231.7882103748004
41360331.94236879894328.0576312010572
42338329.5479810670408.45201893296043
43352367.767227717635-15.7672277176349
44344374.997120370500-30.9971203704996
45330368.045698044457-38.0456980444573
46334354.361869015868-20.3618690158678
47333343.523817161995-10.5238171619951
48343351.123413307098-8.12341330709804
49350362.339780744690-12.3397807446904
50341357.042989310407-16.0429893104070
51320345.639294728032-25.6392947280315
52302330.396945448516-28.3969454485156
53287319.437382677118-32.4373826771176
54304317.014229253815-13.0142292538149
55370355.31960393438914.6803960656112
56385362.7195832463922.2804167536101
57365355.5365703392479.46342966075253
58333342.055171763846-9.05517176384593
59313331.513707993579-18.5137079935792
60330338.859625112864-8.85962511286389
61367350.31037236118316.6896276388172


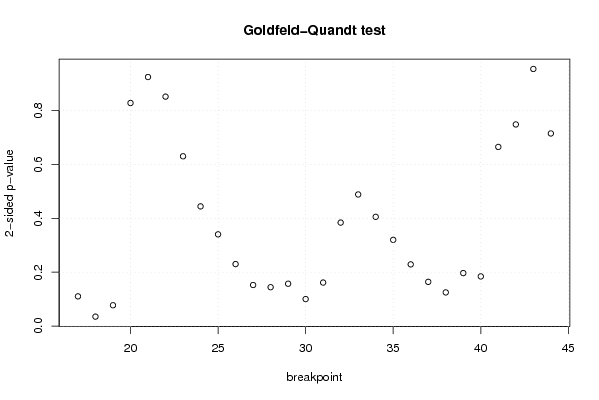
Goldfeld-Quandt test for Heteroskedasticity
p-valuesAlternative Hypothesis
breakpoint indexgreater2-sidedless
170.05514875055327610.1102975011065520.944851249446724
180.01747353856478040.03494707712956080.98252646143522
190.03861143333431260.07722286666862520.961388566665687
200.4139739515377760.8279479030755510.586026048462224
210.5377932916316770.9244134167366460.462206708368323
220.4257689433520350.851537886704070.574231056647965
230.3150647012868970.6301294025737940.684935298713103
240.2221064407585860.4442128815171710.777893559241414
250.1702017986527010.3404035973054020.829798201347299
260.1150387196724430.2300774393448870.884961280327557
270.07618377121625950.1523675424325190.92381622878374
280.07211650992178120.1442330198435620.927883490078219
290.0785607863960990.1571215727921980.9214392136039
300.05008300771044350.1001660154208870.949916992289557
310.08072438046944650.1614487609388930.919275619530553
320.1920502224445250.3841004448890510.807949777555475
330.2442157123948090.4884314247896180.755784287605191
340.2027217940588480.4054435881176970.797278205941152
350.1600285351245980.3200570702491960.839971464875402
360.1144845046447820.2289690092895630.885515495355218
370.08205865573011550.1641173114602310.917941344269884
380.0624606890600490.1249213781200980.937539310939951
390.0983106018942880.1966212037885760.901689398105712
400.09215900164779140.1843180032955830.907840998352209
410.3324383961134810.6648767922269620.667561603886519
420.6258226557043490.7483546885913030.374177344295651
430.5228397685328240.9543204629343520.477160231467176
440.6425351878186520.7149296243626960.357464812181348

\begin{tabular}{lllllllll}
\hline
Goldfeld-Quandt test for Heteroskedasticity \tabularnewline
p-values & Alternative Hypothesis \tabularnewline
breakpoint index & greater & 2-sided & less \tabularnewline
17 & 0.0551487505532761 & 0.110297501106552 & 0.944851249446724 \tabularnewline
18 & 0.0174735385647804 & 0.0349470771295608 & 0.98252646143522 \tabularnewline
19 & 0.0386114333343126 & 0.0772228666686252 & 0.961388566665687 \tabularnewline
20 & 0.413973951537776 & 0.827947903075551 & 0.586026048462224 \tabularnewline
21 & 0.537793291631677 & 0.924413416736646 & 0.462206708368323 \tabularnewline
22 & 0.425768943352035 & 0.85153788670407 & 0.574231056647965 \tabularnewline
23 & 0.315064701286897 & 0.630129402573794 & 0.684935298713103 \tabularnewline
24 & 0.222106440758586 & 0.444212881517171 & 0.777893559241414 \tabularnewline
25 & 0.170201798652701 & 0.340403597305402 & 0.829798201347299 \tabularnewline
26 & 0.115038719672443 & 0.230077439344887 & 0.884961280327557 \tabularnewline
27 & 0.0761837712162595 & 0.152367542432519 & 0.92381622878374 \tabularnewline
28 & 0.0721165099217812 & 0.144233019843562 & 0.927883490078219 \tabularnewline
29 & 0.078560786396099 & 0.157121572792198 & 0.9214392136039 \tabularnewline
30 & 0.0500830077104435 & 0.100166015420887 & 0.949916992289557 \tabularnewline
31 & 0.0807243804694465 & 0.161448760938893 & 0.919275619530553 \tabularnewline
32 & 0.192050222444525 & 0.384100444889051 & 0.807949777555475 \tabularnewline
33 & 0.244215712394809 & 0.488431424789618 & 0.755784287605191 \tabularnewline
34 & 0.202721794058848 & 0.405443588117697 & 0.797278205941152 \tabularnewline
35 & 0.160028535124598 & 0.320057070249196 & 0.839971464875402 \tabularnewline
36 & 0.114484504644782 & 0.228969009289563 & 0.885515495355218 \tabularnewline
37 & 0.0820586557301155 & 0.164117311460231 & 0.917941344269884 \tabularnewline
38 & 0.062460689060049 & 0.124921378120098 & 0.937539310939951 \tabularnewline
39 & 0.098310601894288 & 0.196621203788576 & 0.901689398105712 \tabularnewline
40 & 0.0921590016477914 & 0.184318003295583 & 0.907840998352209 \tabularnewline
41 & 0.332438396113481 & 0.664876792226962 & 0.667561603886519 \tabularnewline
42 & 0.625822655704349 & 0.748354688591303 & 0.374177344295651 \tabularnewline
43 & 0.522839768532824 & 0.954320462934352 & 0.477160231467176 \tabularnewline
44 & 0.642535187818652 & 0.714929624362696 & 0.357464812181348 \tabularnewline
\hline
\end{tabular}
%Source: https://freestatistics.org/blog/index.php?pk=71323&T=5

[TABLE]
[ROW][C]Goldfeld-Quandt test for Heteroskedasticity[/C][/ROW]
[ROW][C]p-values[/C][C]Alternative Hypothesis[/C][/ROW]
[ROW][C]breakpoint index[/C][C]greater[/C][C]2-sided[/C][C]less[/C][/ROW]
[ROW][C]17[/C][C]0.0551487505532761[/C][C]0.110297501106552[/C][C]0.944851249446724[/C][/ROW]
[ROW][C]18[/C][C]0.0174735385647804[/C][C]0.0349470771295608[/C][C]0.98252646143522[/C][/ROW]
[ROW][C]19[/C][C]0.0386114333343126[/C][C]0.0772228666686252[/C][C]0.961388566665687[/C][/ROW]
[ROW][C]20[/C][C]0.413973951537776[/C][C]0.827947903075551[/C][C]0.586026048462224[/C][/ROW]
[ROW][C]21[/C][C]0.537793291631677[/C][C]0.924413416736646[/C][C]0.462206708368323[/C][/ROW]
[ROW][C]22[/C][C]0.425768943352035[/C][C]0.85153788670407[/C][C]0.574231056647965[/C][/ROW]
[ROW][C]23[/C][C]0.315064701286897[/C][C]0.630129402573794[/C][C]0.684935298713103[/C][/ROW]
[ROW][C]24[/C][C]0.222106440758586[/C][C]0.444212881517171[/C][C]0.777893559241414[/C][/ROW]
[ROW][C]25[/C][C]0.170201798652701[/C][C]0.340403597305402[/C][C]0.829798201347299[/C][/ROW]
[ROW][C]26[/C][C]0.115038719672443[/C][C]0.230077439344887[/C][C]0.884961280327557[/C][/ROW]
[ROW][C]27[/C][C]0.0761837712162595[/C][C]0.152367542432519[/C][C]0.92381622878374[/C][/ROW]
[ROW][C]28[/C][C]0.0721165099217812[/C][C]0.144233019843562[/C][C]0.927883490078219[/C][/ROW]
[ROW][C]29[/C][C]0.078560786396099[/C][C]0.157121572792198[/C][C]0.9214392136039[/C][/ROW]
[ROW][C]30[/C][C]0.0500830077104435[/C][C]0.100166015420887[/C][C]0.949916992289557[/C][/ROW]
[ROW][C]31[/C][C]0.0807243804694465[/C][C]0.161448760938893[/C][C]0.919275619530553[/C][/ROW]
[ROW][C]32[/C][C]0.192050222444525[/C][C]0.384100444889051[/C][C]0.807949777555475[/C][/ROW]
[ROW][C]33[/C][C]0.244215712394809[/C][C]0.488431424789618[/C][C]0.755784287605191[/C][/ROW]
[ROW][C]34[/C][C]0.202721794058848[/C][C]0.405443588117697[/C][C]0.797278205941152[/C][/ROW]
[ROW][C]35[/C][C]0.160028535124598[/C][C]0.320057070249196[/C][C]0.839971464875402[/C][/ROW]
[ROW][C]36[/C][C]0.114484504644782[/C][C]0.228969009289563[/C][C]0.885515495355218[/C][/ROW]
[ROW][C]37[/C][C]0.0820586557301155[/C][C]0.164117311460231[/C][C]0.917941344269884[/C][/ROW]
[ROW][C]38[/C][C]0.062460689060049[/C][C]0.124921378120098[/C][C]0.937539310939951[/C][/ROW]
[ROW][C]39[/C][C]0.098310601894288[/C][C]0.196621203788576[/C][C]0.901689398105712[/C][/ROW]
[ROW][C]40[/C][C]0.0921590016477914[/C][C]0.184318003295583[/C][C]0.907840998352209[/C][/ROW]
[ROW][C]41[/C][C]0.332438396113481[/C][C]0.664876792226962[/C][C]0.667561603886519[/C][/ROW]
[ROW][C]42[/C][C]0.625822655704349[/C][C]0.748354688591303[/C][C]0.374177344295651[/C][/ROW]
[ROW][C]43[/C][C]0.522839768532824[/C][C]0.954320462934352[/C][C]0.477160231467176[/C][/ROW]
[ROW][C]44[/C][C]0.642535187818652[/C][C]0.714929624362696[/C][C]0.357464812181348[/C][/ROW]
[/TABLE]
Source: https://freestatistics.org/blog/index.php?pk=71323&T=5

Globally Unique Identifier (entire table): ba.freestatistics.org/blog/index.php?pk=71323&T=5

As an alternative you can also use a QR Code:  

The GUIDs for individual cells are displayed in the table below:

Goldfeld-Quandt test for Heteroskedasticity
p-valuesAlternative Hypothesis
breakpoint indexgreater2-sidedless
170.05514875055327610.1102975011065520.944851249446724
180.01747353856478040.03494707712956080.98252646143522
190.03861143333431260.07722286666862520.961388566665687
200.4139739515377760.8279479030755510.586026048462224
210.5377932916316770.9244134167366460.462206708368323
220.4257689433520350.851537886704070.574231056647965
230.3150647012868970.6301294025737940.684935298713103
240.2221064407585860.4442128815171710.777893559241414
250.1702017986527010.3404035973054020.829798201347299
260.1150387196724430.2300774393448870.884961280327557
270.07618377121625950.1523675424325190.92381622878374
280.07211650992178120.1442330198435620.927883490078219
290.0785607863960990.1571215727921980.9214392136039
300.05008300771044350.1001660154208870.949916992289557
310.08072438046944650.1614487609388930.919275619530553
320.1920502224445250.3841004448890510.807949777555475
330.2442157123948090.4884314247896180.755784287605191
340.2027217940588480.4054435881176970.797278205941152
350.1600285351245980.3200570702491960.839971464875402
360.1144845046447820.2289690092895630.885515495355218
370.08205865573011550.1641173114602310.917941344269884
380.0624606890600490.1249213781200980.937539310939951
390.0983106018942880.1966212037885760.901689398105712
400.09215900164779140.1843180032955830.907840998352209
410.3324383961134810.6648767922269620.667561603886519
420.6258226557043490.7483546885913030.374177344295651
430.5228397685328240.9543204629343520.477160231467176
440.6425351878186520.7149296243626960.357464812181348


Meta Analysis of Goldfeld-Quandt test for Heteroskedasticity
Description# significant tests% significant testsOK/NOK
1% type I error level00OK
5% type I error level10.0357142857142857OK
10% type I error level20.0714285714285714OK

\begin{tabular}{lllllllll}
\hline
Meta Analysis of Goldfeld-Quandt test for Heteroskedasticity \tabularnewline
Description & # significant tests & % significant tests & OK/NOK \tabularnewline
1% type I error level & 0 & 0 & OK \tabularnewline
5% type I error level & 1 & 0.0357142857142857 & OK \tabularnewline
10% type I error level & 2 & 0.0714285714285714 & OK \tabularnewline
\hline
\end{tabular}
%Source: https://freestatistics.org/blog/index.php?pk=71323&T=6

[TABLE]
[ROW][C]Meta Analysis of Goldfeld-Quandt test for Heteroskedasticity[/C][/ROW]
[ROW][C]Description[/C][C]# significant tests[/C][C]% significant tests[/C][C]OK/NOK[/C][/ROW]
[ROW][C]1% type I error level[/C][C]0[/C][C]0[/C][C]OK[/C][/ROW]
[ROW][C]5% type I error level[/C][C]1[/C][C]0.0357142857142857[/C][C]OK[/C][/ROW]
[ROW][C]10% type I error level[/C][C]2[/C][C]0.0714285714285714[/C][C]OK[/C][/ROW]
[/TABLE]
Source: https://freestatistics.org/blog/index.php?pk=71323&T=6

Globally Unique Identifier (entire table): ba.freestatistics.org/blog/index.php?pk=71323&T=6

As an alternative you can also use a QR Code:  

The GUIDs for individual cells are displayed in the table below:

Meta Analysis of Goldfeld-Quandt test for Heteroskedasticity
Description# significant tests% significant testsOK/NOK
1% type I error level00OK
5% type I error level10.0357142857142857OK
10% type I error level20.0714285714285714OK


Parameters (Session):
par1 = 2 ; par2 = Include Monthly Dummies ; par3 = Linear Trend ;
Parameters (R input):
par1 = 2 ; par2 = Include Monthly Dummies ; par3 = Linear Trend ;
R code (references can be found in the software module):
library(lattice)
library(lmtest)
n25 <- 25 #minimum number of obs. for Goldfeld-Quandt test
par1 <- as.numeric(par1)
x <- t(y)
k <- length(x[1,])
n <- length(x[,1])
x1 <- cbind(x[,par1], x[,1:k!=par1])
mycolnames <- c(colnames(x)[par1], colnames(x)[1:k!=par1])
colnames(x1) <- mycolnames #colnames(x)[par1]
x <- x1
if (par3 == 'First Differences'){
x2 <- array(0, dim=c(n-1,k), dimnames=list(1:(n-1), paste('(1-B)',colnames(x),sep='')))
for (i in 1:n-1) {
for (j in 1:k) {
x2[i,j] <- x[i+1,j] - x[i,j]
}
}
x <- x2
}
if (par2 == 'Include Monthly Dummies'){
x2 <- array(0, dim=c(n,11), dimnames=list(1:n, paste('M', seq(1:11), sep ='')))
for (i in 1:11){
x2[seq(i,n,12),i] <- 1
}
x <- cbind(x, x2)
}
if (par2 == 'Include Quarterly Dummies'){
x2 <- array(0, dim=c(n,3), dimnames=list(1:n, paste('Q', seq(1:3), sep ='')))
for (i in 1:3){
x2[seq(i,n,4),i] <- 1
}
x <- cbind(x, x2)
}
k <- length(x[1,])
if (par3 == 'Linear Trend'){
x <- cbind(x, c(1:n))
colnames(x)[k+1] <- 't'
}
x
k <- length(x[1,])
df <- as.data.frame(x)
(mylm <- lm(df))
(mysum <- summary(mylm))
if (n > n25) {
kp3 <- k + 3
nmkm3 <- n - k - 3
gqarr <- array(NA, dim=c(nmkm3-kp3+1,3))
numgqtests <- 0
numsignificant1 <- 0
numsignificant5 <- 0
numsignificant10 <- 0
for (mypoint in kp3:nmkm3) {
j <- 0
numgqtests <- numgqtests + 1
for (myalt in c('greater', 'two.sided', 'less')) {
j <- j + 1
gqarr[mypoint-kp3+1,j] <- gqtest(mylm, point=mypoint, alternative=myalt)$p.value
}
if (gqarr[mypoint-kp3+1,2] < 0.01) numsignificant1 <- numsignificant1 + 1
if (gqarr[mypoint-kp3+1,2] < 0.05) numsignificant5 <- numsignificant5 + 1
if (gqarr[mypoint-kp3+1,2] < 0.10) numsignificant10 <- numsignificant10 + 1
}
gqarr
}
bitmap(file='test0.png')
plot(x[,1], type='l', main='Actuals and Interpolation', ylab='value of Actuals and Interpolation (dots)', xlab='time or index')
points(x[,1]-mysum$resid)
grid()
dev.off()
bitmap(file='test1.png')
plot(mysum$resid, type='b', pch=19, main='Residuals', ylab='value of Residuals', xlab='time or index')
grid()
dev.off()
bitmap(file='test2.png')
hist(mysum$resid, main='Residual Histogram', xlab='values of Residuals')
grid()
dev.off()
bitmap(file='test3.png')
densityplot(~mysum$resid,col='black',main='Residual Density Plot', xlab='values of Residuals')
dev.off()
bitmap(file='test4.png')
qqnorm(mysum$resid, main='Residual Normal Q-Q Plot')
qqline(mysum$resid)
grid()
dev.off()
(myerror <- as.ts(mysum$resid))
bitmap(file='test5.png')
dum <- cbind(lag(myerror,k=1),myerror)
dum
dum1 <- dum[2:length(myerror),]
dum1
z <- as.data.frame(dum1)
z
plot(z,main=paste('Residual Lag plot, lowess, and regression line'), ylab='values of Residuals', xlab='lagged values of Residuals')
lines(lowess(z))
abline(lm(z))
grid()
dev.off()
bitmap(file='test6.png')
acf(mysum$resid, lag.max=length(mysum$resid)/2, main='Residual Autocorrelation Function')
grid()
dev.off()
bitmap(file='test7.png')
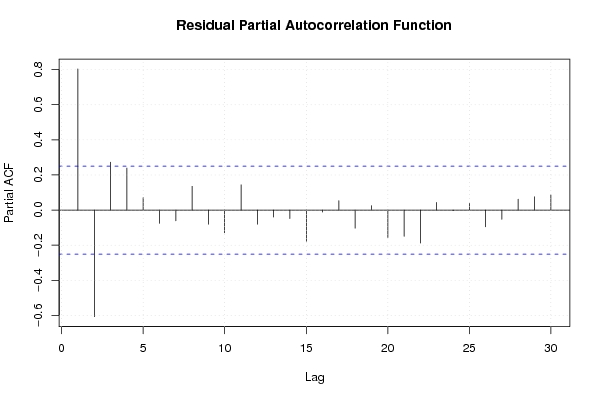
pacf(mysum$resid, lag.max=length(mysum$resid)/2, main='Residual Partial Autocorrelation Function')
grid()
dev.off()
bitmap(file='test8.png')
opar <- par(mfrow = c(2,2), oma = c(0, 0, 1.1, 0))
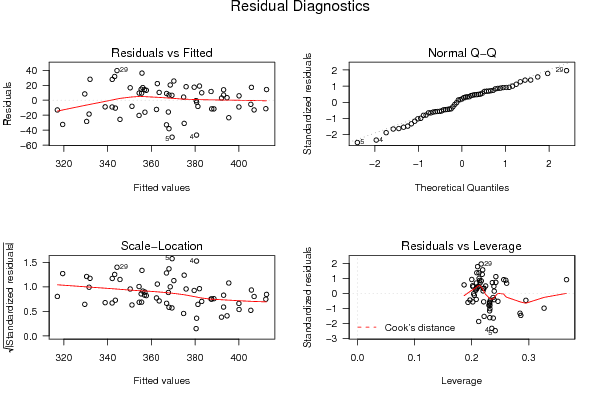
plot(mylm, las = 1, sub='Residual Diagnostics')
par(opar)
dev.off()
if (n > n25) {
bitmap(file='test9.png')
plot(kp3:nmkm3,gqarr[,2], main='Goldfeld-Quandt test',ylab='2-sided p-value',xlab='breakpoint')
grid()
dev.off()
}
load(file='createtable')
a<-table.start()
a<-table.row.start(a)
a<-table.element(a, 'Multiple Linear Regression - Estimated Regression Equation', 1, TRUE)
a<-table.row.end(a)
myeq <- colnames(x)[1]
myeq <- paste(myeq, '[t] = ', sep='')
for (i in 1:k){
if (mysum$coefficients[i,1] > 0) myeq <- paste(myeq, '+', '')
myeq <- paste(myeq, mysum$coefficients[i,1], sep=' ')
if (rownames(mysum$coefficients)[i] != '(Intercept)') {
myeq <- paste(myeq, rownames(mysum$coefficients)[i], sep='')
if (rownames(mysum$coefficients)[i] != 't') myeq <- paste(myeq, '[t]', sep='')
}
}
myeq <- paste(myeq, ' + e[t]')
a<-table.row.start(a)
a<-table.element(a, myeq)
a<-table.row.end(a)
a<-table.end(a)
table.save(a,file='mytable1.tab')
a<-table.start()
a<-table.row.start(a)
a<-table.element(a,hyperlink('ols1.htm','Multiple Linear Regression - Ordinary Least Squares',''), 6, TRUE)
a<-table.row.end(a)
a<-table.row.start(a)
a<-table.element(a,'Variable',header=TRUE)
a<-table.element(a,'Parameter',header=TRUE)
a<-table.element(a,'S.D.',header=TRUE)
a<-table.element(a,'T-STAT
H0: parameter = 0',header=TRUE)
a<-table.element(a,'2-tail p-value',header=TRUE)
a<-table.element(a,'1-tail p-value',header=TRUE)
a<-table.row.end(a)
for (i in 1:k){
a<-table.row.start(a)
a<-table.element(a,rownames(mysum$coefficients)[i],header=TRUE)
a<-table.element(a,mysum$coefficients[i,1])
a<-table.element(a, round(mysum$coefficients[i,2],6))
a<-table.element(a, round(mysum$coefficients[i,3],4))
a<-table.element(a, round(mysum$coefficients[i,4],6))
a<-table.element(a, round(mysum$coefficients[i,4]/2,6))
a<-table.row.end(a)
}
a<-table.end(a)
table.save(a,file='mytable2.tab')
a<-table.start()
a<-table.row.start(a)
a<-table.element(a, 'Multiple Linear Regression - Regression Statistics', 2, TRUE)
a<-table.row.end(a)
a<-table.row.start(a)
a<-table.element(a, 'Multiple R',1,TRUE)
a<-table.element(a, sqrt(mysum$r.squared))
a<-table.row.end(a)
a<-table.row.start(a)
a<-table.element(a, 'R-squared',1,TRUE)
a<-table.element(a, mysum$r.squared)
a<-table.row.end(a)
a<-table.row.start(a)
a<-table.element(a, 'Adjusted R-squared',1,TRUE)
a<-table.element(a, mysum$adj.r.squared)
a<-table.row.end(a)
a<-table.row.start(a)
a<-table.element(a, 'F-TEST (value)',1,TRUE)
a<-table.element(a, mysum$fstatistic[1])
a<-table.row.end(a)
a<-table.row.start(a)
a<-table.element(a, 'F-TEST (DF numerator)',1,TRUE)
a<-table.element(a, mysum$fstatistic[2])
a<-table.row.end(a)
a<-table.row.start(a)
a<-table.element(a, 'F-TEST (DF denominator)',1,TRUE)
a<-table.element(a, mysum$fstatistic[3])
a<-table.row.end(a)
a<-table.row.start(a)
a<-table.element(a, 'p-value',1,TRUE)
a<-table.element(a, 1-pf(mysum$fstatistic[1],mysum$fstatistic[2],mysum$fstatistic[3]))
a<-table.row.end(a)
a<-table.row.start(a)
a<-table.element(a, 'Multiple Linear Regression - Residual Statistics', 2, TRUE)
a<-table.row.end(a)
a<-table.row.start(a)
a<-table.element(a, 'Residual Standard Deviation',1,TRUE)
a<-table.element(a, mysum$sigma)
a<-table.row.end(a)
a<-table.row.start(a)
a<-table.element(a, 'Sum Squared Residuals',1,TRUE)
a<-table.element(a, sum(myerror*myerror))
a<-table.row.end(a)
a<-table.end(a)
table.save(a,file='mytable3.tab')
a<-table.start()
a<-table.row.start(a)
a<-table.element(a, 'Multiple Linear Regression - Actuals, Interpolation, and Residuals', 4, TRUE)
a<-table.row.end(a)
a<-table.row.start(a)
a<-table.element(a, 'Time or Index', 1, TRUE)
a<-table.element(a, 'Actuals', 1, TRUE)
a<-table.element(a, 'Interpolation
Forecast', 1, TRUE)
a<-table.element(a, 'Residuals
Prediction Error', 1, TRUE)
a<-table.row.end(a)
for (i in 1:n) {
a<-table.row.start(a)
a<-table.element(a,i, 1, TRUE)
a<-table.element(a,x[i])
a<-table.element(a,x[i]-mysum$resid[i])
a<-table.element(a,mysum$resid[i])
a<-table.row.end(a)
}
a<-table.end(a)
table.save(a,file='mytable4.tab')
if (n > n25) {
a<-table.start()
a<-table.row.start(a)
a<-table.element(a,'Goldfeld-Quandt test for Heteroskedasticity',4,TRUE)
a<-table.row.end(a)
a<-table.row.start(a)
a<-table.element(a,'p-values',header=TRUE)
a<-table.element(a,'Alternative Hypothesis',3,header=TRUE)
a<-table.row.end(a)
a<-table.row.start(a)
a<-table.element(a,'breakpoint index',header=TRUE)
a<-table.element(a,'greater',header=TRUE)
a<-table.element(a,'2-sided',header=TRUE)
a<-table.element(a,'less',header=TRUE)
a<-table.row.end(a)
for (mypoint in kp3:nmkm3) {
a<-table.row.start(a)
a<-table.element(a,mypoint,header=TRUE)
a<-table.element(a,gqarr[mypoint-kp3+1,1])
a<-table.element(a,gqarr[mypoint-kp3+1,2])
a<-table.element(a,gqarr[mypoint-kp3+1,3])
a<-table.row.end(a)
}
a<-table.end(a)
table.save(a,file='mytable5.tab')
a<-table.start()
a<-table.row.start(a)
a<-table.element(a,'Meta Analysis of Goldfeld-Quandt test for Heteroskedasticity',4,TRUE)
a<-table.row.end(a)
a<-table.row.start(a)
a<-table.element(a,'Description',header=TRUE)
a<-table.element(a,'# significant tests',header=TRUE)
a<-table.element(a,'% significant tests',header=TRUE)
a<-table.element(a,'OK/NOK',header=TRUE)
a<-table.row.end(a)
a<-table.row.start(a)
a<-table.element(a,'1% type I error level',header=TRUE)
a<-table.element(a,numsignificant1)
a<-table.element(a,numsignificant1/numgqtests)
if (numsignificant1/numgqtests < 0.01) dum <- 'OK' else dum <- 'NOK'
a<-table.element(a,dum)
a<-table.row.end(a)
a<-table.row.start(a)
a<-table.element(a,'5% type I error level',header=TRUE)
a<-table.element(a,numsignificant5)
a<-table.element(a,numsignificant5/numgqtests)
if (numsignificant5/numgqtests < 0.05) dum <- 'OK' else dum <- 'NOK'
a<-table.element(a,dum)
a<-table.row.end(a)
a<-table.row.start(a)
a<-table.element(a,'10% type I error level',header=TRUE)
a<-table.element(a,numsignificant10)
a<-table.element(a,numsignificant10/numgqtests)
if (numsignificant10/numgqtests < 0.1) dum <- 'OK' else dum <- 'NOK'
a<-table.element(a,dum)
a<-table.row.end(a)
a<-table.end(a)
table.save(a,file='mytable6.tab')
}