Free Statistics

of Irreproducible Research!

Author's title

Author*The author of this computation has been verified*
R Software Modulerwasp_autocorrelation.wasp
Title produced by software(Partial) Autocorrelation Function
Date of computationWed, 30 Dec 2009 07:41:38 -0700
Cite this page as followsStatistical Computations at FreeStatistics.org, Office for Research Development and Education, URL https://freestatistics.org/blog/index.php?v=date/2009/Dec/30/t12621854544sz5j06vtdm5yft.htm/, Retrieved Sun, 28 Apr 2024 22:46:02 +0000
Statistical Computations at FreeStatistics.org, Office for Research Development and Education, URL https://freestatistics.org/blog/index.php?pk=71305, Retrieved Sun, 28 Apr 2024 22:46:02 +0000
QR Codes:

Original text written by user:
IsPrivate?No (this computation is public)
User-defined keywords
Estimated Impact128
Family? (F = Feedback message, R = changed R code, M = changed R Module, P = changed Parameters, D = changed Data)
-     [(Partial) Autocorrelation Function] [] [2009-12-27 10:35:52] [d2d412c7f4d35ffbf5ee5ee89db327d4]
-   P     [(Partial) Autocorrelation Function] [] [2009-12-30 14:41:38] [f6a332ba2d530c028d935c5a5bbb53af] [Current]
-           [(Partial) Autocorrelation Function] [] [2009-12-30 15:05:16] [d2d412c7f4d35ffbf5ee5ee89db327d4]
Feedback Forum

Post a new message
Dataseries X:
28029
29383
36438
32034
22679
24319
18004
17537
20366
22782
19169
13807
29743
25591
29096
26482
22405
27044
17970
18730
19684
19785
18479
10698
31956
29506
34506
27165
26736
23691
18157
17328
18205
20995
17382
9367
31124
26551
30651
25859
25100
25778
20418
18688
20424
24776
19814
12738
31566
30111
30019
31934
25826
26835
20205
17789
20520
22518
15572
11509
25447
24090
27786
26195
20516
22759
19028
16971
20036
22485


Summary of computational transaction
Raw Inputview raw input (R code)
Raw Outputview raw output of R engine
Computing time4 seconds
R Server'Gwilym Jenkins' @ 72.249.127.135

\begin{tabular}{lllllllll}
\hline
Summary of computational transaction \tabularnewline
Raw Input & view raw input (R code)  \tabularnewline
Raw Output & view raw output of R engine  \tabularnewline
Computing time & 4 seconds \tabularnewline
R Server & 'Gwilym Jenkins' @ 72.249.127.135 \tabularnewline
\hline
\end{tabular}
%Source: https://freestatistics.org/blog/index.php?pk=71305&T=0

[TABLE]
[ROW][C]Summary of computational transaction[/C][/ROW]
[ROW][C]Raw Input[/C][C]view raw input (R code) [/C][/ROW]
[ROW][C]Raw Output[/C][C]view raw output of R engine [/C][/ROW]
[ROW][C]Computing time[/C][C]4 seconds[/C][/ROW]
[ROW][C]R Server[/C][C]'Gwilym Jenkins' @ 72.249.127.135[/C][/ROW]
[/TABLE]
Source: https://freestatistics.org/blog/index.php?pk=71305&T=0

Globally Unique Identifier (entire table): ba.freestatistics.org/blog/index.php?pk=71305&T=0

As an alternative you can also use a QR Code:  

The GUIDs for individual cells are displayed in the table below:

Summary of computational transaction
Raw Inputview raw input (R code)
Raw Outputview raw output of R engine
Computing time4 seconds
R Server'Gwilym Jenkins' @ 72.249.127.135


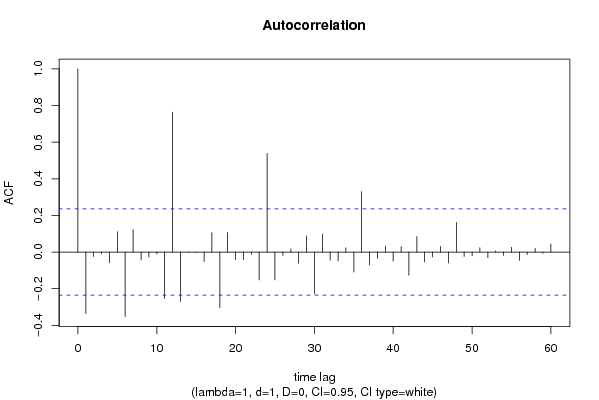
Autocorrelation Function
Time lag kACF(k)T-STATP-value
1-0.335149-2.7840.003462
2-0.024948-0.20720.418219
3-0.009152-0.0760.469811
4-0.058923-0.48950.313038
50.1112650.92420.179292
6-0.352902-2.93140.002287
70.1229241.02110.155391
8-0.043751-0.36340.3587
9-0.027294-0.22670.410656
10-0.010908-0.09060.464033
11-0.254189-2.11150.019179
120.7640586.34670
13-0.270072-2.24340.014043
140.0011010.00910.496363
15-0.001894-0.01570.493746
16-0.051944-0.43150.333733
170.1054190.87570.192123
18-0.303498-2.5210.007008
190.106190.88210.190399
20-0.041974-0.34870.364202
21-0.041851-0.34760.364585
22-0.013493-0.11210.455542
23-0.152205-1.26430.105187
240.5386994.47481.5e-05
25-0.152615-1.26770.104581
26-0.017893-0.14860.441141
270.0168990.14040.444388
28-0.060755-0.50470.307699
290.0877290.72870.234315
30-0.229058-1.90270.030627
310.0987350.82020.207476
32-0.044419-0.3690.356638
33-0.049412-0.41040.341375
340.0230870.19180.42424
35-0.109246-0.90750.18366
360.3302462.74320.003873
37-0.07036-0.58450.280411
38-0.035698-0.29650.383859
390.0330360.27440.392291
40-0.04973-0.41310.340412
410.0295440.24540.403432
42-0.127119-1.05590.147343
430.0842580.69990.243172
44-0.054368-0.45160.326483
45-0.027451-0.2280.410151
460.0307420.25540.399601
47-0.059519-0.49440.311295
480.16151.34150.092075
49-0.024151-0.20060.420795
50-0.020722-0.17210.431918
510.0236560.19650.422398
52-0.031-0.25750.398777
530.0061550.05110.479686
54-0.01856-0.15420.438961
550.0256160.21280.416062
56-0.045726-0.37980.352621
57-0.014108-0.11720.453525
580.0196090.16290.435544
59-0.007279-0.06050.475981
600.0441640.36690.357426

\begin{tabular}{lllllllll}
\hline
Autocorrelation Function \tabularnewline
Time lag k & ACF(k) & T-STAT & P-value \tabularnewline
1 & -0.335149 & -2.784 & 0.003462 \tabularnewline
2 & -0.024948 & -0.2072 & 0.418219 \tabularnewline
3 & -0.009152 & -0.076 & 0.469811 \tabularnewline
4 & -0.058923 & -0.4895 & 0.313038 \tabularnewline
5 & 0.111265 & 0.9242 & 0.179292 \tabularnewline
6 & -0.352902 & -2.9314 & 0.002287 \tabularnewline
7 & 0.122924 & 1.0211 & 0.155391 \tabularnewline
8 & -0.043751 & -0.3634 & 0.3587 \tabularnewline
9 & -0.027294 & -0.2267 & 0.410656 \tabularnewline
10 & -0.010908 & -0.0906 & 0.464033 \tabularnewline
11 & -0.254189 & -2.1115 & 0.019179 \tabularnewline
12 & 0.764058 & 6.3467 & 0 \tabularnewline
13 & -0.270072 & -2.2434 & 0.014043 \tabularnewline
14 & 0.001101 & 0.0091 & 0.496363 \tabularnewline
15 & -0.001894 & -0.0157 & 0.493746 \tabularnewline
16 & -0.051944 & -0.4315 & 0.333733 \tabularnewline
17 & 0.105419 & 0.8757 & 0.192123 \tabularnewline
18 & -0.303498 & -2.521 & 0.007008 \tabularnewline
19 & 0.10619 & 0.8821 & 0.190399 \tabularnewline
20 & -0.041974 & -0.3487 & 0.364202 \tabularnewline
21 & -0.041851 & -0.3476 & 0.364585 \tabularnewline
22 & -0.013493 & -0.1121 & 0.455542 \tabularnewline
23 & -0.152205 & -1.2643 & 0.105187 \tabularnewline
24 & 0.538699 & 4.4748 & 1.5e-05 \tabularnewline
25 & -0.152615 & -1.2677 & 0.104581 \tabularnewline
26 & -0.017893 & -0.1486 & 0.441141 \tabularnewline
27 & 0.016899 & 0.1404 & 0.444388 \tabularnewline
28 & -0.060755 & -0.5047 & 0.307699 \tabularnewline
29 & 0.087729 & 0.7287 & 0.234315 \tabularnewline
30 & -0.229058 & -1.9027 & 0.030627 \tabularnewline
31 & 0.098735 & 0.8202 & 0.207476 \tabularnewline
32 & -0.044419 & -0.369 & 0.356638 \tabularnewline
33 & -0.049412 & -0.4104 & 0.341375 \tabularnewline
34 & 0.023087 & 0.1918 & 0.42424 \tabularnewline
35 & -0.109246 & -0.9075 & 0.18366 \tabularnewline
36 & 0.330246 & 2.7432 & 0.003873 \tabularnewline
37 & -0.07036 & -0.5845 & 0.280411 \tabularnewline
38 & -0.035698 & -0.2965 & 0.383859 \tabularnewline
39 & 0.033036 & 0.2744 & 0.392291 \tabularnewline
40 & -0.04973 & -0.4131 & 0.340412 \tabularnewline
41 & 0.029544 & 0.2454 & 0.403432 \tabularnewline
42 & -0.127119 & -1.0559 & 0.147343 \tabularnewline
43 & 0.084258 & 0.6999 & 0.243172 \tabularnewline
44 & -0.054368 & -0.4516 & 0.326483 \tabularnewline
45 & -0.027451 & -0.228 & 0.410151 \tabularnewline
46 & 0.030742 & 0.2554 & 0.399601 \tabularnewline
47 & -0.059519 & -0.4944 & 0.311295 \tabularnewline
48 & 0.1615 & 1.3415 & 0.092075 \tabularnewline
49 & -0.024151 & -0.2006 & 0.420795 \tabularnewline
50 & -0.020722 & -0.1721 & 0.431918 \tabularnewline
51 & 0.023656 & 0.1965 & 0.422398 \tabularnewline
52 & -0.031 & -0.2575 & 0.398777 \tabularnewline
53 & 0.006155 & 0.0511 & 0.479686 \tabularnewline
54 & -0.01856 & -0.1542 & 0.438961 \tabularnewline
55 & 0.025616 & 0.2128 & 0.416062 \tabularnewline
56 & -0.045726 & -0.3798 & 0.352621 \tabularnewline
57 & -0.014108 & -0.1172 & 0.453525 \tabularnewline
58 & 0.019609 & 0.1629 & 0.435544 \tabularnewline
59 & -0.007279 & -0.0605 & 0.475981 \tabularnewline
60 & 0.044164 & 0.3669 & 0.357426 \tabularnewline
\hline
\end{tabular}
%Source: https://freestatistics.org/blog/index.php?pk=71305&T=1

[TABLE]
[ROW][C]Autocorrelation Function[/C][/ROW]
[ROW][C]Time lag k[/C][C]ACF(k)[/C][C]T-STAT[/C][C]P-value[/C][/ROW]
[ROW][C]1[/C][C]-0.335149[/C][C]-2.784[/C][C]0.003462[/C][/ROW]
[ROW][C]2[/C][C]-0.024948[/C][C]-0.2072[/C][C]0.418219[/C][/ROW]
[ROW][C]3[/C][C]-0.009152[/C][C]-0.076[/C][C]0.469811[/C][/ROW]
[ROW][C]4[/C][C]-0.058923[/C][C]-0.4895[/C][C]0.313038[/C][/ROW]
[ROW][C]5[/C][C]0.111265[/C][C]0.9242[/C][C]0.179292[/C][/ROW]
[ROW][C]6[/C][C]-0.352902[/C][C]-2.9314[/C][C]0.002287[/C][/ROW]
[ROW][C]7[/C][C]0.122924[/C][C]1.0211[/C][C]0.155391[/C][/ROW]
[ROW][C]8[/C][C]-0.043751[/C][C]-0.3634[/C][C]0.3587[/C][/ROW]
[ROW][C]9[/C][C]-0.027294[/C][C]-0.2267[/C][C]0.410656[/C][/ROW]
[ROW][C]10[/C][C]-0.010908[/C][C]-0.0906[/C][C]0.464033[/C][/ROW]
[ROW][C]11[/C][C]-0.254189[/C][C]-2.1115[/C][C]0.019179[/C][/ROW]
[ROW][C]12[/C][C]0.764058[/C][C]6.3467[/C][C]0[/C][/ROW]
[ROW][C]13[/C][C]-0.270072[/C][C]-2.2434[/C][C]0.014043[/C][/ROW]
[ROW][C]14[/C][C]0.001101[/C][C]0.0091[/C][C]0.496363[/C][/ROW]
[ROW][C]15[/C][C]-0.001894[/C][C]-0.0157[/C][C]0.493746[/C][/ROW]
[ROW][C]16[/C][C]-0.051944[/C][C]-0.4315[/C][C]0.333733[/C][/ROW]
[ROW][C]17[/C][C]0.105419[/C][C]0.8757[/C][C]0.192123[/C][/ROW]
[ROW][C]18[/C][C]-0.303498[/C][C]-2.521[/C][C]0.007008[/C][/ROW]
[ROW][C]19[/C][C]0.10619[/C][C]0.8821[/C][C]0.190399[/C][/ROW]
[ROW][C]20[/C][C]-0.041974[/C][C]-0.3487[/C][C]0.364202[/C][/ROW]
[ROW][C]21[/C][C]-0.041851[/C][C]-0.3476[/C][C]0.364585[/C][/ROW]
[ROW][C]22[/C][C]-0.013493[/C][C]-0.1121[/C][C]0.455542[/C][/ROW]
[ROW][C]23[/C][C]-0.152205[/C][C]-1.2643[/C][C]0.105187[/C][/ROW]
[ROW][C]24[/C][C]0.538699[/C][C]4.4748[/C][C]1.5e-05[/C][/ROW]
[ROW][C]25[/C][C]-0.152615[/C][C]-1.2677[/C][C]0.104581[/C][/ROW]
[ROW][C]26[/C][C]-0.017893[/C][C]-0.1486[/C][C]0.441141[/C][/ROW]
[ROW][C]27[/C][C]0.016899[/C][C]0.1404[/C][C]0.444388[/C][/ROW]
[ROW][C]28[/C][C]-0.060755[/C][C]-0.5047[/C][C]0.307699[/C][/ROW]
[ROW][C]29[/C][C]0.087729[/C][C]0.7287[/C][C]0.234315[/C][/ROW]
[ROW][C]30[/C][C]-0.229058[/C][C]-1.9027[/C][C]0.030627[/C][/ROW]
[ROW][C]31[/C][C]0.098735[/C][C]0.8202[/C][C]0.207476[/C][/ROW]
[ROW][C]32[/C][C]-0.044419[/C][C]-0.369[/C][C]0.356638[/C][/ROW]
[ROW][C]33[/C][C]-0.049412[/C][C]-0.4104[/C][C]0.341375[/C][/ROW]
[ROW][C]34[/C][C]0.023087[/C][C]0.1918[/C][C]0.42424[/C][/ROW]
[ROW][C]35[/C][C]-0.109246[/C][C]-0.9075[/C][C]0.18366[/C][/ROW]
[ROW][C]36[/C][C]0.330246[/C][C]2.7432[/C][C]0.003873[/C][/ROW]
[ROW][C]37[/C][C]-0.07036[/C][C]-0.5845[/C][C]0.280411[/C][/ROW]
[ROW][C]38[/C][C]-0.035698[/C][C]-0.2965[/C][C]0.383859[/C][/ROW]
[ROW][C]39[/C][C]0.033036[/C][C]0.2744[/C][C]0.392291[/C][/ROW]
[ROW][C]40[/C][C]-0.04973[/C][C]-0.4131[/C][C]0.340412[/C][/ROW]
[ROW][C]41[/C][C]0.029544[/C][C]0.2454[/C][C]0.403432[/C][/ROW]
[ROW][C]42[/C][C]-0.127119[/C][C]-1.0559[/C][C]0.147343[/C][/ROW]
[ROW][C]43[/C][C]0.084258[/C][C]0.6999[/C][C]0.243172[/C][/ROW]
[ROW][C]44[/C][C]-0.054368[/C][C]-0.4516[/C][C]0.326483[/C][/ROW]
[ROW][C]45[/C][C]-0.027451[/C][C]-0.228[/C][C]0.410151[/C][/ROW]
[ROW][C]46[/C][C]0.030742[/C][C]0.2554[/C][C]0.399601[/C][/ROW]
[ROW][C]47[/C][C]-0.059519[/C][C]-0.4944[/C][C]0.311295[/C][/ROW]
[ROW][C]48[/C][C]0.1615[/C][C]1.3415[/C][C]0.092075[/C][/ROW]
[ROW][C]49[/C][C]-0.024151[/C][C]-0.2006[/C][C]0.420795[/C][/ROW]
[ROW][C]50[/C][C]-0.020722[/C][C]-0.1721[/C][C]0.431918[/C][/ROW]
[ROW][C]51[/C][C]0.023656[/C][C]0.1965[/C][C]0.422398[/C][/ROW]
[ROW][C]52[/C][C]-0.031[/C][C]-0.2575[/C][C]0.398777[/C][/ROW]
[ROW][C]53[/C][C]0.006155[/C][C]0.0511[/C][C]0.479686[/C][/ROW]
[ROW][C]54[/C][C]-0.01856[/C][C]-0.1542[/C][C]0.438961[/C][/ROW]
[ROW][C]55[/C][C]0.025616[/C][C]0.2128[/C][C]0.416062[/C][/ROW]
[ROW][C]56[/C][C]-0.045726[/C][C]-0.3798[/C][C]0.352621[/C][/ROW]
[ROW][C]57[/C][C]-0.014108[/C][C]-0.1172[/C][C]0.453525[/C][/ROW]
[ROW][C]58[/C][C]0.019609[/C][C]0.1629[/C][C]0.435544[/C][/ROW]
[ROW][C]59[/C][C]-0.007279[/C][C]-0.0605[/C][C]0.475981[/C][/ROW]
[ROW][C]60[/C][C]0.044164[/C][C]0.3669[/C][C]0.357426[/C][/ROW]
[/TABLE]
Source: https://freestatistics.org/blog/index.php?pk=71305&T=1

Globally Unique Identifier (entire table): ba.freestatistics.org/blog/index.php?pk=71305&T=1

As an alternative you can also use a QR Code:  

The GUIDs for individual cells are displayed in the table below:

Autocorrelation Function
Time lag kACF(k)T-STATP-value
1-0.335149-2.7840.003462
2-0.024948-0.20720.418219
3-0.009152-0.0760.469811
4-0.058923-0.48950.313038
50.1112650.92420.179292
6-0.352902-2.93140.002287
70.1229241.02110.155391
8-0.043751-0.36340.3587
9-0.027294-0.22670.410656
10-0.010908-0.09060.464033
11-0.254189-2.11150.019179
120.7640586.34670
13-0.270072-2.24340.014043
140.0011010.00910.496363
15-0.001894-0.01570.493746
16-0.051944-0.43150.333733
170.1054190.87570.192123
18-0.303498-2.5210.007008
190.106190.88210.190399
20-0.041974-0.34870.364202
21-0.041851-0.34760.364585
22-0.013493-0.11210.455542
23-0.152205-1.26430.105187
240.5386994.47481.5e-05
25-0.152615-1.26770.104581
26-0.017893-0.14860.441141
270.0168990.14040.444388
28-0.060755-0.50470.307699
290.0877290.72870.234315
30-0.229058-1.90270.030627
310.0987350.82020.207476
32-0.044419-0.3690.356638
33-0.049412-0.41040.341375
340.0230870.19180.42424
35-0.109246-0.90750.18366
360.3302462.74320.003873
37-0.07036-0.58450.280411
38-0.035698-0.29650.383859
390.0330360.27440.392291
40-0.04973-0.41310.340412
410.0295440.24540.403432
42-0.127119-1.05590.147343
430.0842580.69990.243172
44-0.054368-0.45160.326483
45-0.027451-0.2280.410151
460.0307420.25540.399601
47-0.059519-0.49440.311295
480.16151.34150.092075
49-0.024151-0.20060.420795
50-0.020722-0.17210.431918
510.0236560.19650.422398
52-0.031-0.25750.398777
530.0061550.05110.479686
54-0.01856-0.15420.438961
550.0256160.21280.416062
56-0.045726-0.37980.352621
57-0.014108-0.11720.453525
580.0196090.16290.435544
59-0.007279-0.06050.475981
600.0441640.36690.357426


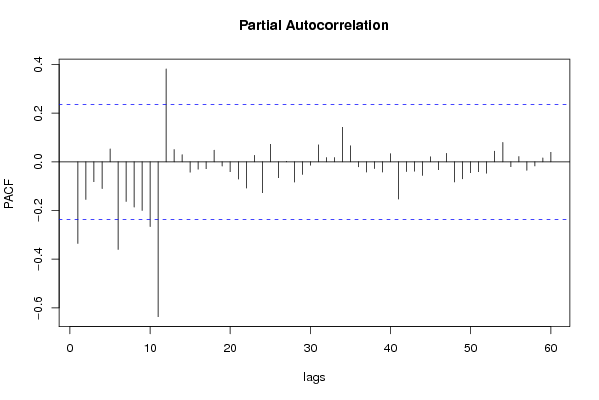
Partial Autocorrelation Function
Time lag kPACF(k)T-STATP-value
1-0.335149-2.7840.003462
2-0.154643-1.28460.101621
3-0.081522-0.67720.250281
4-0.10985-0.91250.182346
50.0533410.44310.329544
6-0.360009-2.99050.00193
7-0.16288-1.3530.090238
8-0.185754-1.5430.063704
9-0.199519-1.65730.050997
10-0.265966-2.20930.015239
11-0.636324-5.28571e-06
120.3819783.17290.001127
130.0504740.41930.338161
140.0293850.24410.403943
15-0.042332-0.35160.363093
16-0.030064-0.24970.40177
17-0.027811-0.2310.408992
180.0478670.39760.346072
19-0.017339-0.1440.442949
20-0.040484-0.33630.368838
21-0.070878-0.58880.278973
22-0.107766-0.89520.186904
230.0267040.22180.412556
24-0.126732-1.05270.148072
250.0721120.5990.275565
26-0.065143-0.54110.295083
270.0020190.01680.493335
28-0.083148-0.69070.246042
29-0.051665-0.42920.334571
30-0.01372-0.1140.454797
310.0698580.58030.281806
320.0176960.1470.441783
330.017510.14550.442389
340.1418831.17860.121309
350.06610.54910.292364
36-0.020321-0.16880.433225
37-0.042087-0.34960.363851
38-0.027539-0.22880.409867
39-0.042088-0.34960.363849
400.033560.27880.390629
41-0.153093-1.27170.103877
42-0.039848-0.3310.370822
43-0.038543-0.32020.374906
44-0.055621-0.4620.322758
450.0207220.17210.431921
46-0.031937-0.26530.395788
470.0349260.29010.386299
48-0.082443-0.68480.247875
49-0.069683-0.57880.282293
50-0.044412-0.36890.35666
51-0.040246-0.33430.36958
52-0.046365-0.38510.35066
530.0437830.36370.358603
540.0797330.66230.25499
55-0.019595-0.16280.435588
560.021610.17950.429033
57-0.034898-0.28990.386386
58-0.016931-0.14060.444281
590.0160390.13320.447201
600.0391420.32510.373032

\begin{tabular}{lllllllll}
\hline
Partial Autocorrelation Function \tabularnewline
Time lag k & PACF(k) & T-STAT & P-value \tabularnewline
1 & -0.335149 & -2.784 & 0.003462 \tabularnewline
2 & -0.154643 & -1.2846 & 0.101621 \tabularnewline
3 & -0.081522 & -0.6772 & 0.250281 \tabularnewline
4 & -0.10985 & -0.9125 & 0.182346 \tabularnewline
5 & 0.053341 & 0.4431 & 0.329544 \tabularnewline
6 & -0.360009 & -2.9905 & 0.00193 \tabularnewline
7 & -0.16288 & -1.353 & 0.090238 \tabularnewline
8 & -0.185754 & -1.543 & 0.063704 \tabularnewline
9 & -0.199519 & -1.6573 & 0.050997 \tabularnewline
10 & -0.265966 & -2.2093 & 0.015239 \tabularnewline
11 & -0.636324 & -5.2857 & 1e-06 \tabularnewline
12 & 0.381978 & 3.1729 & 0.001127 \tabularnewline
13 & 0.050474 & 0.4193 & 0.338161 \tabularnewline
14 & 0.029385 & 0.2441 & 0.403943 \tabularnewline
15 & -0.042332 & -0.3516 & 0.363093 \tabularnewline
16 & -0.030064 & -0.2497 & 0.40177 \tabularnewline
17 & -0.027811 & -0.231 & 0.408992 \tabularnewline
18 & 0.047867 & 0.3976 & 0.346072 \tabularnewline
19 & -0.017339 & -0.144 & 0.442949 \tabularnewline
20 & -0.040484 & -0.3363 & 0.368838 \tabularnewline
21 & -0.070878 & -0.5888 & 0.278973 \tabularnewline
22 & -0.107766 & -0.8952 & 0.186904 \tabularnewline
23 & 0.026704 & 0.2218 & 0.412556 \tabularnewline
24 & -0.126732 & -1.0527 & 0.148072 \tabularnewline
25 & 0.072112 & 0.599 & 0.275565 \tabularnewline
26 & -0.065143 & -0.5411 & 0.295083 \tabularnewline
27 & 0.002019 & 0.0168 & 0.493335 \tabularnewline
28 & -0.083148 & -0.6907 & 0.246042 \tabularnewline
29 & -0.051665 & -0.4292 & 0.334571 \tabularnewline
30 & -0.01372 & -0.114 & 0.454797 \tabularnewline
31 & 0.069858 & 0.5803 & 0.281806 \tabularnewline
32 & 0.017696 & 0.147 & 0.441783 \tabularnewline
33 & 0.01751 & 0.1455 & 0.442389 \tabularnewline
34 & 0.141883 & 1.1786 & 0.121309 \tabularnewline
35 & 0.0661 & 0.5491 & 0.292364 \tabularnewline
36 & -0.020321 & -0.1688 & 0.433225 \tabularnewline
37 & -0.042087 & -0.3496 & 0.363851 \tabularnewline
38 & -0.027539 & -0.2288 & 0.409867 \tabularnewline
39 & -0.042088 & -0.3496 & 0.363849 \tabularnewline
40 & 0.03356 & 0.2788 & 0.390629 \tabularnewline
41 & -0.153093 & -1.2717 & 0.103877 \tabularnewline
42 & -0.039848 & -0.331 & 0.370822 \tabularnewline
43 & -0.038543 & -0.3202 & 0.374906 \tabularnewline
44 & -0.055621 & -0.462 & 0.322758 \tabularnewline
45 & 0.020722 & 0.1721 & 0.431921 \tabularnewline
46 & -0.031937 & -0.2653 & 0.395788 \tabularnewline
47 & 0.034926 & 0.2901 & 0.386299 \tabularnewline
48 & -0.082443 & -0.6848 & 0.247875 \tabularnewline
49 & -0.069683 & -0.5788 & 0.282293 \tabularnewline
50 & -0.044412 & -0.3689 & 0.35666 \tabularnewline
51 & -0.040246 & -0.3343 & 0.36958 \tabularnewline
52 & -0.046365 & -0.3851 & 0.35066 \tabularnewline
53 & 0.043783 & 0.3637 & 0.358603 \tabularnewline
54 & 0.079733 & 0.6623 & 0.25499 \tabularnewline
55 & -0.019595 & -0.1628 & 0.435588 \tabularnewline
56 & 0.02161 & 0.1795 & 0.429033 \tabularnewline
57 & -0.034898 & -0.2899 & 0.386386 \tabularnewline
58 & -0.016931 & -0.1406 & 0.444281 \tabularnewline
59 & 0.016039 & 0.1332 & 0.447201 \tabularnewline
60 & 0.039142 & 0.3251 & 0.373032 \tabularnewline
\hline
\end{tabular}
%Source: https://freestatistics.org/blog/index.php?pk=71305&T=2

[TABLE]
[ROW][C]Partial Autocorrelation Function[/C][/ROW]
[ROW][C]Time lag k[/C][C]PACF(k)[/C][C]T-STAT[/C][C]P-value[/C][/ROW]
[ROW][C]1[/C][C]-0.335149[/C][C]-2.784[/C][C]0.003462[/C][/ROW]
[ROW][C]2[/C][C]-0.154643[/C][C]-1.2846[/C][C]0.101621[/C][/ROW]
[ROW][C]3[/C][C]-0.081522[/C][C]-0.6772[/C][C]0.250281[/C][/ROW]
[ROW][C]4[/C][C]-0.10985[/C][C]-0.9125[/C][C]0.182346[/C][/ROW]
[ROW][C]5[/C][C]0.053341[/C][C]0.4431[/C][C]0.329544[/C][/ROW]
[ROW][C]6[/C][C]-0.360009[/C][C]-2.9905[/C][C]0.00193[/C][/ROW]
[ROW][C]7[/C][C]-0.16288[/C][C]-1.353[/C][C]0.090238[/C][/ROW]
[ROW][C]8[/C][C]-0.185754[/C][C]-1.543[/C][C]0.063704[/C][/ROW]
[ROW][C]9[/C][C]-0.199519[/C][C]-1.6573[/C][C]0.050997[/C][/ROW]
[ROW][C]10[/C][C]-0.265966[/C][C]-2.2093[/C][C]0.015239[/C][/ROW]
[ROW][C]11[/C][C]-0.636324[/C][C]-5.2857[/C][C]1e-06[/C][/ROW]
[ROW][C]12[/C][C]0.381978[/C][C]3.1729[/C][C]0.001127[/C][/ROW]
[ROW][C]13[/C][C]0.050474[/C][C]0.4193[/C][C]0.338161[/C][/ROW]
[ROW][C]14[/C][C]0.029385[/C][C]0.2441[/C][C]0.403943[/C][/ROW]
[ROW][C]15[/C][C]-0.042332[/C][C]-0.3516[/C][C]0.363093[/C][/ROW]
[ROW][C]16[/C][C]-0.030064[/C][C]-0.2497[/C][C]0.40177[/C][/ROW]
[ROW][C]17[/C][C]-0.027811[/C][C]-0.231[/C][C]0.408992[/C][/ROW]
[ROW][C]18[/C][C]0.047867[/C][C]0.3976[/C][C]0.346072[/C][/ROW]
[ROW][C]19[/C][C]-0.017339[/C][C]-0.144[/C][C]0.442949[/C][/ROW]
[ROW][C]20[/C][C]-0.040484[/C][C]-0.3363[/C][C]0.368838[/C][/ROW]
[ROW][C]21[/C][C]-0.070878[/C][C]-0.5888[/C][C]0.278973[/C][/ROW]
[ROW][C]22[/C][C]-0.107766[/C][C]-0.8952[/C][C]0.186904[/C][/ROW]
[ROW][C]23[/C][C]0.026704[/C][C]0.2218[/C][C]0.412556[/C][/ROW]
[ROW][C]24[/C][C]-0.126732[/C][C]-1.0527[/C][C]0.148072[/C][/ROW]
[ROW][C]25[/C][C]0.072112[/C][C]0.599[/C][C]0.275565[/C][/ROW]
[ROW][C]26[/C][C]-0.065143[/C][C]-0.5411[/C][C]0.295083[/C][/ROW]
[ROW][C]27[/C][C]0.002019[/C][C]0.0168[/C][C]0.493335[/C][/ROW]
[ROW][C]28[/C][C]-0.083148[/C][C]-0.6907[/C][C]0.246042[/C][/ROW]
[ROW][C]29[/C][C]-0.051665[/C][C]-0.4292[/C][C]0.334571[/C][/ROW]
[ROW][C]30[/C][C]-0.01372[/C][C]-0.114[/C][C]0.454797[/C][/ROW]
[ROW][C]31[/C][C]0.069858[/C][C]0.5803[/C][C]0.281806[/C][/ROW]
[ROW][C]32[/C][C]0.017696[/C][C]0.147[/C][C]0.441783[/C][/ROW]
[ROW][C]33[/C][C]0.01751[/C][C]0.1455[/C][C]0.442389[/C][/ROW]
[ROW][C]34[/C][C]0.141883[/C][C]1.1786[/C][C]0.121309[/C][/ROW]
[ROW][C]35[/C][C]0.0661[/C][C]0.5491[/C][C]0.292364[/C][/ROW]
[ROW][C]36[/C][C]-0.020321[/C][C]-0.1688[/C][C]0.433225[/C][/ROW]
[ROW][C]37[/C][C]-0.042087[/C][C]-0.3496[/C][C]0.363851[/C][/ROW]
[ROW][C]38[/C][C]-0.027539[/C][C]-0.2288[/C][C]0.409867[/C][/ROW]
[ROW][C]39[/C][C]-0.042088[/C][C]-0.3496[/C][C]0.363849[/C][/ROW]
[ROW][C]40[/C][C]0.03356[/C][C]0.2788[/C][C]0.390629[/C][/ROW]
[ROW][C]41[/C][C]-0.153093[/C][C]-1.2717[/C][C]0.103877[/C][/ROW]
[ROW][C]42[/C][C]-0.039848[/C][C]-0.331[/C][C]0.370822[/C][/ROW]
[ROW][C]43[/C][C]-0.038543[/C][C]-0.3202[/C][C]0.374906[/C][/ROW]
[ROW][C]44[/C][C]-0.055621[/C][C]-0.462[/C][C]0.322758[/C][/ROW]
[ROW][C]45[/C][C]0.020722[/C][C]0.1721[/C][C]0.431921[/C][/ROW]
[ROW][C]46[/C][C]-0.031937[/C][C]-0.2653[/C][C]0.395788[/C][/ROW]
[ROW][C]47[/C][C]0.034926[/C][C]0.2901[/C][C]0.386299[/C][/ROW]
[ROW][C]48[/C][C]-0.082443[/C][C]-0.6848[/C][C]0.247875[/C][/ROW]
[ROW][C]49[/C][C]-0.069683[/C][C]-0.5788[/C][C]0.282293[/C][/ROW]
[ROW][C]50[/C][C]-0.044412[/C][C]-0.3689[/C][C]0.35666[/C][/ROW]
[ROW][C]51[/C][C]-0.040246[/C][C]-0.3343[/C][C]0.36958[/C][/ROW]
[ROW][C]52[/C][C]-0.046365[/C][C]-0.3851[/C][C]0.35066[/C][/ROW]
[ROW][C]53[/C][C]0.043783[/C][C]0.3637[/C][C]0.358603[/C][/ROW]
[ROW][C]54[/C][C]0.079733[/C][C]0.6623[/C][C]0.25499[/C][/ROW]
[ROW][C]55[/C][C]-0.019595[/C][C]-0.1628[/C][C]0.435588[/C][/ROW]
[ROW][C]56[/C][C]0.02161[/C][C]0.1795[/C][C]0.429033[/C][/ROW]
[ROW][C]57[/C][C]-0.034898[/C][C]-0.2899[/C][C]0.386386[/C][/ROW]
[ROW][C]58[/C][C]-0.016931[/C][C]-0.1406[/C][C]0.444281[/C][/ROW]
[ROW][C]59[/C][C]0.016039[/C][C]0.1332[/C][C]0.447201[/C][/ROW]
[ROW][C]60[/C][C]0.039142[/C][C]0.3251[/C][C]0.373032[/C][/ROW]
[/TABLE]
Source: https://freestatistics.org/blog/index.php?pk=71305&T=2

Globally Unique Identifier (entire table): ba.freestatistics.org/blog/index.php?pk=71305&T=2

As an alternative you can also use a QR Code:  

The GUIDs for individual cells are displayed in the table below:

Partial Autocorrelation Function
Time lag kPACF(k)T-STATP-value
1-0.335149-2.7840.003462
2-0.154643-1.28460.101621
3-0.081522-0.67720.250281
4-0.10985-0.91250.182346
50.0533410.44310.329544
6-0.360009-2.99050.00193
7-0.16288-1.3530.090238
8-0.185754-1.5430.063704
9-0.199519-1.65730.050997
10-0.265966-2.20930.015239
11-0.636324-5.28571e-06
120.3819783.17290.001127
130.0504740.41930.338161
140.0293850.24410.403943
15-0.042332-0.35160.363093
16-0.030064-0.24970.40177
17-0.027811-0.2310.408992
180.0478670.39760.346072
19-0.017339-0.1440.442949
20-0.040484-0.33630.368838
21-0.070878-0.58880.278973
22-0.107766-0.89520.186904
230.0267040.22180.412556
24-0.126732-1.05270.148072
250.0721120.5990.275565
26-0.065143-0.54110.295083
270.0020190.01680.493335
28-0.083148-0.69070.246042
29-0.051665-0.42920.334571
30-0.01372-0.1140.454797
310.0698580.58030.281806
320.0176960.1470.441783
330.017510.14550.442389
340.1418831.17860.121309
350.06610.54910.292364
36-0.020321-0.16880.433225
37-0.042087-0.34960.363851
38-0.027539-0.22880.409867
39-0.042088-0.34960.363849
400.033560.27880.390629
41-0.153093-1.27170.103877
42-0.039848-0.3310.370822
43-0.038543-0.32020.374906
44-0.055621-0.4620.322758
450.0207220.17210.431921
46-0.031937-0.26530.395788
470.0349260.29010.386299
48-0.082443-0.68480.247875
49-0.069683-0.57880.282293
50-0.044412-0.36890.35666
51-0.040246-0.33430.36958
52-0.046365-0.38510.35066
530.0437830.36370.358603
540.0797330.66230.25499
55-0.019595-0.16280.435588
560.021610.17950.429033
57-0.034898-0.28990.386386
58-0.016931-0.14060.444281
590.0160390.13320.447201
600.0391420.32510.373032


Parameters (Session):
par1 = 0 ; par2 = 0 ;
Parameters (R input):
par1 = 60 ; par2 = 1 ; par3 = 1 ; par4 = 0 ; par5 = 12 ; par6 = White Noise ; par7 = 0.95 ;
R code (references can be found in the software module):
if (par1 == 'Default') {
par1 = 10*log10(length(x))
} else {
par1 <- as.numeric(par1)
}
par2 <- as.numeric(par2)
par3 <- as.numeric(par3)
par4 <- as.numeric(par4)
par5 <- as.numeric(par5)
if (par6 == 'White Noise') par6 <- 'white' else par6 <- 'ma'
par7 <- as.numeric(par7)
if (par2 == 0) {
x <- log(x)
} else {
x <- (x ^ par2 - 1) / par2
}
if (par3 > 0) x <- diff(x,lag=1,difference=par3)
if (par4 > 0) x <- diff(x,lag=par5,difference=par4)
bitmap(file='pic1.png')
racf <- acf(x, par1, main='Autocorrelation', xlab='time lag', ylab='ACF', ci.type=par6, ci=par7, sub=paste('(lambda=',par2,', d=',par3,', D=',par4,', CI=', par7, ', CI type=',par6,')',sep=''))
dev.off()
bitmap(file='pic2.png')
rpacf <- pacf(x,par1,main='Partial Autocorrelation',xlab='lags',ylab='PACF')
dev.off()
(myacf <- c(racf$acf))
(mypacf <- c(rpacf$acf))
lengthx <- length(x)
sqrtn <- sqrt(lengthx)
load(file='createtable')
a<-table.start()
a<-table.row.start(a)
a<-table.element(a,'Autocorrelation Function',4,TRUE)
a<-table.row.end(a)
a<-table.row.start(a)
a<-table.element(a,'Time lag k',header=TRUE)
a<-table.element(a,hyperlink('basics.htm','ACF(k)','click here for more information about the Autocorrelation Function'),header=TRUE)
a<-table.element(a,'T-STAT',header=TRUE)
a<-table.element(a,'P-value',header=TRUE)
a<-table.row.end(a)
for (i in 2:(par1+1)) {
a<-table.row.start(a)
a<-table.element(a,i-1,header=TRUE)
a<-table.element(a,round(myacf[i],6))
mytstat <- myacf[i]*sqrtn
a<-table.element(a,round(mytstat,4))
a<-table.element(a,round(1-pt(abs(mytstat),lengthx),6))
a<-table.row.end(a)
}
a<-table.end(a)
table.save(a,file='mytable.tab')
a<-table.start()
a<-table.row.start(a)
a<-table.element(a,'Partial Autocorrelation Function',4,TRUE)
a<-table.row.end(a)
a<-table.row.start(a)
a<-table.element(a,'Time lag k',header=TRUE)
a<-table.element(a,hyperlink('basics.htm','PACF(k)','click here for more information about the Partial Autocorrelation Function'),header=TRUE)
a<-table.element(a,'T-STAT',header=TRUE)
a<-table.element(a,'P-value',header=TRUE)
a<-table.row.end(a)
for (i in 1:par1) {
a<-table.row.start(a)
a<-table.element(a,i,header=TRUE)
a<-table.element(a,round(mypacf[i],6))
mytstat <- mypacf[i]*sqrtn
a<-table.element(a,round(mytstat,4))
a<-table.element(a,round(1-pt(abs(mytstat),lengthx),6))
a<-table.row.end(a)
}
a<-table.end(a)
table.save(a,file='mytable1.tab')