| Multiple Linear Regression - Estimated Regression Equation |
| InvoerEU[t] = + 8364.55205053314 + 4.25910868244174InvoerAM[t] -1684.39974677317M1[t] -1600.38474977774M2[t] + 20.5273625242572M3[t] -202.968619017035M4[t] -575.369022465705M5[t] -758.070770420407M6[t] -787.57039184164M7[t] -118.799364083242M8[t] + 588.144644564955M9[t] -484.156862564042M10[t] -968.319152204772M11[t] + e[t] |
| Multiple Linear Regression - Ordinary Least Squares | |||||
| Variable | Parameter | S.D. | T-STAT H0: parameter = 0 | 2-tail p-value | 1-tail p-value |
| (Intercept) | 8364.55205053314 | 1129.858267 | 7.4032 | 0 | 0 |
| InvoerAM | 4.25910868244174 | 0.648476 | 6.5679 | 0 | 0 |
| M1 | -1684.39974677317 | 749.130925 | -2.2485 | 0.029174 | 0.014587 |
| M2 | -1600.38474977774 | 790.955399 | -2.0234 | 0.048624 | 0.024312 |
| M3 | 20.5273625242572 | 783.865039 | 0.0262 | 0.979216 | 0.489608 |
| M4 | -202.968619017035 | 779.621155 | -0.2603 | 0.795713 | 0.397857 |
| M5 | -575.369022465705 | 779.553346 | -0.7381 | 0.464062 | 0.232031 |
| M6 | -758.070770420407 | 783.325933 | -0.9678 | 0.338016 | 0.169008 |
| M7 | -787.57039184164 | 786.713665 | -1.0011 | 0.321804 | 0.160902 |
| M8 | -118.799364083242 | 799.066207 | -0.1487 | 0.882435 | 0.441217 |
| M9 | 588.144644564955 | 780.563679 | 0.7535 | 0.454837 | 0.227419 |
| M10 | -484.156862564042 | 785.720098 | -0.6162 | 0.540677 | 0.270339 |
| M11 | -968.319152204772 | 779.990381 | -1.2415 | 0.220472 | 0.110236 |
| Multiple Linear Regression - Regression Statistics | |
| Multiple R | 0.764773460760515 |
| R-squared | 0.584878446283615 |
| Adjusted R-squared | 0.481098057854518 |
| F-TEST (value) | 5.63573190596804 |
| F-TEST (DF numerator) | 12 |
| F-TEST (DF denominator) | 48 |
| p-value | 6.45909708762993e-06 |
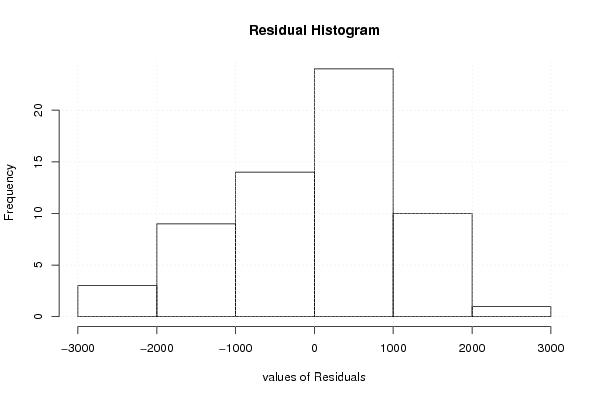
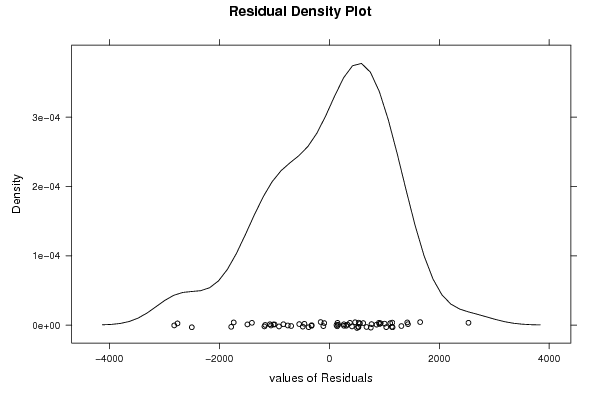
| Multiple Linear Regression - Residual Statistics | |
| Residual Standard Deviation | 1231.29133474384 |
| Sum Squared Residuals | 72771760.8487324 |
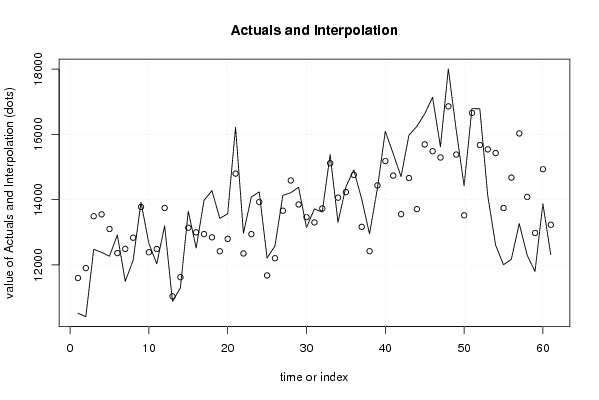
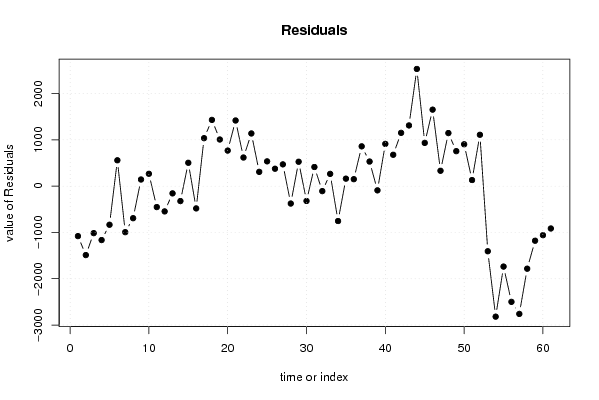
| Multiple Linear Regression - Actuals, Interpolation, and Residuals | |||
| Time or Index | Actuals | Interpolation Forecast | Residuals Prediction Error |
| 1 | 10519.2 | 11598.5710102437 | -1079.37101024372 |
| 2 | 10414.9 | 11903.6337478578 | -1488.73374785785 |
| 3 | 12476.8 | 13491.7507233050 | -1014.95072330504 |
| 4 | 12384.6 | 13549.3559148049 | -1164.7559148049 |
| 5 | 12266.7 | 13100.7174659405 | -834.017465940526 |
| 6 | 12919.9 | 12361.7761240589 | 558.123875941065 |
| 7 | 11497.3 | 12491.5671673610 | -994.267167361022 |
| 8 | 12142 | 12834.5163809126 | -692.516380912629 |
| 9 | 13919.4 | 13776.1372779634 | 143.262722036637 |
| 10 | 12656.8 | 12389.9394609384 | 266.860539061589 |
| 11 | 12034.1 | 12486.2936847145 | -452.19368471449 |
| 12 | 13199.7 | 13745.5099599300 | -545.809959930032 |
| 13 | 10881.3 | 11037.6463967661 | -156.34639676611 |
| 14 | 11301.2 | 11623.8103074214 | -322.61030742142 |
| 15 | 13643.9 | 13139.5224352671 | 504.37756473289 |
| 16 | 12517 | 12998.2272512969 | -481.227251296943 |
| 17 | 13981.1 | 12944.8340881632 | 1036.26591183684 |
| 18 | 14275.7 | 12845.1849595161 | 1430.51504048393 |
| 19 | 13425 | 12417.4586762865 | 1007.54132371346 |
| 20 | 13565.7 | 12797.4621353754 | 768.237864624616 |
| 21 | 16216.3 | 14798.3233617494 | 1417.97663825062 |
| 22 | 12970 | 12352.0333936647 | 617.96660633532 |
| 23 | 14079.9 | 12942.444224604 | 1137.455775396 |
| 24 | 14235 | 13926.5220789338 | 308.477921066193 |
| 25 | 12213.4 | 11678.2163426053 | 535.183657394653 |
| 26 | 12581 | 12204.7527317065 | 376.247268293526 |
| 27 | 14130.4 | 13660.4114271297 | 469.988572870266 |
| 28 | 14210.8 | 14586.8747898477 | -376.074789847712 |
| 29 | 14378.5 | 13851.598326655 | 526.901673344994 |
| 30 | 13142.8 | 13463.1816293384 | -320.381629338368 |
| 31 | 13714.7 | 13301.6496387614 | 413.050361238561 |
| 32 | 13621.9 | 13729.3551150936 | -107.455115093637 |
| 33 | 15379.8 | 15115.2010477230 | 264.598952276953 |
| 34 | 13306.3 | 14060.3618861921 | -754.061886192061 |
| 35 | 14391.2 | 14229.5468684379 | 161.653131562107 |
| 36 | 14909.9 | 14759.6037372194 | 150.296262780590 |
| 37 | 14025.4 | 13165.9230053822 | 859.476994617754 |
| 38 | 12951.2 | 12420.2636310380 | 530.936368961976 |
| 39 | 14344.3 | 14435.1432964659 | -90.8432964658868 |
| 40 | 16093.4 | 15180.5945401801 | 912.80545981991 |
| 41 | 15413.6 | 14736.2151999982 | 677.384800001847 |
| 42 | 14705.7 | 13554.7524660109 | 1150.94753398914 |
| 43 | 15972.8 | 14661.5830410651 | 1311.21695893491 |
| 44 | 16241.4 | 13710.1891260226 | 2531.21087397735 |
| 45 | 16626.4 | 15692.3102741939 | 934.0897258061 |
| 46 | 17136.2 | 15483.7560078641 | 1652.44399213591 |
| 47 | 15622.9 | 15290.9167521024 | 331.983247897627 |
| 48 | 18003.9 | 16857.6406741902 | 1146.25932580979 |
| 49 | 16136.1 | 15380.6595202519 | 755.440479748052 |
| 50 | 14423.7 | 13519.5395819762 | 904.160418023764 |
| 51 | 16789.4 | 16657.9721178322 | 131.427882167772 |
| 52 | 16782.2 | 15672.9475038704 | 1109.25249612965 |
| 53 | 14133.8 | 15540.3349192432 | -1406.53491924316 |
| 54 | 12607 | 15426.2048210758 | -2819.20482107576 |
| 55 | 12004.5 | 13742.0414765259 | -1737.54147652592 |
| 56 | 12175.4 | 14674.8772425957 | -2499.47724259570 |
| 57 | 13268 | 16027.9280383703 | -2759.92803837031 |
| 58 | 12299.3 | 14082.5092513408 | -1783.20925134076 |
| 59 | 11800.6 | 12979.4984701412 | -1178.89847014124 |
| 60 | 13873.3 | 14932.5235497265 | -1059.22354972654 |
| 61 | 12315 | 13229.3837247506 | -914.383724750628 |
| Goldfeld-Quandt test for Heteroskedasticity | |||
| p-values | Alternative Hypothesis | ||
| breakpoint index | greater | 2-sided | less |
| 16 | 0.0486335984339357 | 0.0972671968678714 | 0.951366401566064 |
| 17 | 0.08549179595792 | 0.17098359191584 | 0.91450820404208 |
| 18 | 0.136320352114358 | 0.272640704228716 | 0.863679647885642 |
| 19 | 0.168295964981922 | 0.336591929963843 | 0.831704035018078 |
| 20 | 0.142005085249284 | 0.284010170498568 | 0.857994914750716 |
| 21 | 0.194037697206734 | 0.388075394413467 | 0.805962302793266 |
| 22 | 0.125660271838602 | 0.251320543677204 | 0.874339728161398 |
| 23 | 0.121575426482228 | 0.243150852964456 | 0.878424573517772 |
| 24 | 0.0818364569434377 | 0.163672913886875 | 0.918163543056562 |
| 25 | 0.0610996444340591 | 0.122199288868118 | 0.938900355565941 |
| 26 | 0.0450683416634895 | 0.090136683326979 | 0.95493165833651 |
| 27 | 0.0269004750948161 | 0.0538009501896323 | 0.973099524905184 |
| 28 | 0.0164703267371480 | 0.0329406534742959 | 0.983529673262852 |
| 29 | 0.00889727707681753 | 0.0177945541536351 | 0.991102722923182 |
| 30 | 0.00923115139797513 | 0.0184623027959503 | 0.990768848602025 |
| 31 | 0.00476725489038192 | 0.00953450978076384 | 0.995232745109618 |
| 32 | 0.00232407545790241 | 0.00464815091580483 | 0.997675924542098 |
| 33 | 0.00136450585447351 | 0.00272901170894701 | 0.998635494145526 |
| 34 | 0.000958698676184506 | 0.00191739735236901 | 0.999041301323816 |
| 35 | 0.000415587241278794 | 0.000831174482557587 | 0.999584412758721 |
| 36 | 0.000171642855824269 | 0.000343285711648538 | 0.999828357144176 |
| 37 | 0.000114694968796046 | 0.000229389937592091 | 0.999885305031204 |
| 38 | 5.85798574308129e-05 | 0.000117159714861626 | 0.99994142014257 |
| 39 | 2.02530337805781e-05 | 4.05060675611562e-05 | 0.99997974696622 |
| 40 | 1.30791739273208e-05 | 2.61583478546415e-05 | 0.999986920826073 |
| 41 | 6.77478604168934e-06 | 1.35495720833787e-05 | 0.999993225213958 |
| 42 | 3.98388975719368e-05 | 7.96777951438736e-05 | 0.999960161102428 |
| 43 | 3.31194979751479e-05 | 6.62389959502958e-05 | 0.999966880502025 |
| 44 | 0.0159538856167959 | 0.0319077712335918 | 0.984046114383204 |
| 45 | 0.332152560562777 | 0.664305121125554 | 0.667847439437223 |
| Meta Analysis of Goldfeld-Quandt test for Heteroskedasticity | |||
| Description | # significant tests | % significant tests | OK/NOK |
| 1% type I error level | 13 | 0.433333333333333 | NOK |
| 5% type I error level | 17 | 0.566666666666667 | NOK |
| 10% type I error level | 20 | 0.666666666666667 | NOK |