Free Statistics

of Irreproducible Research!

Author's title

Author*The author of this computation has been verified*
R Software Modulerwasp_autocorrelation.wasp
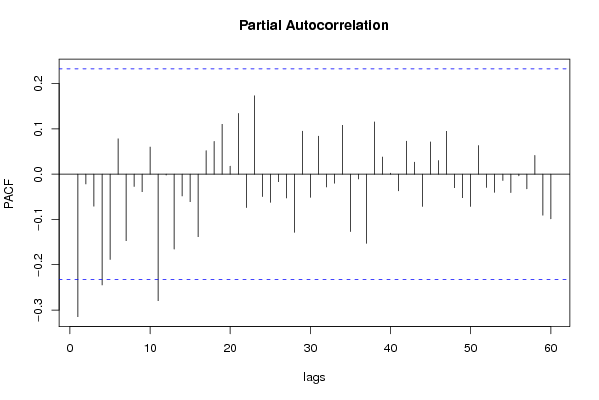
Title produced by software(Partial) Autocorrelation Function
Date of computationWed, 30 Dec 2009 06:51:16 -0700
Cite this page as followsStatistical Computations at FreeStatistics.org, Office for Research Development and Education, URL https://freestatistics.org/blog/index.php?v=date/2009/Dec/30/t1262181204ov1vhbbcsckbyjz.htm/, Retrieved Mon, 29 Apr 2024 07:36:07 +0000
Statistical Computations at FreeStatistics.org, Office for Research Development and Education, URL https://freestatistics.org/blog/index.php?pk=71281, Retrieved Mon, 29 Apr 2024 07:36:07 +0000
QR Codes:

Original text written by user:
IsPrivate?No (this computation is public)
User-defined keywords
Estimated Impact133
Family? (F = Feedback message, R = changed R code, M = changed R Module, P = changed Parameters, D = changed Data)
-     [Univariate Data Series] [De Belgische uitv...] [2009-10-13 01:35:54] [df6326eec97a6ca984a853b142930499]
- RMPD  [Univariate Data Series] [ws8] [2009-11-27 12:04:12] [acdebb2ecda2ddb208f4e14f4a68b9e7]
-   PD    [Univariate Data Series] [consumptiekrediet] [2009-12-04 10:09:44] [acdebb2ecda2ddb208f4e14f4a68b9e7]
-   PD      [Univariate Data Series] [Verkoopprijs per ...] [2009-12-20 19:05:51] [acdebb2ecda2ddb208f4e14f4a68b9e7]
- RMPD          [(Partial) Autocorrelation Function] [Autocorrelatie me...] [2009-12-30 13:51:16] [b243db81ea3e1f02fb3382887fb0f701] [Current]
Feedback Forum

Post a new message
Dataseries X:
228
136
174
69
108
149
134
131
180
127
59
59
202
173
296
154
117
86
38
17
52
12
61
65
70
91
111
90
110
100
99
137
139
124
103
75
55
75
65
17
27
17
20
131
26
66
59
35
57
6
24
57
42
55
30
35
22
18
22
82
90
66
64
50
56
99
97
41
59
92
91
47


Summary of computational transaction
Raw Inputview raw input (R code)
Raw Outputview raw output of R engine
Computing time2 seconds
R Server'Gwilym Jenkins' @ 72.249.127.135

\begin{tabular}{lllllllll}
\hline
Summary of computational transaction \tabularnewline
Raw Input & view raw input (R code)  \tabularnewline
Raw Output & view raw output of R engine  \tabularnewline
Computing time & 2 seconds \tabularnewline
R Server & 'Gwilym Jenkins' @ 72.249.127.135 \tabularnewline
\hline
\end{tabular}
%Source: https://freestatistics.org/blog/index.php?pk=71281&T=0

[TABLE]
[ROW][C]Summary of computational transaction[/C][/ROW]
[ROW][C]Raw Input[/C][C]view raw input (R code) [/C][/ROW]
[ROW][C]Raw Output[/C][C]view raw output of R engine [/C][/ROW]
[ROW][C]Computing time[/C][C]2 seconds[/C][/ROW]
[ROW][C]R Server[/C][C]'Gwilym Jenkins' @ 72.249.127.135[/C][/ROW]
[/TABLE]
Source: https://freestatistics.org/blog/index.php?pk=71281&T=0

Globally Unique Identifier (entire table): ba.freestatistics.org/blog/index.php?pk=71281&T=0

As an alternative you can also use a QR Code:  

The GUIDs for individual cells are displayed in the table below:

Summary of computational transaction
Raw Inputview raw input (R code)
Raw Outputview raw output of R engine
Computing time2 seconds
R Server'Gwilym Jenkins' @ 72.249.127.135


Autocorrelation Function
Time lag kACF(k)T-STATP-value
1-0.314706-2.65180.004935
20.0797830.67230.251799
3-0.082432-0.69460.244791
4-0.173863-1.4650.073669
5-0.029996-0.25270.400596
60.1374771.15840.125291
7-0.154724-1.30370.098269
80.1470381.2390.109719
9-0.06421-0.5410.295085
100.0667010.5620.287933
11-0.229312-1.93220.028661
120.1624251.36860.087717
13-0.208022-1.75280.041974
140.1499211.26330.105315
150.0059780.05040.479983
16-0.049068-0.41350.340259
170.105650.89020.188177
180.0810940.68330.248319
19-0.040649-0.34250.366489
200.0732610.61730.269504
21-0.059801-0.50390.30795
22-0.080393-0.67740.250177
230.1095570.92310.179529
24-0.078548-0.66190.255102
25-0.073275-0.61740.269463
260.0721260.60770.272648
27-0.080716-0.68010.249319
28-0.066901-0.56370.287362
290.1923981.62120.054707
30-0.193054-1.62670.054115
310.1728971.45690.074783
32-0.069167-0.58280.280932
33-0.010157-0.08560.466019
340.0481960.40610.342943
35-0.022895-0.19290.423787
36-0.018713-0.15770.43758
370.0238930.20130.420511
380.0658810.55510.290279
390.063690.53670.296589
40-0.104399-0.87970.191
410.0704270.59340.27739
42-0.17355-1.46240.074028
430.0903460.76130.224508
44-0.078179-0.65880.256093
450.015660.1320.447697
460.0955760.80530.211656
47-0.010512-0.08860.464833
480.0236410.19920.421337
49-0.066553-0.56080.288355
50-0.082985-0.69920.243342
510.0642350.54130.295015
520.0288860.24340.404201
530.0007730.00650.49741
540.0152320.12830.449118
55-0.020403-0.17190.431995
56-0.003365-0.02840.488731
570.038860.32740.37215
58-0.005102-0.0430.482916
59-0.096073-0.80950.210459
600.0296230.24960.401806

\begin{tabular}{lllllllll}
\hline
Autocorrelation Function \tabularnewline
Time lag k & ACF(k) & T-STAT & P-value \tabularnewline
1 & -0.314706 & -2.6518 & 0.004935 \tabularnewline
2 & 0.079783 & 0.6723 & 0.251799 \tabularnewline
3 & -0.082432 & -0.6946 & 0.244791 \tabularnewline
4 & -0.173863 & -1.465 & 0.073669 \tabularnewline
5 & -0.029996 & -0.2527 & 0.400596 \tabularnewline
6 & 0.137477 & 1.1584 & 0.125291 \tabularnewline
7 & -0.154724 & -1.3037 & 0.098269 \tabularnewline
8 & 0.147038 & 1.239 & 0.109719 \tabularnewline
9 & -0.06421 & -0.541 & 0.295085 \tabularnewline
10 & 0.066701 & 0.562 & 0.287933 \tabularnewline
11 & -0.229312 & -1.9322 & 0.028661 \tabularnewline
12 & 0.162425 & 1.3686 & 0.087717 \tabularnewline
13 & -0.208022 & -1.7528 & 0.041974 \tabularnewline
14 & 0.149921 & 1.2633 & 0.105315 \tabularnewline
15 & 0.005978 & 0.0504 & 0.479983 \tabularnewline
16 & -0.049068 & -0.4135 & 0.340259 \tabularnewline
17 & 0.10565 & 0.8902 & 0.188177 \tabularnewline
18 & 0.081094 & 0.6833 & 0.248319 \tabularnewline
19 & -0.040649 & -0.3425 & 0.366489 \tabularnewline
20 & 0.073261 & 0.6173 & 0.269504 \tabularnewline
21 & -0.059801 & -0.5039 & 0.30795 \tabularnewline
22 & -0.080393 & -0.6774 & 0.250177 \tabularnewline
23 & 0.109557 & 0.9231 & 0.179529 \tabularnewline
24 & -0.078548 & -0.6619 & 0.255102 \tabularnewline
25 & -0.073275 & -0.6174 & 0.269463 \tabularnewline
26 & 0.072126 & 0.6077 & 0.272648 \tabularnewline
27 & -0.080716 & -0.6801 & 0.249319 \tabularnewline
28 & -0.066901 & -0.5637 & 0.287362 \tabularnewline
29 & 0.192398 & 1.6212 & 0.054707 \tabularnewline
30 & -0.193054 & -1.6267 & 0.054115 \tabularnewline
31 & 0.172897 & 1.4569 & 0.074783 \tabularnewline
32 & -0.069167 & -0.5828 & 0.280932 \tabularnewline
33 & -0.010157 & -0.0856 & 0.466019 \tabularnewline
34 & 0.048196 & 0.4061 & 0.342943 \tabularnewline
35 & -0.022895 & -0.1929 & 0.423787 \tabularnewline
36 & -0.018713 & -0.1577 & 0.43758 \tabularnewline
37 & 0.023893 & 0.2013 & 0.420511 \tabularnewline
38 & 0.065881 & 0.5551 & 0.290279 \tabularnewline
39 & 0.06369 & 0.5367 & 0.296589 \tabularnewline
40 & -0.104399 & -0.8797 & 0.191 \tabularnewline
41 & 0.070427 & 0.5934 & 0.27739 \tabularnewline
42 & -0.17355 & -1.4624 & 0.074028 \tabularnewline
43 & 0.090346 & 0.7613 & 0.224508 \tabularnewline
44 & -0.078179 & -0.6588 & 0.256093 \tabularnewline
45 & 0.01566 & 0.132 & 0.447697 \tabularnewline
46 & 0.095576 & 0.8053 & 0.211656 \tabularnewline
47 & -0.010512 & -0.0886 & 0.464833 \tabularnewline
48 & 0.023641 & 0.1992 & 0.421337 \tabularnewline
49 & -0.066553 & -0.5608 & 0.288355 \tabularnewline
50 & -0.082985 & -0.6992 & 0.243342 \tabularnewline
51 & 0.064235 & 0.5413 & 0.295015 \tabularnewline
52 & 0.028886 & 0.2434 & 0.404201 \tabularnewline
53 & 0.000773 & 0.0065 & 0.49741 \tabularnewline
54 & 0.015232 & 0.1283 & 0.449118 \tabularnewline
55 & -0.020403 & -0.1719 & 0.431995 \tabularnewline
56 & -0.003365 & -0.0284 & 0.488731 \tabularnewline
57 & 0.03886 & 0.3274 & 0.37215 \tabularnewline
58 & -0.005102 & -0.043 & 0.482916 \tabularnewline
59 & -0.096073 & -0.8095 & 0.210459 \tabularnewline
60 & 0.029623 & 0.2496 & 0.401806 \tabularnewline
\hline
\end{tabular}
%Source: https://freestatistics.org/blog/index.php?pk=71281&T=1

[TABLE]
[ROW][C]Autocorrelation Function[/C][/ROW]
[ROW][C]Time lag k[/C][C]ACF(k)[/C][C]T-STAT[/C][C]P-value[/C][/ROW]
[ROW][C]1[/C][C]-0.314706[/C][C]-2.6518[/C][C]0.004935[/C][/ROW]
[ROW][C]2[/C][C]0.079783[/C][C]0.6723[/C][C]0.251799[/C][/ROW]
[ROW][C]3[/C][C]-0.082432[/C][C]-0.6946[/C][C]0.244791[/C][/ROW]
[ROW][C]4[/C][C]-0.173863[/C][C]-1.465[/C][C]0.073669[/C][/ROW]
[ROW][C]5[/C][C]-0.029996[/C][C]-0.2527[/C][C]0.400596[/C][/ROW]
[ROW][C]6[/C][C]0.137477[/C][C]1.1584[/C][C]0.125291[/C][/ROW]
[ROW][C]7[/C][C]-0.154724[/C][C]-1.3037[/C][C]0.098269[/C][/ROW]
[ROW][C]8[/C][C]0.147038[/C][C]1.239[/C][C]0.109719[/C][/ROW]
[ROW][C]9[/C][C]-0.06421[/C][C]-0.541[/C][C]0.295085[/C][/ROW]
[ROW][C]10[/C][C]0.066701[/C][C]0.562[/C][C]0.287933[/C][/ROW]
[ROW][C]11[/C][C]-0.229312[/C][C]-1.9322[/C][C]0.028661[/C][/ROW]
[ROW][C]12[/C][C]0.162425[/C][C]1.3686[/C][C]0.087717[/C][/ROW]
[ROW][C]13[/C][C]-0.208022[/C][C]-1.7528[/C][C]0.041974[/C][/ROW]
[ROW][C]14[/C][C]0.149921[/C][C]1.2633[/C][C]0.105315[/C][/ROW]
[ROW][C]15[/C][C]0.005978[/C][C]0.0504[/C][C]0.479983[/C][/ROW]
[ROW][C]16[/C][C]-0.049068[/C][C]-0.4135[/C][C]0.340259[/C][/ROW]
[ROW][C]17[/C][C]0.10565[/C][C]0.8902[/C][C]0.188177[/C][/ROW]
[ROW][C]18[/C][C]0.081094[/C][C]0.6833[/C][C]0.248319[/C][/ROW]
[ROW][C]19[/C][C]-0.040649[/C][C]-0.3425[/C][C]0.366489[/C][/ROW]
[ROW][C]20[/C][C]0.073261[/C][C]0.6173[/C][C]0.269504[/C][/ROW]
[ROW][C]21[/C][C]-0.059801[/C][C]-0.5039[/C][C]0.30795[/C][/ROW]
[ROW][C]22[/C][C]-0.080393[/C][C]-0.6774[/C][C]0.250177[/C][/ROW]
[ROW][C]23[/C][C]0.109557[/C][C]0.9231[/C][C]0.179529[/C][/ROW]
[ROW][C]24[/C][C]-0.078548[/C][C]-0.6619[/C][C]0.255102[/C][/ROW]
[ROW][C]25[/C][C]-0.073275[/C][C]-0.6174[/C][C]0.269463[/C][/ROW]
[ROW][C]26[/C][C]0.072126[/C][C]0.6077[/C][C]0.272648[/C][/ROW]
[ROW][C]27[/C][C]-0.080716[/C][C]-0.6801[/C][C]0.249319[/C][/ROW]
[ROW][C]28[/C][C]-0.066901[/C][C]-0.5637[/C][C]0.287362[/C][/ROW]
[ROW][C]29[/C][C]0.192398[/C][C]1.6212[/C][C]0.054707[/C][/ROW]
[ROW][C]30[/C][C]-0.193054[/C][C]-1.6267[/C][C]0.054115[/C][/ROW]
[ROW][C]31[/C][C]0.172897[/C][C]1.4569[/C][C]0.074783[/C][/ROW]
[ROW][C]32[/C][C]-0.069167[/C][C]-0.5828[/C][C]0.280932[/C][/ROW]
[ROW][C]33[/C][C]-0.010157[/C][C]-0.0856[/C][C]0.466019[/C][/ROW]
[ROW][C]34[/C][C]0.048196[/C][C]0.4061[/C][C]0.342943[/C][/ROW]
[ROW][C]35[/C][C]-0.022895[/C][C]-0.1929[/C][C]0.423787[/C][/ROW]
[ROW][C]36[/C][C]-0.018713[/C][C]-0.1577[/C][C]0.43758[/C][/ROW]
[ROW][C]37[/C][C]0.023893[/C][C]0.2013[/C][C]0.420511[/C][/ROW]
[ROW][C]38[/C][C]0.065881[/C][C]0.5551[/C][C]0.290279[/C][/ROW]
[ROW][C]39[/C][C]0.06369[/C][C]0.5367[/C][C]0.296589[/C][/ROW]
[ROW][C]40[/C][C]-0.104399[/C][C]-0.8797[/C][C]0.191[/C][/ROW]
[ROW][C]41[/C][C]0.070427[/C][C]0.5934[/C][C]0.27739[/C][/ROW]
[ROW][C]42[/C][C]-0.17355[/C][C]-1.4624[/C][C]0.074028[/C][/ROW]
[ROW][C]43[/C][C]0.090346[/C][C]0.7613[/C][C]0.224508[/C][/ROW]
[ROW][C]44[/C][C]-0.078179[/C][C]-0.6588[/C][C]0.256093[/C][/ROW]
[ROW][C]45[/C][C]0.01566[/C][C]0.132[/C][C]0.447697[/C][/ROW]
[ROW][C]46[/C][C]0.095576[/C][C]0.8053[/C][C]0.211656[/C][/ROW]
[ROW][C]47[/C][C]-0.010512[/C][C]-0.0886[/C][C]0.464833[/C][/ROW]
[ROW][C]48[/C][C]0.023641[/C][C]0.1992[/C][C]0.421337[/C][/ROW]
[ROW][C]49[/C][C]-0.066553[/C][C]-0.5608[/C][C]0.288355[/C][/ROW]
[ROW][C]50[/C][C]-0.082985[/C][C]-0.6992[/C][C]0.243342[/C][/ROW]
[ROW][C]51[/C][C]0.064235[/C][C]0.5413[/C][C]0.295015[/C][/ROW]
[ROW][C]52[/C][C]0.028886[/C][C]0.2434[/C][C]0.404201[/C][/ROW]
[ROW][C]53[/C][C]0.000773[/C][C]0.0065[/C][C]0.49741[/C][/ROW]
[ROW][C]54[/C][C]0.015232[/C][C]0.1283[/C][C]0.449118[/C][/ROW]
[ROW][C]55[/C][C]-0.020403[/C][C]-0.1719[/C][C]0.431995[/C][/ROW]
[ROW][C]56[/C][C]-0.003365[/C][C]-0.0284[/C][C]0.488731[/C][/ROW]
[ROW][C]57[/C][C]0.03886[/C][C]0.3274[/C][C]0.37215[/C][/ROW]
[ROW][C]58[/C][C]-0.005102[/C][C]-0.043[/C][C]0.482916[/C][/ROW]
[ROW][C]59[/C][C]-0.096073[/C][C]-0.8095[/C][C]0.210459[/C][/ROW]
[ROW][C]60[/C][C]0.029623[/C][C]0.2496[/C][C]0.401806[/C][/ROW]
[/TABLE]
Source: https://freestatistics.org/blog/index.php?pk=71281&T=1

Globally Unique Identifier (entire table): ba.freestatistics.org/blog/index.php?pk=71281&T=1

As an alternative you can also use a QR Code:  

The GUIDs for individual cells are displayed in the table below:

Autocorrelation Function
Time lag kACF(k)T-STATP-value
1-0.314706-2.65180.004935
20.0797830.67230.251799
3-0.082432-0.69460.244791
4-0.173863-1.4650.073669
5-0.029996-0.25270.400596
60.1374771.15840.125291
7-0.154724-1.30370.098269
80.1470381.2390.109719
9-0.06421-0.5410.295085
100.0667010.5620.287933
11-0.229312-1.93220.028661
120.1624251.36860.087717
13-0.208022-1.75280.041974
140.1499211.26330.105315
150.0059780.05040.479983
16-0.049068-0.41350.340259
170.105650.89020.188177
180.0810940.68330.248319
19-0.040649-0.34250.366489
200.0732610.61730.269504
21-0.059801-0.50390.30795
22-0.080393-0.67740.250177
230.1095570.92310.179529
24-0.078548-0.66190.255102
25-0.073275-0.61740.269463
260.0721260.60770.272648
27-0.080716-0.68010.249319
28-0.066901-0.56370.287362
290.1923981.62120.054707
30-0.193054-1.62670.054115
310.1728971.45690.074783
32-0.069167-0.58280.280932
33-0.010157-0.08560.466019
340.0481960.40610.342943
35-0.022895-0.19290.423787
36-0.018713-0.15770.43758
370.0238930.20130.420511
380.0658810.55510.290279
390.063690.53670.296589
40-0.104399-0.87970.191
410.0704270.59340.27739
42-0.17355-1.46240.074028
430.0903460.76130.224508
44-0.078179-0.65880.256093
450.015660.1320.447697
460.0955760.80530.211656
47-0.010512-0.08860.464833
480.0236410.19920.421337
49-0.066553-0.56080.288355
50-0.082985-0.69920.243342
510.0642350.54130.295015
520.0288860.24340.404201
530.0007730.00650.49741
540.0152320.12830.449118
55-0.020403-0.17190.431995
56-0.003365-0.02840.488731
570.038860.32740.37215
58-0.005102-0.0430.482916
59-0.096073-0.80950.210459
600.0296230.24960.401806


Partial Autocorrelation Function
Time lag kPACF(k)T-STATP-value
1-0.314706-2.65180.004935
2-0.021374-0.18010.428794
3-0.070528-0.59430.277108
4-0.244585-2.06090.021488
5-0.188381-1.58730.058441
60.0783060.65980.255752
7-0.146952-1.23820.109853
8-0.026984-0.22740.410394
9-0.038506-0.32450.373272
100.0600950.50640.307083
11-0.279316-2.35360.010684
12-0.001815-0.01530.493922
13-0.165241-1.39230.084081
14-0.04806-0.4050.343363
15-0.06064-0.5110.305483
16-0.137955-1.16240.124477
170.0520870.43890.331036
180.072480.61070.271665
190.1102080.92860.178114
200.01770.14910.440932
210.1344271.13270.130576
22-0.073566-0.61990.268662
230.1732681.460.074353
24-0.049364-0.41590.339351
25-0.062167-0.52380.301014
26-0.016501-0.1390.444908
27-0.052339-0.4410.330269
28-0.128262-1.08080.141732
290.0950980.80130.212812
30-0.050954-0.42930.334487
310.0839480.70740.24083
32-0.027993-0.23590.407104
33-0.019762-0.16650.434111
340.1080420.91040.182852
35-0.126818-1.06860.144437
36-0.010476-0.08830.464954
37-0.15275-1.28710.101121
380.1156590.97460.166543
390.0378350.31880.375406
400.0023590.01990.492098
41-0.036541-0.30790.379529
420.0729680.61480.270314
430.0265680.22390.411753
44-0.071288-0.60070.274983
450.0714170.60180.274623
460.0300570.25330.400396
470.0948290.7990.213464
48-0.029677-0.25010.40163
49-0.051773-0.43620.331991
50-0.071075-0.59890.275578
510.0632960.53330.297731
52-0.029104-0.24520.403492
53-0.040012-0.33710.368501
54-0.013806-0.11630.453859
55-0.04055-0.34170.366802
56-0.003489-0.02940.488313
57-0.032356-0.27260.392963
580.0415480.35010.363655
59-0.090517-0.76270.224082
60-0.098512-0.83010.204639

\begin{tabular}{lllllllll}
\hline
Partial Autocorrelation Function \tabularnewline
Time lag k & PACF(k) & T-STAT & P-value \tabularnewline
1 & -0.314706 & -2.6518 & 0.004935 \tabularnewline
2 & -0.021374 & -0.1801 & 0.428794 \tabularnewline
3 & -0.070528 & -0.5943 & 0.277108 \tabularnewline
4 & -0.244585 & -2.0609 & 0.021488 \tabularnewline
5 & -0.188381 & -1.5873 & 0.058441 \tabularnewline
6 & 0.078306 & 0.6598 & 0.255752 \tabularnewline
7 & -0.146952 & -1.2382 & 0.109853 \tabularnewline
8 & -0.026984 & -0.2274 & 0.410394 \tabularnewline
9 & -0.038506 & -0.3245 & 0.373272 \tabularnewline
10 & 0.060095 & 0.5064 & 0.307083 \tabularnewline
11 & -0.279316 & -2.3536 & 0.010684 \tabularnewline
12 & -0.001815 & -0.0153 & 0.493922 \tabularnewline
13 & -0.165241 & -1.3923 & 0.084081 \tabularnewline
14 & -0.04806 & -0.405 & 0.343363 \tabularnewline
15 & -0.06064 & -0.511 & 0.305483 \tabularnewline
16 & -0.137955 & -1.1624 & 0.124477 \tabularnewline
17 & 0.052087 & 0.4389 & 0.331036 \tabularnewline
18 & 0.07248 & 0.6107 & 0.271665 \tabularnewline
19 & 0.110208 & 0.9286 & 0.178114 \tabularnewline
20 & 0.0177 & 0.1491 & 0.440932 \tabularnewline
21 & 0.134427 & 1.1327 & 0.130576 \tabularnewline
22 & -0.073566 & -0.6199 & 0.268662 \tabularnewline
23 & 0.173268 & 1.46 & 0.074353 \tabularnewline
24 & -0.049364 & -0.4159 & 0.339351 \tabularnewline
25 & -0.062167 & -0.5238 & 0.301014 \tabularnewline
26 & -0.016501 & -0.139 & 0.444908 \tabularnewline
27 & -0.052339 & -0.441 & 0.330269 \tabularnewline
28 & -0.128262 & -1.0808 & 0.141732 \tabularnewline
29 & 0.095098 & 0.8013 & 0.212812 \tabularnewline
30 & -0.050954 & -0.4293 & 0.334487 \tabularnewline
31 & 0.083948 & 0.7074 & 0.24083 \tabularnewline
32 & -0.027993 & -0.2359 & 0.407104 \tabularnewline
33 & -0.019762 & -0.1665 & 0.434111 \tabularnewline
34 & 0.108042 & 0.9104 & 0.182852 \tabularnewline
35 & -0.126818 & -1.0686 & 0.144437 \tabularnewline
36 & -0.010476 & -0.0883 & 0.464954 \tabularnewline
37 & -0.15275 & -1.2871 & 0.101121 \tabularnewline
38 & 0.115659 & 0.9746 & 0.166543 \tabularnewline
39 & 0.037835 & 0.3188 & 0.375406 \tabularnewline
40 & 0.002359 & 0.0199 & 0.492098 \tabularnewline
41 & -0.036541 & -0.3079 & 0.379529 \tabularnewline
42 & 0.072968 & 0.6148 & 0.270314 \tabularnewline
43 & 0.026568 & 0.2239 & 0.411753 \tabularnewline
44 & -0.071288 & -0.6007 & 0.274983 \tabularnewline
45 & 0.071417 & 0.6018 & 0.274623 \tabularnewline
46 & 0.030057 & 0.2533 & 0.400396 \tabularnewline
47 & 0.094829 & 0.799 & 0.213464 \tabularnewline
48 & -0.029677 & -0.2501 & 0.40163 \tabularnewline
49 & -0.051773 & -0.4362 & 0.331991 \tabularnewline
50 & -0.071075 & -0.5989 & 0.275578 \tabularnewline
51 & 0.063296 & 0.5333 & 0.297731 \tabularnewline
52 & -0.029104 & -0.2452 & 0.403492 \tabularnewline
53 & -0.040012 & -0.3371 & 0.368501 \tabularnewline
54 & -0.013806 & -0.1163 & 0.453859 \tabularnewline
55 & -0.04055 & -0.3417 & 0.366802 \tabularnewline
56 & -0.003489 & -0.0294 & 0.488313 \tabularnewline
57 & -0.032356 & -0.2726 & 0.392963 \tabularnewline
58 & 0.041548 & 0.3501 & 0.363655 \tabularnewline
59 & -0.090517 & -0.7627 & 0.224082 \tabularnewline
60 & -0.098512 & -0.8301 & 0.204639 \tabularnewline
\hline
\end{tabular}
%Source: https://freestatistics.org/blog/index.php?pk=71281&T=2

[TABLE]
[ROW][C]Partial Autocorrelation Function[/C][/ROW]
[ROW][C]Time lag k[/C][C]PACF(k)[/C][C]T-STAT[/C][C]P-value[/C][/ROW]
[ROW][C]1[/C][C]-0.314706[/C][C]-2.6518[/C][C]0.004935[/C][/ROW]
[ROW][C]2[/C][C]-0.021374[/C][C]-0.1801[/C][C]0.428794[/C][/ROW]
[ROW][C]3[/C][C]-0.070528[/C][C]-0.5943[/C][C]0.277108[/C][/ROW]
[ROW][C]4[/C][C]-0.244585[/C][C]-2.0609[/C][C]0.021488[/C][/ROW]
[ROW][C]5[/C][C]-0.188381[/C][C]-1.5873[/C][C]0.058441[/C][/ROW]
[ROW][C]6[/C][C]0.078306[/C][C]0.6598[/C][C]0.255752[/C][/ROW]
[ROW][C]7[/C][C]-0.146952[/C][C]-1.2382[/C][C]0.109853[/C][/ROW]
[ROW][C]8[/C][C]-0.026984[/C][C]-0.2274[/C][C]0.410394[/C][/ROW]
[ROW][C]9[/C][C]-0.038506[/C][C]-0.3245[/C][C]0.373272[/C][/ROW]
[ROW][C]10[/C][C]0.060095[/C][C]0.5064[/C][C]0.307083[/C][/ROW]
[ROW][C]11[/C][C]-0.279316[/C][C]-2.3536[/C][C]0.010684[/C][/ROW]
[ROW][C]12[/C][C]-0.001815[/C][C]-0.0153[/C][C]0.493922[/C][/ROW]
[ROW][C]13[/C][C]-0.165241[/C][C]-1.3923[/C][C]0.084081[/C][/ROW]
[ROW][C]14[/C][C]-0.04806[/C][C]-0.405[/C][C]0.343363[/C][/ROW]
[ROW][C]15[/C][C]-0.06064[/C][C]-0.511[/C][C]0.305483[/C][/ROW]
[ROW][C]16[/C][C]-0.137955[/C][C]-1.1624[/C][C]0.124477[/C][/ROW]
[ROW][C]17[/C][C]0.052087[/C][C]0.4389[/C][C]0.331036[/C][/ROW]
[ROW][C]18[/C][C]0.07248[/C][C]0.6107[/C][C]0.271665[/C][/ROW]
[ROW][C]19[/C][C]0.110208[/C][C]0.9286[/C][C]0.178114[/C][/ROW]
[ROW][C]20[/C][C]0.0177[/C][C]0.1491[/C][C]0.440932[/C][/ROW]
[ROW][C]21[/C][C]0.134427[/C][C]1.1327[/C][C]0.130576[/C][/ROW]
[ROW][C]22[/C][C]-0.073566[/C][C]-0.6199[/C][C]0.268662[/C][/ROW]
[ROW][C]23[/C][C]0.173268[/C][C]1.46[/C][C]0.074353[/C][/ROW]
[ROW][C]24[/C][C]-0.049364[/C][C]-0.4159[/C][C]0.339351[/C][/ROW]
[ROW][C]25[/C][C]-0.062167[/C][C]-0.5238[/C][C]0.301014[/C][/ROW]
[ROW][C]26[/C][C]-0.016501[/C][C]-0.139[/C][C]0.444908[/C][/ROW]
[ROW][C]27[/C][C]-0.052339[/C][C]-0.441[/C][C]0.330269[/C][/ROW]
[ROW][C]28[/C][C]-0.128262[/C][C]-1.0808[/C][C]0.141732[/C][/ROW]
[ROW][C]29[/C][C]0.095098[/C][C]0.8013[/C][C]0.212812[/C][/ROW]
[ROW][C]30[/C][C]-0.050954[/C][C]-0.4293[/C][C]0.334487[/C][/ROW]
[ROW][C]31[/C][C]0.083948[/C][C]0.7074[/C][C]0.24083[/C][/ROW]
[ROW][C]32[/C][C]-0.027993[/C][C]-0.2359[/C][C]0.407104[/C][/ROW]
[ROW][C]33[/C][C]-0.019762[/C][C]-0.1665[/C][C]0.434111[/C][/ROW]
[ROW][C]34[/C][C]0.108042[/C][C]0.9104[/C][C]0.182852[/C][/ROW]
[ROW][C]35[/C][C]-0.126818[/C][C]-1.0686[/C][C]0.144437[/C][/ROW]
[ROW][C]36[/C][C]-0.010476[/C][C]-0.0883[/C][C]0.464954[/C][/ROW]
[ROW][C]37[/C][C]-0.15275[/C][C]-1.2871[/C][C]0.101121[/C][/ROW]
[ROW][C]38[/C][C]0.115659[/C][C]0.9746[/C][C]0.166543[/C][/ROW]
[ROW][C]39[/C][C]0.037835[/C][C]0.3188[/C][C]0.375406[/C][/ROW]
[ROW][C]40[/C][C]0.002359[/C][C]0.0199[/C][C]0.492098[/C][/ROW]
[ROW][C]41[/C][C]-0.036541[/C][C]-0.3079[/C][C]0.379529[/C][/ROW]
[ROW][C]42[/C][C]0.072968[/C][C]0.6148[/C][C]0.270314[/C][/ROW]
[ROW][C]43[/C][C]0.026568[/C][C]0.2239[/C][C]0.411753[/C][/ROW]
[ROW][C]44[/C][C]-0.071288[/C][C]-0.6007[/C][C]0.274983[/C][/ROW]
[ROW][C]45[/C][C]0.071417[/C][C]0.6018[/C][C]0.274623[/C][/ROW]
[ROW][C]46[/C][C]0.030057[/C][C]0.2533[/C][C]0.400396[/C][/ROW]
[ROW][C]47[/C][C]0.094829[/C][C]0.799[/C][C]0.213464[/C][/ROW]
[ROW][C]48[/C][C]-0.029677[/C][C]-0.2501[/C][C]0.40163[/C][/ROW]
[ROW][C]49[/C][C]-0.051773[/C][C]-0.4362[/C][C]0.331991[/C][/ROW]
[ROW][C]50[/C][C]-0.071075[/C][C]-0.5989[/C][C]0.275578[/C][/ROW]
[ROW][C]51[/C][C]0.063296[/C][C]0.5333[/C][C]0.297731[/C][/ROW]
[ROW][C]52[/C][C]-0.029104[/C][C]-0.2452[/C][C]0.403492[/C][/ROW]
[ROW][C]53[/C][C]-0.040012[/C][C]-0.3371[/C][C]0.368501[/C][/ROW]
[ROW][C]54[/C][C]-0.013806[/C][C]-0.1163[/C][C]0.453859[/C][/ROW]
[ROW][C]55[/C][C]-0.04055[/C][C]-0.3417[/C][C]0.366802[/C][/ROW]
[ROW][C]56[/C][C]-0.003489[/C][C]-0.0294[/C][C]0.488313[/C][/ROW]
[ROW][C]57[/C][C]-0.032356[/C][C]-0.2726[/C][C]0.392963[/C][/ROW]
[ROW][C]58[/C][C]0.041548[/C][C]0.3501[/C][C]0.363655[/C][/ROW]
[ROW][C]59[/C][C]-0.090517[/C][C]-0.7627[/C][C]0.224082[/C][/ROW]
[ROW][C]60[/C][C]-0.098512[/C][C]-0.8301[/C][C]0.204639[/C][/ROW]
[/TABLE]
Source: https://freestatistics.org/blog/index.php?pk=71281&T=2

Globally Unique Identifier (entire table): ba.freestatistics.org/blog/index.php?pk=71281&T=2

As an alternative you can also use a QR Code:  

The GUIDs for individual cells are displayed in the table below:

Partial Autocorrelation Function
Time lag kPACF(k)T-STATP-value
1-0.314706-2.65180.004935
2-0.021374-0.18010.428794
3-0.070528-0.59430.277108
4-0.244585-2.06090.021488
5-0.188381-1.58730.058441
60.0783060.65980.255752
7-0.146952-1.23820.109853
8-0.026984-0.22740.410394
9-0.038506-0.32450.373272
100.0600950.50640.307083
11-0.279316-2.35360.010684
12-0.001815-0.01530.493922
13-0.165241-1.39230.084081
14-0.04806-0.4050.343363
15-0.06064-0.5110.305483
16-0.137955-1.16240.124477
170.0520870.43890.331036
180.072480.61070.271665
190.1102080.92860.178114
200.01770.14910.440932
210.1344271.13270.130576
22-0.073566-0.61990.268662
230.1732681.460.074353
24-0.049364-0.41590.339351
25-0.062167-0.52380.301014
26-0.016501-0.1390.444908
27-0.052339-0.4410.330269
28-0.128262-1.08080.141732
290.0950980.80130.212812
30-0.050954-0.42930.334487
310.0839480.70740.24083
32-0.027993-0.23590.407104
33-0.019762-0.16650.434111
340.1080420.91040.182852
35-0.126818-1.06860.144437
36-0.010476-0.08830.464954
37-0.15275-1.28710.101121
380.1156590.97460.166543
390.0378350.31880.375406
400.0023590.01990.492098
41-0.036541-0.30790.379529
420.0729680.61480.270314
430.0265680.22390.411753
44-0.071288-0.60070.274983
450.0714170.60180.274623
460.0300570.25330.400396
470.0948290.7990.213464
48-0.029677-0.25010.40163
49-0.051773-0.43620.331991
50-0.071075-0.59890.275578
510.0632960.53330.297731
52-0.029104-0.24520.403492
53-0.040012-0.33710.368501
54-0.013806-0.11630.453859
55-0.04055-0.34170.366802
56-0.003489-0.02940.488313
57-0.032356-0.27260.392963
580.0415480.35010.363655
59-0.090517-0.76270.224082
60-0.098512-0.83010.204639


Parameters (Session):
par1 = 60 ; par2 = 1 ; par3 = 0 ; par4 = 0 ; par5 = 12 ; par6 = White Noise ; par7 = 0.95 ;
Parameters (R input):
par1 = 60 ; par2 = 1 ; par3 = 1 ; par4 = 0 ; par5 = 12 ; par6 = White Noise ; par7 = 0.95 ;
R code (references can be found in the software module):
if (par1 == 'Default') {
par1 = 10*log10(length(x))
} else {
par1 <- as.numeric(par1)
}
par2 <- as.numeric(par2)
par3 <- as.numeric(par3)
par4 <- as.numeric(par4)
par5 <- as.numeric(par5)
if (par6 == 'White Noise') par6 <- 'white' else par6 <- 'ma'
par7 <- as.numeric(par7)
if (par2 == 0) {
x <- log(x)
} else {
x <- (x ^ par2 - 1) / par2
}
if (par3 > 0) x <- diff(x,lag=1,difference=par3)
if (par4 > 0) x <- diff(x,lag=par5,difference=par4)
bitmap(file='pic1.png')
racf <- acf(x, par1, main='Autocorrelation', xlab='time lag', ylab='ACF', ci.type=par6, ci=par7, sub=paste('(lambda=',par2,', d=',par3,', D=',par4,', CI=', par7, ', CI type=',par6,')',sep=''))
dev.off()
bitmap(file='pic2.png')
rpacf <- pacf(x,par1,main='Partial Autocorrelation',xlab='lags',ylab='PACF')
dev.off()
(myacf <- c(racf$acf))
(mypacf <- c(rpacf$acf))
lengthx <- length(x)
sqrtn <- sqrt(lengthx)
load(file='createtable')
a<-table.start()
a<-table.row.start(a)
a<-table.element(a,'Autocorrelation Function',4,TRUE)
a<-table.row.end(a)
a<-table.row.start(a)
a<-table.element(a,'Time lag k',header=TRUE)
a<-table.element(a,hyperlink('basics.htm','ACF(k)','click here for more information about the Autocorrelation Function'),header=TRUE)
a<-table.element(a,'T-STAT',header=TRUE)
a<-table.element(a,'P-value',header=TRUE)
a<-table.row.end(a)
for (i in 2:(par1+1)) {
a<-table.row.start(a)
a<-table.element(a,i-1,header=TRUE)
a<-table.element(a,round(myacf[i],6))
mytstat <- myacf[i]*sqrtn
a<-table.element(a,round(mytstat,4))
a<-table.element(a,round(1-pt(abs(mytstat),lengthx),6))
a<-table.row.end(a)
}
a<-table.end(a)
table.save(a,file='mytable.tab')
a<-table.start()
a<-table.row.start(a)
a<-table.element(a,'Partial Autocorrelation Function',4,TRUE)
a<-table.row.end(a)
a<-table.row.start(a)
a<-table.element(a,'Time lag k',header=TRUE)
a<-table.element(a,hyperlink('basics.htm','PACF(k)','click here for more information about the Partial Autocorrelation Function'),header=TRUE)
a<-table.element(a,'T-STAT',header=TRUE)
a<-table.element(a,'P-value',header=TRUE)
a<-table.row.end(a)
for (i in 1:par1) {
a<-table.row.start(a)
a<-table.element(a,i,header=TRUE)
a<-table.element(a,round(mypacf[i],6))
mytstat <- mypacf[i]*sqrtn
a<-table.element(a,round(mytstat,4))
a<-table.element(a,round(1-pt(abs(mytstat),lengthx),6))
a<-table.row.end(a)
}
a<-table.end(a)
table.save(a,file='mytable1.tab')