Free Statistics

of Irreproducible Research!

Author's title

Author*The author of this computation has been verified*
R Software Modulerwasp_autocorrelation.wasp
Title produced by software(Partial) Autocorrelation Function
Date of computationWed, 30 Dec 2009 06:48:46 -0700
Cite this page as followsStatistical Computations at FreeStatistics.org, Office for Research Development and Education, URL https://freestatistics.org/blog/index.php?v=date/2009/Dec/30/t126218100872diwcj5njnk63e.htm/, Retrieved Sun, 28 Apr 2024 21:23:54 +0000
Statistical Computations at FreeStatistics.org, Office for Research Development and Education, URL https://freestatistics.org/blog/index.php?pk=71278, Retrieved Sun, 28 Apr 2024 21:23:54 +0000
QR Codes:

Original text written by user:
IsPrivate?No (this computation is public)
User-defined keywords
Estimated Impact132
Family? (F = Feedback message, R = changed R code, M = changed R Module, P = changed Parameters, D = changed Data)
-     [Univariate Data Series] [De Belgische uitv...] [2009-10-13 01:35:54] [df6326eec97a6ca984a853b142930499]
- RMPD  [Univariate Data Series] [ws8] [2009-11-27 12:04:12] [acdebb2ecda2ddb208f4e14f4a68b9e7]
-   PD    [Univariate Data Series] [consumptiekrediet] [2009-12-04 10:09:44] [acdebb2ecda2ddb208f4e14f4a68b9e7]
-   PD      [Univariate Data Series] [Verkoopprijs per ...] [2009-12-20 19:05:51] [acdebb2ecda2ddb208f4e14f4a68b9e7]
- RMPD          [(Partial) Autocorrelation Function] [Autocorrelatiefun...] [2009-12-30 13:48:46] [b243db81ea3e1f02fb3382887fb0f701] [Current]
Feedback Forum

Post a new message
Dataseries X:
228
136
174
69
108
149
134
131
180
127
59
59
202
173
296
154
117
86
38
17
52
12
61
65
70
91
111
90
110
100
99
137
139
124
103
75
55
75
65
17
27
17
20
131
26
66
59
35
57
6
24
57
42
55
30
35
22
18
22
82
90
66
64
50
56
99
97
41
59
92
91
47


Summary of computational transaction
Raw Inputview raw input (R code)
Raw Outputview raw output of R engine
Computing time2 seconds
R Server'Gwilym Jenkins' @ 72.249.127.135

\begin{tabular}{lllllllll}
\hline
Summary of computational transaction \tabularnewline
Raw Input & view raw input (R code)  \tabularnewline
Raw Output & view raw output of R engine  \tabularnewline
Computing time & 2 seconds \tabularnewline
R Server & 'Gwilym Jenkins' @ 72.249.127.135 \tabularnewline
\hline
\end{tabular}
%Source: https://freestatistics.org/blog/index.php?pk=71278&T=0

[TABLE]
[ROW][C]Summary of computational transaction[/C][/ROW]
[ROW][C]Raw Input[/C][C]view raw input (R code) [/C][/ROW]
[ROW][C]Raw Output[/C][C]view raw output of R engine [/C][/ROW]
[ROW][C]Computing time[/C][C]2 seconds[/C][/ROW]
[ROW][C]R Server[/C][C]'Gwilym Jenkins' @ 72.249.127.135[/C][/ROW]
[/TABLE]
Source: https://freestatistics.org/blog/index.php?pk=71278&T=0

Globally Unique Identifier (entire table): ba.freestatistics.org/blog/index.php?pk=71278&T=0

As an alternative you can also use a QR Code:  

The GUIDs for individual cells are displayed in the table below:

Summary of computational transaction
Raw Inputview raw input (R code)
Raw Outputview raw output of R engine
Computing time2 seconds
R Server'Gwilym Jenkins' @ 72.249.127.135


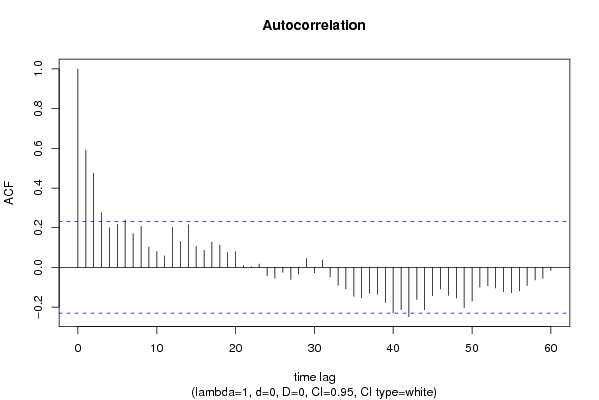
Autocorrelation Function
Time lag kACF(k)T-STATP-value
10.5909055.0142e-06
20.474844.02926.9e-05
30.2754292.33710.01111
40.1999171.69640.047069
50.2179221.84910.034272
60.2381872.02110.023495
70.1704381.44620.076229
80.2065841.75290.041936
90.1021420.86670.194492
100.0805480.68350.248251
110.0575180.48810.313496
120.2018141.71240.045559
130.1307231.10920.135514
140.2151141.82530.036052
150.1052660.89320.187361
160.0857450.72760.234619
170.1268761.07660.142632
180.111710.94790.173178
190.0750730.6370.263068
200.0791130.67130.252091
210.0093070.0790.468636
220.003090.02620.489577
230.0166790.14150.443925
24-0.042699-0.36230.359091
25-0.05435-0.46120.323033
26-0.025135-0.21330.415856
27-0.060938-0.51710.303345
28-0.033352-0.2830.388995
290.0453290.38460.350824
30-0.026627-0.22590.410945
310.0371680.31540.376693
32-0.048387-0.41060.341302
33-0.090134-0.76480.223441
34-0.108183-0.9180.180851
35-0.146049-1.23930.109635
36-0.15334-1.30110.098681
37-0.1313-1.11410.134467
38-0.135887-1.1530.126354
39-0.177561-1.50670.068137
40-0.229377-1.94630.027759
41-0.213855-1.81460.036874
42-0.248348-2.10730.019288
43-0.16145-1.36990.08748
44-0.21375-1.81370.036943
45-0.143365-1.21650.113884
46-0.108469-0.92040.180222
47-0.141254-1.19860.11731
48-0.154861-1.3140.096502
49-0.202359-1.71710.045133
50-0.169513-1.43840.077332
51-0.099596-0.84510.200428
52-0.09262-0.78590.217251
53-0.103804-0.88080.190677
54-0.122614-1.04040.150815
55-0.128316-1.08880.139936
56-0.118374-1.00440.159267
57-0.091189-0.77380.220802
58-0.063634-0.540.295447
59-0.055694-0.47260.318971
60-0.015393-0.13060.448224

\begin{tabular}{lllllllll}
\hline
Autocorrelation Function \tabularnewline
Time lag k & ACF(k) & T-STAT & P-value \tabularnewline
1 & 0.590905 & 5.014 & 2e-06 \tabularnewline
2 & 0.47484 & 4.0292 & 6.9e-05 \tabularnewline
3 & 0.275429 & 2.3371 & 0.01111 \tabularnewline
4 & 0.199917 & 1.6964 & 0.047069 \tabularnewline
5 & 0.217922 & 1.8491 & 0.034272 \tabularnewline
6 & 0.238187 & 2.0211 & 0.023495 \tabularnewline
7 & 0.170438 & 1.4462 & 0.076229 \tabularnewline
8 & 0.206584 & 1.7529 & 0.041936 \tabularnewline
9 & 0.102142 & 0.8667 & 0.194492 \tabularnewline
10 & 0.080548 & 0.6835 & 0.248251 \tabularnewline
11 & 0.057518 & 0.4881 & 0.313496 \tabularnewline
12 & 0.201814 & 1.7124 & 0.045559 \tabularnewline
13 & 0.130723 & 1.1092 & 0.135514 \tabularnewline
14 & 0.215114 & 1.8253 & 0.036052 \tabularnewline
15 & 0.105266 & 0.8932 & 0.187361 \tabularnewline
16 & 0.085745 & 0.7276 & 0.234619 \tabularnewline
17 & 0.126876 & 1.0766 & 0.142632 \tabularnewline
18 & 0.11171 & 0.9479 & 0.173178 \tabularnewline
19 & 0.075073 & 0.637 & 0.263068 \tabularnewline
20 & 0.079113 & 0.6713 & 0.252091 \tabularnewline
21 & 0.009307 & 0.079 & 0.468636 \tabularnewline
22 & 0.00309 & 0.0262 & 0.489577 \tabularnewline
23 & 0.016679 & 0.1415 & 0.443925 \tabularnewline
24 & -0.042699 & -0.3623 & 0.359091 \tabularnewline
25 & -0.05435 & -0.4612 & 0.323033 \tabularnewline
26 & -0.025135 & -0.2133 & 0.415856 \tabularnewline
27 & -0.060938 & -0.5171 & 0.303345 \tabularnewline
28 & -0.033352 & -0.283 & 0.388995 \tabularnewline
29 & 0.045329 & 0.3846 & 0.350824 \tabularnewline
30 & -0.026627 & -0.2259 & 0.410945 \tabularnewline
31 & 0.037168 & 0.3154 & 0.376693 \tabularnewline
32 & -0.048387 & -0.4106 & 0.341302 \tabularnewline
33 & -0.090134 & -0.7648 & 0.223441 \tabularnewline
34 & -0.108183 & -0.918 & 0.180851 \tabularnewline
35 & -0.146049 & -1.2393 & 0.109635 \tabularnewline
36 & -0.15334 & -1.3011 & 0.098681 \tabularnewline
37 & -0.1313 & -1.1141 & 0.134467 \tabularnewline
38 & -0.135887 & -1.153 & 0.126354 \tabularnewline
39 & -0.177561 & -1.5067 & 0.068137 \tabularnewline
40 & -0.229377 & -1.9463 & 0.027759 \tabularnewline
41 & -0.213855 & -1.8146 & 0.036874 \tabularnewline
42 & -0.248348 & -2.1073 & 0.019288 \tabularnewline
43 & -0.16145 & -1.3699 & 0.08748 \tabularnewline
44 & -0.21375 & -1.8137 & 0.036943 \tabularnewline
45 & -0.143365 & -1.2165 & 0.113884 \tabularnewline
46 & -0.108469 & -0.9204 & 0.180222 \tabularnewline
47 & -0.141254 & -1.1986 & 0.11731 \tabularnewline
48 & -0.154861 & -1.314 & 0.096502 \tabularnewline
49 & -0.202359 & -1.7171 & 0.045133 \tabularnewline
50 & -0.169513 & -1.4384 & 0.077332 \tabularnewline
51 & -0.099596 & -0.8451 & 0.200428 \tabularnewline
52 & -0.09262 & -0.7859 & 0.217251 \tabularnewline
53 & -0.103804 & -0.8808 & 0.190677 \tabularnewline
54 & -0.122614 & -1.0404 & 0.150815 \tabularnewline
55 & -0.128316 & -1.0888 & 0.139936 \tabularnewline
56 & -0.118374 & -1.0044 & 0.159267 \tabularnewline
57 & -0.091189 & -0.7738 & 0.220802 \tabularnewline
58 & -0.063634 & -0.54 & 0.295447 \tabularnewline
59 & -0.055694 & -0.4726 & 0.318971 \tabularnewline
60 & -0.015393 & -0.1306 & 0.448224 \tabularnewline
\hline
\end{tabular}
%Source: https://freestatistics.org/blog/index.php?pk=71278&T=1

[TABLE]
[ROW][C]Autocorrelation Function[/C][/ROW]
[ROW][C]Time lag k[/C][C]ACF(k)[/C][C]T-STAT[/C][C]P-value[/C][/ROW]
[ROW][C]1[/C][C]0.590905[/C][C]5.014[/C][C]2e-06[/C][/ROW]
[ROW][C]2[/C][C]0.47484[/C][C]4.0292[/C][C]6.9e-05[/C][/ROW]
[ROW][C]3[/C][C]0.275429[/C][C]2.3371[/C][C]0.01111[/C][/ROW]
[ROW][C]4[/C][C]0.199917[/C][C]1.6964[/C][C]0.047069[/C][/ROW]
[ROW][C]5[/C][C]0.217922[/C][C]1.8491[/C][C]0.034272[/C][/ROW]
[ROW][C]6[/C][C]0.238187[/C][C]2.0211[/C][C]0.023495[/C][/ROW]
[ROW][C]7[/C][C]0.170438[/C][C]1.4462[/C][C]0.076229[/C][/ROW]
[ROW][C]8[/C][C]0.206584[/C][C]1.7529[/C][C]0.041936[/C][/ROW]
[ROW][C]9[/C][C]0.102142[/C][C]0.8667[/C][C]0.194492[/C][/ROW]
[ROW][C]10[/C][C]0.080548[/C][C]0.6835[/C][C]0.248251[/C][/ROW]
[ROW][C]11[/C][C]0.057518[/C][C]0.4881[/C][C]0.313496[/C][/ROW]
[ROW][C]12[/C][C]0.201814[/C][C]1.7124[/C][C]0.045559[/C][/ROW]
[ROW][C]13[/C][C]0.130723[/C][C]1.1092[/C][C]0.135514[/C][/ROW]
[ROW][C]14[/C][C]0.215114[/C][C]1.8253[/C][C]0.036052[/C][/ROW]
[ROW][C]15[/C][C]0.105266[/C][C]0.8932[/C][C]0.187361[/C][/ROW]
[ROW][C]16[/C][C]0.085745[/C][C]0.7276[/C][C]0.234619[/C][/ROW]
[ROW][C]17[/C][C]0.126876[/C][C]1.0766[/C][C]0.142632[/C][/ROW]
[ROW][C]18[/C][C]0.11171[/C][C]0.9479[/C][C]0.173178[/C][/ROW]
[ROW][C]19[/C][C]0.075073[/C][C]0.637[/C][C]0.263068[/C][/ROW]
[ROW][C]20[/C][C]0.079113[/C][C]0.6713[/C][C]0.252091[/C][/ROW]
[ROW][C]21[/C][C]0.009307[/C][C]0.079[/C][C]0.468636[/C][/ROW]
[ROW][C]22[/C][C]0.00309[/C][C]0.0262[/C][C]0.489577[/C][/ROW]
[ROW][C]23[/C][C]0.016679[/C][C]0.1415[/C][C]0.443925[/C][/ROW]
[ROW][C]24[/C][C]-0.042699[/C][C]-0.3623[/C][C]0.359091[/C][/ROW]
[ROW][C]25[/C][C]-0.05435[/C][C]-0.4612[/C][C]0.323033[/C][/ROW]
[ROW][C]26[/C][C]-0.025135[/C][C]-0.2133[/C][C]0.415856[/C][/ROW]
[ROW][C]27[/C][C]-0.060938[/C][C]-0.5171[/C][C]0.303345[/C][/ROW]
[ROW][C]28[/C][C]-0.033352[/C][C]-0.283[/C][C]0.388995[/C][/ROW]
[ROW][C]29[/C][C]0.045329[/C][C]0.3846[/C][C]0.350824[/C][/ROW]
[ROW][C]30[/C][C]-0.026627[/C][C]-0.2259[/C][C]0.410945[/C][/ROW]
[ROW][C]31[/C][C]0.037168[/C][C]0.3154[/C][C]0.376693[/C][/ROW]
[ROW][C]32[/C][C]-0.048387[/C][C]-0.4106[/C][C]0.341302[/C][/ROW]
[ROW][C]33[/C][C]-0.090134[/C][C]-0.7648[/C][C]0.223441[/C][/ROW]
[ROW][C]34[/C][C]-0.108183[/C][C]-0.918[/C][C]0.180851[/C][/ROW]
[ROW][C]35[/C][C]-0.146049[/C][C]-1.2393[/C][C]0.109635[/C][/ROW]
[ROW][C]36[/C][C]-0.15334[/C][C]-1.3011[/C][C]0.098681[/C][/ROW]
[ROW][C]37[/C][C]-0.1313[/C][C]-1.1141[/C][C]0.134467[/C][/ROW]
[ROW][C]38[/C][C]-0.135887[/C][C]-1.153[/C][C]0.126354[/C][/ROW]
[ROW][C]39[/C][C]-0.177561[/C][C]-1.5067[/C][C]0.068137[/C][/ROW]
[ROW][C]40[/C][C]-0.229377[/C][C]-1.9463[/C][C]0.027759[/C][/ROW]
[ROW][C]41[/C][C]-0.213855[/C][C]-1.8146[/C][C]0.036874[/C][/ROW]
[ROW][C]42[/C][C]-0.248348[/C][C]-2.1073[/C][C]0.019288[/C][/ROW]
[ROW][C]43[/C][C]-0.16145[/C][C]-1.3699[/C][C]0.08748[/C][/ROW]
[ROW][C]44[/C][C]-0.21375[/C][C]-1.8137[/C][C]0.036943[/C][/ROW]
[ROW][C]45[/C][C]-0.143365[/C][C]-1.2165[/C][C]0.113884[/C][/ROW]
[ROW][C]46[/C][C]-0.108469[/C][C]-0.9204[/C][C]0.180222[/C][/ROW]
[ROW][C]47[/C][C]-0.141254[/C][C]-1.1986[/C][C]0.11731[/C][/ROW]
[ROW][C]48[/C][C]-0.154861[/C][C]-1.314[/C][C]0.096502[/C][/ROW]
[ROW][C]49[/C][C]-0.202359[/C][C]-1.7171[/C][C]0.045133[/C][/ROW]
[ROW][C]50[/C][C]-0.169513[/C][C]-1.4384[/C][C]0.077332[/C][/ROW]
[ROW][C]51[/C][C]-0.099596[/C][C]-0.8451[/C][C]0.200428[/C][/ROW]
[ROW][C]52[/C][C]-0.09262[/C][C]-0.7859[/C][C]0.217251[/C][/ROW]
[ROW][C]53[/C][C]-0.103804[/C][C]-0.8808[/C][C]0.190677[/C][/ROW]
[ROW][C]54[/C][C]-0.122614[/C][C]-1.0404[/C][C]0.150815[/C][/ROW]
[ROW][C]55[/C][C]-0.128316[/C][C]-1.0888[/C][C]0.139936[/C][/ROW]
[ROW][C]56[/C][C]-0.118374[/C][C]-1.0044[/C][C]0.159267[/C][/ROW]
[ROW][C]57[/C][C]-0.091189[/C][C]-0.7738[/C][C]0.220802[/C][/ROW]
[ROW][C]58[/C][C]-0.063634[/C][C]-0.54[/C][C]0.295447[/C][/ROW]
[ROW][C]59[/C][C]-0.055694[/C][C]-0.4726[/C][C]0.318971[/C][/ROW]
[ROW][C]60[/C][C]-0.015393[/C][C]-0.1306[/C][C]0.448224[/C][/ROW]
[/TABLE]
Source: https://freestatistics.org/blog/index.php?pk=71278&T=1

Globally Unique Identifier (entire table): ba.freestatistics.org/blog/index.php?pk=71278&T=1

As an alternative you can also use a QR Code:  

The GUIDs for individual cells are displayed in the table below:

Autocorrelation Function
Time lag kACF(k)T-STATP-value
10.5909055.0142e-06
20.474844.02926.9e-05
30.2754292.33710.01111
40.1999171.69640.047069
50.2179221.84910.034272
60.2381872.02110.023495
70.1704381.44620.076229
80.2065841.75290.041936
90.1021420.86670.194492
100.0805480.68350.248251
110.0575180.48810.313496
120.2018141.71240.045559
130.1307231.10920.135514
140.2151141.82530.036052
150.1052660.89320.187361
160.0857450.72760.234619
170.1268761.07660.142632
180.111710.94790.173178
190.0750730.6370.263068
200.0791130.67130.252091
210.0093070.0790.468636
220.003090.02620.489577
230.0166790.14150.443925
24-0.042699-0.36230.359091
25-0.05435-0.46120.323033
26-0.025135-0.21330.415856
27-0.060938-0.51710.303345
28-0.033352-0.2830.388995
290.0453290.38460.350824
30-0.026627-0.22590.410945
310.0371680.31540.376693
32-0.048387-0.41060.341302
33-0.090134-0.76480.223441
34-0.108183-0.9180.180851
35-0.146049-1.23930.109635
36-0.15334-1.30110.098681
37-0.1313-1.11410.134467
38-0.135887-1.1530.126354
39-0.177561-1.50670.068137
40-0.229377-1.94630.027759
41-0.213855-1.81460.036874
42-0.248348-2.10730.019288
43-0.16145-1.36990.08748
44-0.21375-1.81370.036943
45-0.143365-1.21650.113884
46-0.108469-0.92040.180222
47-0.141254-1.19860.11731
48-0.154861-1.3140.096502
49-0.202359-1.71710.045133
50-0.169513-1.43840.077332
51-0.099596-0.84510.200428
52-0.09262-0.78590.217251
53-0.103804-0.88080.190677
54-0.122614-1.04040.150815
55-0.128316-1.08880.139936
56-0.118374-1.00440.159267
57-0.091189-0.77380.220802
58-0.063634-0.540.295447
59-0.055694-0.47260.318971
60-0.015393-0.13060.448224


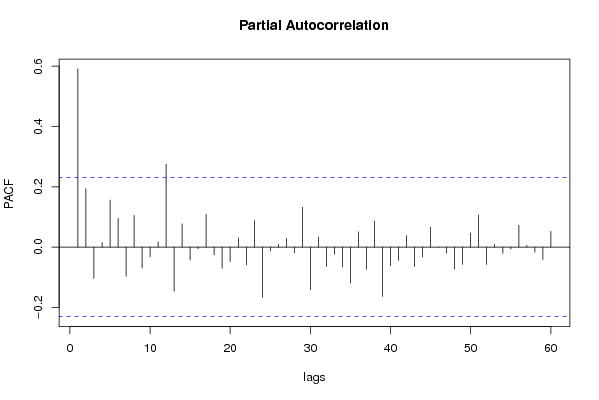
Partial Autocorrelation Function
Time lag kPACF(k)T-STATP-value
10.5909055.0142e-06
20.1930941.63850.052845
3-0.103864-0.88130.19054
40.0149030.12650.449861
50.1557011.32120.095315
60.0950950.80690.211189
7-0.097193-0.82470.206129
80.1049510.89050.188072
9-0.069441-0.58920.278776
10-0.032673-0.27720.391196
110.0164110.13930.444819
120.2744282.32860.011346
13-0.146161-1.24020.109461
140.0770780.6540.257588
15-0.042885-0.36390.358502
16-0.005629-0.04780.481017
170.1078780.91540.181524
18-0.025972-0.22040.413098
19-0.070636-0.59940.275406
20-0.047956-0.40690.342637
210.030180.25610.399308
22-0.058804-0.4990.309662
230.0882140.74850.228293
24-0.167331-1.41980.079984
25-0.012932-0.10970.456463
260.0088730.07530.470095
270.0286660.24320.404255
28-0.019078-0.16190.435926
290.131921.11940.13335
30-0.14163-1.20180.116696
310.0325560.27630.391574
32-0.064177-0.54460.293868
33-0.023652-0.20070.420752
34-0.065645-0.5570.289622
35-0.119731-1.0160.156527
360.0503440.42720.335261
37-0.073772-0.6260.266655
380.0860340.730.233872
39-0.163854-1.39030.084353
40-0.061963-0.52580.30033
41-0.044617-0.37860.353054
420.0381760.32390.373465
43-0.064858-0.55030.291897
44-0.032772-0.27810.390873
450.0659420.55950.288767
46-0.000372-0.00320.498746
47-0.020195-0.17140.432211
48-0.072951-0.6190.268932
49-0.057433-0.48730.313752
500.0469360.39830.345808
510.1063820.90270.184852
52-0.05795-0.49170.312207
530.0089750.07620.469752
54-0.020918-0.17750.42981
55-0.00687-0.05830.476837
560.072460.61480.270299
570.0051340.04360.482687
58-0.016987-0.14410.442895
59-0.041515-0.35230.362833
600.051960.44090.330306

\begin{tabular}{lllllllll}
\hline
Partial Autocorrelation Function \tabularnewline
Time lag k & PACF(k) & T-STAT & P-value \tabularnewline
1 & 0.590905 & 5.014 & 2e-06 \tabularnewline
2 & 0.193094 & 1.6385 & 0.052845 \tabularnewline
3 & -0.103864 & -0.8813 & 0.19054 \tabularnewline
4 & 0.014903 & 0.1265 & 0.449861 \tabularnewline
5 & 0.155701 & 1.3212 & 0.095315 \tabularnewline
6 & 0.095095 & 0.8069 & 0.211189 \tabularnewline
7 & -0.097193 & -0.8247 & 0.206129 \tabularnewline
8 & 0.104951 & 0.8905 & 0.188072 \tabularnewline
9 & -0.069441 & -0.5892 & 0.278776 \tabularnewline
10 & -0.032673 & -0.2772 & 0.391196 \tabularnewline
11 & 0.016411 & 0.1393 & 0.444819 \tabularnewline
12 & 0.274428 & 2.3286 & 0.011346 \tabularnewline
13 & -0.146161 & -1.2402 & 0.109461 \tabularnewline
14 & 0.077078 & 0.654 & 0.257588 \tabularnewline
15 & -0.042885 & -0.3639 & 0.358502 \tabularnewline
16 & -0.005629 & -0.0478 & 0.481017 \tabularnewline
17 & 0.107878 & 0.9154 & 0.181524 \tabularnewline
18 & -0.025972 & -0.2204 & 0.413098 \tabularnewline
19 & -0.070636 & -0.5994 & 0.275406 \tabularnewline
20 & -0.047956 & -0.4069 & 0.342637 \tabularnewline
21 & 0.03018 & 0.2561 & 0.399308 \tabularnewline
22 & -0.058804 & -0.499 & 0.309662 \tabularnewline
23 & 0.088214 & 0.7485 & 0.228293 \tabularnewline
24 & -0.167331 & -1.4198 & 0.079984 \tabularnewline
25 & -0.012932 & -0.1097 & 0.456463 \tabularnewline
26 & 0.008873 & 0.0753 & 0.470095 \tabularnewline
27 & 0.028666 & 0.2432 & 0.404255 \tabularnewline
28 & -0.019078 & -0.1619 & 0.435926 \tabularnewline
29 & 0.13192 & 1.1194 & 0.13335 \tabularnewline
30 & -0.14163 & -1.2018 & 0.116696 \tabularnewline
31 & 0.032556 & 0.2763 & 0.391574 \tabularnewline
32 & -0.064177 & -0.5446 & 0.293868 \tabularnewline
33 & -0.023652 & -0.2007 & 0.420752 \tabularnewline
34 & -0.065645 & -0.557 & 0.289622 \tabularnewline
35 & -0.119731 & -1.016 & 0.156527 \tabularnewline
36 & 0.050344 & 0.4272 & 0.335261 \tabularnewline
37 & -0.073772 & -0.626 & 0.266655 \tabularnewline
38 & 0.086034 & 0.73 & 0.233872 \tabularnewline
39 & -0.163854 & -1.3903 & 0.084353 \tabularnewline
40 & -0.061963 & -0.5258 & 0.30033 \tabularnewline
41 & -0.044617 & -0.3786 & 0.353054 \tabularnewline
42 & 0.038176 & 0.3239 & 0.373465 \tabularnewline
43 & -0.064858 & -0.5503 & 0.291897 \tabularnewline
44 & -0.032772 & -0.2781 & 0.390873 \tabularnewline
45 & 0.065942 & 0.5595 & 0.288767 \tabularnewline
46 & -0.000372 & -0.0032 & 0.498746 \tabularnewline
47 & -0.020195 & -0.1714 & 0.432211 \tabularnewline
48 & -0.072951 & -0.619 & 0.268932 \tabularnewline
49 & -0.057433 & -0.4873 & 0.313752 \tabularnewline
50 & 0.046936 & 0.3983 & 0.345808 \tabularnewline
51 & 0.106382 & 0.9027 & 0.184852 \tabularnewline
52 & -0.05795 & -0.4917 & 0.312207 \tabularnewline
53 & 0.008975 & 0.0762 & 0.469752 \tabularnewline
54 & -0.020918 & -0.1775 & 0.42981 \tabularnewline
55 & -0.00687 & -0.0583 & 0.476837 \tabularnewline
56 & 0.07246 & 0.6148 & 0.270299 \tabularnewline
57 & 0.005134 & 0.0436 & 0.482687 \tabularnewline
58 & -0.016987 & -0.1441 & 0.442895 \tabularnewline
59 & -0.041515 & -0.3523 & 0.362833 \tabularnewline
60 & 0.05196 & 0.4409 & 0.330306 \tabularnewline
\hline
\end{tabular}
%Source: https://freestatistics.org/blog/index.php?pk=71278&T=2

[TABLE]
[ROW][C]Partial Autocorrelation Function[/C][/ROW]
[ROW][C]Time lag k[/C][C]PACF(k)[/C][C]T-STAT[/C][C]P-value[/C][/ROW]
[ROW][C]1[/C][C]0.590905[/C][C]5.014[/C][C]2e-06[/C][/ROW]
[ROW][C]2[/C][C]0.193094[/C][C]1.6385[/C][C]0.052845[/C][/ROW]
[ROW][C]3[/C][C]-0.103864[/C][C]-0.8813[/C][C]0.19054[/C][/ROW]
[ROW][C]4[/C][C]0.014903[/C][C]0.1265[/C][C]0.449861[/C][/ROW]
[ROW][C]5[/C][C]0.155701[/C][C]1.3212[/C][C]0.095315[/C][/ROW]
[ROW][C]6[/C][C]0.095095[/C][C]0.8069[/C][C]0.211189[/C][/ROW]
[ROW][C]7[/C][C]-0.097193[/C][C]-0.8247[/C][C]0.206129[/C][/ROW]
[ROW][C]8[/C][C]0.104951[/C][C]0.8905[/C][C]0.188072[/C][/ROW]
[ROW][C]9[/C][C]-0.069441[/C][C]-0.5892[/C][C]0.278776[/C][/ROW]
[ROW][C]10[/C][C]-0.032673[/C][C]-0.2772[/C][C]0.391196[/C][/ROW]
[ROW][C]11[/C][C]0.016411[/C][C]0.1393[/C][C]0.444819[/C][/ROW]
[ROW][C]12[/C][C]0.274428[/C][C]2.3286[/C][C]0.011346[/C][/ROW]
[ROW][C]13[/C][C]-0.146161[/C][C]-1.2402[/C][C]0.109461[/C][/ROW]
[ROW][C]14[/C][C]0.077078[/C][C]0.654[/C][C]0.257588[/C][/ROW]
[ROW][C]15[/C][C]-0.042885[/C][C]-0.3639[/C][C]0.358502[/C][/ROW]
[ROW][C]16[/C][C]-0.005629[/C][C]-0.0478[/C][C]0.481017[/C][/ROW]
[ROW][C]17[/C][C]0.107878[/C][C]0.9154[/C][C]0.181524[/C][/ROW]
[ROW][C]18[/C][C]-0.025972[/C][C]-0.2204[/C][C]0.413098[/C][/ROW]
[ROW][C]19[/C][C]-0.070636[/C][C]-0.5994[/C][C]0.275406[/C][/ROW]
[ROW][C]20[/C][C]-0.047956[/C][C]-0.4069[/C][C]0.342637[/C][/ROW]
[ROW][C]21[/C][C]0.03018[/C][C]0.2561[/C][C]0.399308[/C][/ROW]
[ROW][C]22[/C][C]-0.058804[/C][C]-0.499[/C][C]0.309662[/C][/ROW]
[ROW][C]23[/C][C]0.088214[/C][C]0.7485[/C][C]0.228293[/C][/ROW]
[ROW][C]24[/C][C]-0.167331[/C][C]-1.4198[/C][C]0.079984[/C][/ROW]
[ROW][C]25[/C][C]-0.012932[/C][C]-0.1097[/C][C]0.456463[/C][/ROW]
[ROW][C]26[/C][C]0.008873[/C][C]0.0753[/C][C]0.470095[/C][/ROW]
[ROW][C]27[/C][C]0.028666[/C][C]0.2432[/C][C]0.404255[/C][/ROW]
[ROW][C]28[/C][C]-0.019078[/C][C]-0.1619[/C][C]0.435926[/C][/ROW]
[ROW][C]29[/C][C]0.13192[/C][C]1.1194[/C][C]0.13335[/C][/ROW]
[ROW][C]30[/C][C]-0.14163[/C][C]-1.2018[/C][C]0.116696[/C][/ROW]
[ROW][C]31[/C][C]0.032556[/C][C]0.2763[/C][C]0.391574[/C][/ROW]
[ROW][C]32[/C][C]-0.064177[/C][C]-0.5446[/C][C]0.293868[/C][/ROW]
[ROW][C]33[/C][C]-0.023652[/C][C]-0.2007[/C][C]0.420752[/C][/ROW]
[ROW][C]34[/C][C]-0.065645[/C][C]-0.557[/C][C]0.289622[/C][/ROW]
[ROW][C]35[/C][C]-0.119731[/C][C]-1.016[/C][C]0.156527[/C][/ROW]
[ROW][C]36[/C][C]0.050344[/C][C]0.4272[/C][C]0.335261[/C][/ROW]
[ROW][C]37[/C][C]-0.073772[/C][C]-0.626[/C][C]0.266655[/C][/ROW]
[ROW][C]38[/C][C]0.086034[/C][C]0.73[/C][C]0.233872[/C][/ROW]
[ROW][C]39[/C][C]-0.163854[/C][C]-1.3903[/C][C]0.084353[/C][/ROW]
[ROW][C]40[/C][C]-0.061963[/C][C]-0.5258[/C][C]0.30033[/C][/ROW]
[ROW][C]41[/C][C]-0.044617[/C][C]-0.3786[/C][C]0.353054[/C][/ROW]
[ROW][C]42[/C][C]0.038176[/C][C]0.3239[/C][C]0.373465[/C][/ROW]
[ROW][C]43[/C][C]-0.064858[/C][C]-0.5503[/C][C]0.291897[/C][/ROW]
[ROW][C]44[/C][C]-0.032772[/C][C]-0.2781[/C][C]0.390873[/C][/ROW]
[ROW][C]45[/C][C]0.065942[/C][C]0.5595[/C][C]0.288767[/C][/ROW]
[ROW][C]46[/C][C]-0.000372[/C][C]-0.0032[/C][C]0.498746[/C][/ROW]
[ROW][C]47[/C][C]-0.020195[/C][C]-0.1714[/C][C]0.432211[/C][/ROW]
[ROW][C]48[/C][C]-0.072951[/C][C]-0.619[/C][C]0.268932[/C][/ROW]
[ROW][C]49[/C][C]-0.057433[/C][C]-0.4873[/C][C]0.313752[/C][/ROW]
[ROW][C]50[/C][C]0.046936[/C][C]0.3983[/C][C]0.345808[/C][/ROW]
[ROW][C]51[/C][C]0.106382[/C][C]0.9027[/C][C]0.184852[/C][/ROW]
[ROW][C]52[/C][C]-0.05795[/C][C]-0.4917[/C][C]0.312207[/C][/ROW]
[ROW][C]53[/C][C]0.008975[/C][C]0.0762[/C][C]0.469752[/C][/ROW]
[ROW][C]54[/C][C]-0.020918[/C][C]-0.1775[/C][C]0.42981[/C][/ROW]
[ROW][C]55[/C][C]-0.00687[/C][C]-0.0583[/C][C]0.476837[/C][/ROW]
[ROW][C]56[/C][C]0.07246[/C][C]0.6148[/C][C]0.270299[/C][/ROW]
[ROW][C]57[/C][C]0.005134[/C][C]0.0436[/C][C]0.482687[/C][/ROW]
[ROW][C]58[/C][C]-0.016987[/C][C]-0.1441[/C][C]0.442895[/C][/ROW]
[ROW][C]59[/C][C]-0.041515[/C][C]-0.3523[/C][C]0.362833[/C][/ROW]
[ROW][C]60[/C][C]0.05196[/C][C]0.4409[/C][C]0.330306[/C][/ROW]
[/TABLE]
Source: https://freestatistics.org/blog/index.php?pk=71278&T=2

Globally Unique Identifier (entire table): ba.freestatistics.org/blog/index.php?pk=71278&T=2

As an alternative you can also use a QR Code:  

The GUIDs for individual cells are displayed in the table below:

Partial Autocorrelation Function
Time lag kPACF(k)T-STATP-value
10.5909055.0142e-06
20.1930941.63850.052845
3-0.103864-0.88130.19054
40.0149030.12650.449861
50.1557011.32120.095315
60.0950950.80690.211189
7-0.097193-0.82470.206129
80.1049510.89050.188072
9-0.069441-0.58920.278776
10-0.032673-0.27720.391196
110.0164110.13930.444819
120.2744282.32860.011346
13-0.146161-1.24020.109461
140.0770780.6540.257588
15-0.042885-0.36390.358502
16-0.005629-0.04780.481017
170.1078780.91540.181524
18-0.025972-0.22040.413098
19-0.070636-0.59940.275406
20-0.047956-0.40690.342637
210.030180.25610.399308
22-0.058804-0.4990.309662
230.0882140.74850.228293
24-0.167331-1.41980.079984
25-0.012932-0.10970.456463
260.0088730.07530.470095
270.0286660.24320.404255
28-0.019078-0.16190.435926
290.131921.11940.13335
30-0.14163-1.20180.116696
310.0325560.27630.391574
32-0.064177-0.54460.293868
33-0.023652-0.20070.420752
34-0.065645-0.5570.289622
35-0.119731-1.0160.156527
360.0503440.42720.335261
37-0.073772-0.6260.266655
380.0860340.730.233872
39-0.163854-1.39030.084353
40-0.061963-0.52580.30033
41-0.044617-0.37860.353054
420.0381760.32390.373465
43-0.064858-0.55030.291897
44-0.032772-0.27810.390873
450.0659420.55950.288767
46-0.000372-0.00320.498746
47-0.020195-0.17140.432211
48-0.072951-0.6190.268932
49-0.057433-0.48730.313752
500.0469360.39830.345808
510.1063820.90270.184852
52-0.05795-0.49170.312207
530.0089750.07620.469752
54-0.020918-0.17750.42981
55-0.00687-0.05830.476837
560.072460.61480.270299
570.0051340.04360.482687
58-0.016987-0.14410.442895
59-0.041515-0.35230.362833
600.051960.44090.330306


Parameters (Session):
par1 = 60 ; par2 = 1 ; par3 = 0 ; par4 = 0 ; par5 = 12 ; par6 = White Noise ; par7 = 0.95 ;
Parameters (R input):
par1 = 60 ; par2 = 1 ; par3 = 0 ; par4 = 0 ; par5 = 12 ; par6 = White Noise ; par7 = 0.95 ;
R code (references can be found in the software module):
if (par1 == 'Default') {
par1 = 10*log10(length(x))
} else {
par1 <- as.numeric(par1)
}
par2 <- as.numeric(par2)
par3 <- as.numeric(par3)
par4 <- as.numeric(par4)
par5 <- as.numeric(par5)
if (par6 == 'White Noise') par6 <- 'white' else par6 <- 'ma'
par7 <- as.numeric(par7)
if (par2 == 0) {
x <- log(x)
} else {
x <- (x ^ par2 - 1) / par2
}
if (par3 > 0) x <- diff(x,lag=1,difference=par3)
if (par4 > 0) x <- diff(x,lag=par5,difference=par4)
bitmap(file='pic1.png')
racf <- acf(x, par1, main='Autocorrelation', xlab='time lag', ylab='ACF', ci.type=par6, ci=par7, sub=paste('(lambda=',par2,', d=',par3,', D=',par4,', CI=', par7, ', CI type=',par6,')',sep=''))
dev.off()
bitmap(file='pic2.png')
rpacf <- pacf(x,par1,main='Partial Autocorrelation',xlab='lags',ylab='PACF')
dev.off()
(myacf <- c(racf$acf))
(mypacf <- c(rpacf$acf))
lengthx <- length(x)
sqrtn <- sqrt(lengthx)
load(file='createtable')
a<-table.start()
a<-table.row.start(a)
a<-table.element(a,'Autocorrelation Function',4,TRUE)
a<-table.row.end(a)
a<-table.row.start(a)
a<-table.element(a,'Time lag k',header=TRUE)
a<-table.element(a,hyperlink('basics.htm','ACF(k)','click here for more information about the Autocorrelation Function'),header=TRUE)
a<-table.element(a,'T-STAT',header=TRUE)
a<-table.element(a,'P-value',header=TRUE)
a<-table.row.end(a)
for (i in 2:(par1+1)) {
a<-table.row.start(a)
a<-table.element(a,i-1,header=TRUE)
a<-table.element(a,round(myacf[i],6))
mytstat <- myacf[i]*sqrtn
a<-table.element(a,round(mytstat,4))
a<-table.element(a,round(1-pt(abs(mytstat),lengthx),6))
a<-table.row.end(a)
}
a<-table.end(a)
table.save(a,file='mytable.tab')
a<-table.start()
a<-table.row.start(a)
a<-table.element(a,'Partial Autocorrelation Function',4,TRUE)
a<-table.row.end(a)
a<-table.row.start(a)
a<-table.element(a,'Time lag k',header=TRUE)
a<-table.element(a,hyperlink('basics.htm','PACF(k)','click here for more information about the Partial Autocorrelation Function'),header=TRUE)
a<-table.element(a,'T-STAT',header=TRUE)
a<-table.element(a,'P-value',header=TRUE)
a<-table.row.end(a)
for (i in 1:par1) {
a<-table.row.start(a)
a<-table.element(a,i,header=TRUE)
a<-table.element(a,round(mypacf[i],6))
mytstat <- mypacf[i]*sqrtn
a<-table.element(a,round(mytstat,4))
a<-table.element(a,round(1-pt(abs(mytstat),lengthx),6))
a<-table.row.end(a)
}
a<-table.end(a)
table.save(a,file='mytable1.tab')