Free Statistics

of Irreproducible Research!

Author's title

Author*Unverified author*
R Software Modulerwasp_arimabackwardselection.wasp
Title produced by softwareARIMA Backward Selection
Date of computationWed, 30 Dec 2009 06:34:07 -0700
Cite this page as followsStatistical Computations at FreeStatistics.org, Office for Research Development and Education, URL https://freestatistics.org/blog/index.php?v=date/2009/Dec/30/t1262180099mbte92hqg7l8lgj.htm/, Retrieved Sun, 28 Apr 2024 19:12:33 +0000
Statistical Computations at FreeStatistics.org, Office for Research Development and Education, URL https://freestatistics.org/blog/index.php?pk=71272, Retrieved Sun, 28 Apr 2024 19:12:33 +0000
QR Codes:

Original text written by user:
IsPrivate?No (this computation is public)
User-defined keywords
Estimated Impact91
Family? (F = Feedback message, R = changed R code, M = changed R Module, P = changed Parameters, D = changed Data)
-       [ARIMA Backward Selection] [arima backward se...] [2009-12-30 13:34:07] [dbd46bd47d5f87b1007a5a1708bef00e] [Current]
Feedback Forum

Post a new message
Dataseries X:
10070
10137
9984
9732
9103
9155
9308
9394
9948
10177
10002
9728
10002
10063
10018
9960
10236
10893
10756
10940
10997
10827
10166
10186
10457
10368
10244
10511
10812
10738
10171
9721
9897
9828
9924
10371
10846
10413
10709
10662
10570
10297
10635
10872
10296
10383
10431
10574
10653
10805
10872
10625
10407
10463
10556
10646
10702
11353
11346
11451
11964
12574
13031
13812
14544
14931
14886
16005
17064
15168
16050
15839
15137
14954
15648
15305
15579
16348
15928
16171
15937
15713
15594
15683
16438
17032
17696
17745
19394
20148
20108
18584
18441
18391
19178
18079
18483
19644
19195
19650
20830
23595
22937
21814
21928
21777
21383
21467
22052
22680
24320


Summary of computational transaction
Raw Inputview raw input (R code)
Raw Outputview raw output of R engine
Computing time7 seconds
R Server'Gwilym Jenkins' @ 72.249.127.135

\begin{tabular}{lllllllll}
\hline
Summary of computational transaction \tabularnewline
Raw Input & view raw input (R code)  \tabularnewline
Raw Output & view raw output of R engine  \tabularnewline
Computing time & 7 seconds \tabularnewline
R Server & 'Gwilym Jenkins' @ 72.249.127.135 \tabularnewline
\hline
\end{tabular}
%Source: https://freestatistics.org/blog/index.php?pk=71272&T=0

[TABLE]
[ROW][C]Summary of computational transaction[/C][/ROW]
[ROW][C]Raw Input[/C][C]view raw input (R code) [/C][/ROW]
[ROW][C]Raw Output[/C][C]view raw output of R engine [/C][/ROW]
[ROW][C]Computing time[/C][C]7 seconds[/C][/ROW]
[ROW][C]R Server[/C][C]'Gwilym Jenkins' @ 72.249.127.135[/C][/ROW]
[/TABLE]
Source: https://freestatistics.org/blog/index.php?pk=71272&T=0

Globally Unique Identifier (entire table): ba.freestatistics.org/blog/index.php?pk=71272&T=0

As an alternative you can also use a QR Code:  

The GUIDs for individual cells are displayed in the table below:

Summary of computational transaction
Raw Inputview raw input (R code)
Raw Outputview raw output of R engine
Computing time7 seconds
R Server'Gwilym Jenkins' @ 72.249.127.135


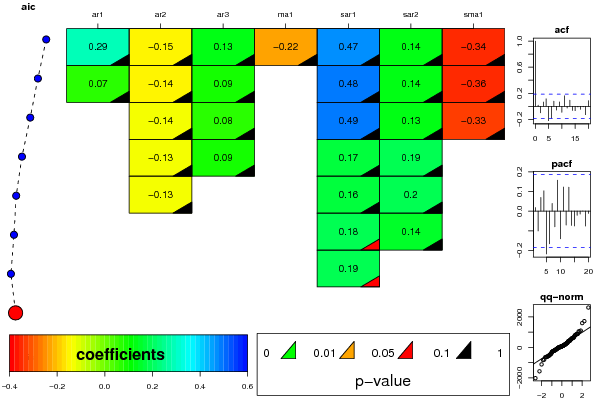
ARIMA Parameter Estimation and Backward Selection
Iterationar1ar2ar3ma1sar1sar2sma1
Estimates ( 1 )0.2895-0.15240.1319-0.22090.46940.135-0.3409
(p-val)(0.4641 )(0.1704 )(0.2197 )(0.5697 )(0.3897 )(0.4506 )(0.536 )
Estimates ( 2 )0.07-0.14140.089900.48350.1354-0.3582
(p-val)(0.5104 )(0.1796 )(0.3607 )(NA )(0.3505 )(0.4439 )(0.4926 )
Estimates ( 3 )0-0.13570.079800.48550.134-0.3321
(p-val)(NA )(0.1962 )(0.4129 )(NA )(0.3582 )(0.4775 )(0.5335 )
Estimates ( 4 )0-0.130.087500.16570.19260
(p-val)(NA )(0.2132 )(0.3675 )(NA )(0.121 )(0.1333 )(NA )
Estimates ( 5 )0-0.1301000.16190.19850
(p-val)(NA )(0.2125 )(NA )(NA )(0.1253 )(0.1161 )(NA )
Estimates ( 6 )00000.18090.14230
(p-val)(NA )(NA )(NA )(NA )(0.0904 )(0.2381 )(NA )
Estimates ( 7 )00000.190500
(p-val)(NA )(NA )(NA )(NA )(0.0845 )(NA )(NA )
Estimates ( 8 )0000000
(p-val)(NA )(NA )(NA )(NA )(NA )(NA )(NA )
Estimates ( 9 )NANANANANANANA
(p-val)(NA )(NA )(NA )(NA )(NA )(NA )(NA )
Estimates ( 10 )NANANANANANANA
(p-val)(NA )(NA )(NA )(NA )(NA )(NA )(NA )
Estimates ( 11 )NANANANANANANA
(p-val)(NA )(NA )(NA )(NA )(NA )(NA )(NA )
Estimates ( 12 )NANANANANANANA
(p-val)(NA )(NA )(NA )(NA )(NA )(NA )(NA )
Estimates ( 13 )NANANANANANANA
(p-val)(NA )(NA )(NA )(NA )(NA )(NA )(NA )

\begin{tabular}{lllllllll}
\hline
ARIMA Parameter Estimation and Backward Selection \tabularnewline
Iteration & ar1 & ar2 & ar3 & ma1 & sar1 & sar2 & sma1 \tabularnewline
Estimates ( 1 ) & 0.2895 & -0.1524 & 0.1319 & -0.2209 & 0.4694 & 0.135 & -0.3409 \tabularnewline
(p-val) & (0.4641 ) & (0.1704 ) & (0.2197 ) & (0.5697 ) & (0.3897 ) & (0.4506 ) & (0.536 ) \tabularnewline
Estimates ( 2 ) & 0.07 & -0.1414 & 0.0899 & 0 & 0.4835 & 0.1354 & -0.3582 \tabularnewline
(p-val) & (0.5104 ) & (0.1796 ) & (0.3607 ) & (NA ) & (0.3505 ) & (0.4439 ) & (0.4926 ) \tabularnewline
Estimates ( 3 ) & 0 & -0.1357 & 0.0798 & 0 & 0.4855 & 0.134 & -0.3321 \tabularnewline
(p-val) & (NA ) & (0.1962 ) & (0.4129 ) & (NA ) & (0.3582 ) & (0.4775 ) & (0.5335 ) \tabularnewline
Estimates ( 4 ) & 0 & -0.13 & 0.0875 & 0 & 0.1657 & 0.1926 & 0 \tabularnewline
(p-val) & (NA ) & (0.2132 ) & (0.3675 ) & (NA ) & (0.121 ) & (0.1333 ) & (NA ) \tabularnewline
Estimates ( 5 ) & 0 & -0.1301 & 0 & 0 & 0.1619 & 0.1985 & 0 \tabularnewline
(p-val) & (NA ) & (0.2125 ) & (NA ) & (NA ) & (0.1253 ) & (0.1161 ) & (NA ) \tabularnewline
Estimates ( 6 ) & 0 & 0 & 0 & 0 & 0.1809 & 0.1423 & 0 \tabularnewline
(p-val) & (NA ) & (NA ) & (NA ) & (NA ) & (0.0904 ) & (0.2381 ) & (NA ) \tabularnewline
Estimates ( 7 ) & 0 & 0 & 0 & 0 & 0.1905 & 0 & 0 \tabularnewline
(p-val) & (NA ) & (NA ) & (NA ) & (NA ) & (0.0845 ) & (NA ) & (NA ) \tabularnewline
Estimates ( 8 ) & 0 & 0 & 0 & 0 & 0 & 0 & 0 \tabularnewline
(p-val) & (NA ) & (NA ) & (NA ) & (NA ) & (NA ) & (NA ) & (NA ) \tabularnewline
Estimates ( 9 ) & NA & NA & NA & NA & NA & NA & NA \tabularnewline
(p-val) & (NA ) & (NA ) & (NA ) & (NA ) & (NA ) & (NA ) & (NA ) \tabularnewline
Estimates ( 10 ) & NA & NA & NA & NA & NA & NA & NA \tabularnewline
(p-val) & (NA ) & (NA ) & (NA ) & (NA ) & (NA ) & (NA ) & (NA ) \tabularnewline
Estimates ( 11 ) & NA & NA & NA & NA & NA & NA & NA \tabularnewline
(p-val) & (NA ) & (NA ) & (NA ) & (NA ) & (NA ) & (NA ) & (NA ) \tabularnewline
Estimates ( 12 ) & NA & NA & NA & NA & NA & NA & NA \tabularnewline
(p-val) & (NA ) & (NA ) & (NA ) & (NA ) & (NA ) & (NA ) & (NA ) \tabularnewline
Estimates ( 13 ) & NA & NA & NA & NA & NA & NA & NA \tabularnewline
(p-val) & (NA ) & (NA ) & (NA ) & (NA ) & (NA ) & (NA ) & (NA ) \tabularnewline
\hline
\end{tabular}
%Source: https://freestatistics.org/blog/index.php?pk=71272&T=1

[TABLE]
[ROW][C]ARIMA Parameter Estimation and Backward Selection[/C][/ROW]
[ROW][C]Iteration[/C][C]ar1[/C][C]ar2[/C][C]ar3[/C][C]ma1[/C][C]sar1[/C][C]sar2[/C][C]sma1[/C][/ROW]
[ROW][C]Estimates ( 1 )[/C][C]0.2895[/C][C]-0.1524[/C][C]0.1319[/C][C]-0.2209[/C][C]0.4694[/C][C]0.135[/C][C]-0.3409[/C][/ROW]
[ROW][C](p-val)[/C][C](0.4641 )[/C][C](0.1704 )[/C][C](0.2197 )[/C][C](0.5697 )[/C][C](0.3897 )[/C][C](0.4506 )[/C][C](0.536 )[/C][/ROW]
[ROW][C]Estimates ( 2 )[/C][C]0.07[/C][C]-0.1414[/C][C]0.0899[/C][C]0[/C][C]0.4835[/C][C]0.1354[/C][C]-0.3582[/C][/ROW]
[ROW][C](p-val)[/C][C](0.5104 )[/C][C](0.1796 )[/C][C](0.3607 )[/C][C](NA )[/C][C](0.3505 )[/C][C](0.4439 )[/C][C](0.4926 )[/C][/ROW]
[ROW][C]Estimates ( 3 )[/C][C]0[/C][C]-0.1357[/C][C]0.0798[/C][C]0[/C][C]0.4855[/C][C]0.134[/C][C]-0.3321[/C][/ROW]
[ROW][C](p-val)[/C][C](NA )[/C][C](0.1962 )[/C][C](0.4129 )[/C][C](NA )[/C][C](0.3582 )[/C][C](0.4775 )[/C][C](0.5335 )[/C][/ROW]
[ROW][C]Estimates ( 4 )[/C][C]0[/C][C]-0.13[/C][C]0.0875[/C][C]0[/C][C]0.1657[/C][C]0.1926[/C][C]0[/C][/ROW]
[ROW][C](p-val)[/C][C](NA )[/C][C](0.2132 )[/C][C](0.3675 )[/C][C](NA )[/C][C](0.121 )[/C][C](0.1333 )[/C][C](NA )[/C][/ROW]
[ROW][C]Estimates ( 5 )[/C][C]0[/C][C]-0.1301[/C][C]0[/C][C]0[/C][C]0.1619[/C][C]0.1985[/C][C]0[/C][/ROW]
[ROW][C](p-val)[/C][C](NA )[/C][C](0.2125 )[/C][C](NA )[/C][C](NA )[/C][C](0.1253 )[/C][C](0.1161 )[/C][C](NA )[/C][/ROW]
[ROW][C]Estimates ( 6 )[/C][C]0[/C][C]0[/C][C]0[/C][C]0[/C][C]0.1809[/C][C]0.1423[/C][C]0[/C][/ROW]
[ROW][C](p-val)[/C][C](NA )[/C][C](NA )[/C][C](NA )[/C][C](NA )[/C][C](0.0904 )[/C][C](0.2381 )[/C][C](NA )[/C][/ROW]
[ROW][C]Estimates ( 7 )[/C][C]0[/C][C]0[/C][C]0[/C][C]0[/C][C]0.1905[/C][C]0[/C][C]0[/C][/ROW]
[ROW][C](p-val)[/C][C](NA )[/C][C](NA )[/C][C](NA )[/C][C](NA )[/C][C](0.0845 )[/C][C](NA )[/C][C](NA )[/C][/ROW]
[ROW][C]Estimates ( 8 )[/C][C]0[/C][C]0[/C][C]0[/C][C]0[/C][C]0[/C][C]0[/C][C]0[/C][/ROW]
[ROW][C](p-val)[/C][C](NA )[/C][C](NA )[/C][C](NA )[/C][C](NA )[/C][C](NA )[/C][C](NA )[/C][C](NA )[/C][/ROW]
[ROW][C]Estimates ( 9 )[/C][C]NA[/C][C]NA[/C][C]NA[/C][C]NA[/C][C]NA[/C][C]NA[/C][C]NA[/C][/ROW]
[ROW][C](p-val)[/C][C](NA )[/C][C](NA )[/C][C](NA )[/C][C](NA )[/C][C](NA )[/C][C](NA )[/C][C](NA )[/C][/ROW]
[ROW][C]Estimates ( 10 )[/C][C]NA[/C][C]NA[/C][C]NA[/C][C]NA[/C][C]NA[/C][C]NA[/C][C]NA[/C][/ROW]
[ROW][C](p-val)[/C][C](NA )[/C][C](NA )[/C][C](NA )[/C][C](NA )[/C][C](NA )[/C][C](NA )[/C][C](NA )[/C][/ROW]
[ROW][C]Estimates ( 11 )[/C][C]NA[/C][C]NA[/C][C]NA[/C][C]NA[/C][C]NA[/C][C]NA[/C][C]NA[/C][/ROW]
[ROW][C](p-val)[/C][C](NA )[/C][C](NA )[/C][C](NA )[/C][C](NA )[/C][C](NA )[/C][C](NA )[/C][C](NA )[/C][/ROW]
[ROW][C]Estimates ( 12 )[/C][C]NA[/C][C]NA[/C][C]NA[/C][C]NA[/C][C]NA[/C][C]NA[/C][C]NA[/C][/ROW]
[ROW][C](p-val)[/C][C](NA )[/C][C](NA )[/C][C](NA )[/C][C](NA )[/C][C](NA )[/C][C](NA )[/C][C](NA )[/C][/ROW]
[ROW][C]Estimates ( 13 )[/C][C]NA[/C][C]NA[/C][C]NA[/C][C]NA[/C][C]NA[/C][C]NA[/C][C]NA[/C][/ROW]
[ROW][C](p-val)[/C][C](NA )[/C][C](NA )[/C][C](NA )[/C][C](NA )[/C][C](NA )[/C][C](NA )[/C][C](NA )[/C][/ROW]
[/TABLE]
Source: https://freestatistics.org/blog/index.php?pk=71272&T=1

Globally Unique Identifier (entire table): ba.freestatistics.org/blog/index.php?pk=71272&T=1

As an alternative you can also use a QR Code:  

The GUIDs for individual cells are displayed in the table below:

ARIMA Parameter Estimation and Backward Selection
Iterationar1ar2ar3ma1sar1sar2sma1
Estimates ( 1 )0.2895-0.15240.1319-0.22090.46940.135-0.3409
(p-val)(0.4641 )(0.1704 )(0.2197 )(0.5697 )(0.3897 )(0.4506 )(0.536 )
Estimates ( 2 )0.07-0.14140.089900.48350.1354-0.3582
(p-val)(0.5104 )(0.1796 )(0.3607 )(NA )(0.3505 )(0.4439 )(0.4926 )
Estimates ( 3 )0-0.13570.079800.48550.134-0.3321
(p-val)(NA )(0.1962 )(0.4129 )(NA )(0.3582 )(0.4775 )(0.5335 )
Estimates ( 4 )0-0.130.087500.16570.19260
(p-val)(NA )(0.2132 )(0.3675 )(NA )(0.121 )(0.1333 )(NA )
Estimates ( 5 )0-0.1301000.16190.19850
(p-val)(NA )(0.2125 )(NA )(NA )(0.1253 )(0.1161 )(NA )
Estimates ( 6 )00000.18090.14230
(p-val)(NA )(NA )(NA )(NA )(0.0904 )(0.2381 )(NA )
Estimates ( 7 )00000.190500
(p-val)(NA )(NA )(NA )(NA )(0.0845 )(NA )(NA )
Estimates ( 8 )0000000
(p-val)(NA )(NA )(NA )(NA )(NA )(NA )(NA )
Estimates ( 9 )NANANANANANANA
(p-val)(NA )(NA )(NA )(NA )(NA )(NA )(NA )
Estimates ( 10 )NANANANANANANA
(p-val)(NA )(NA )(NA )(NA )(NA )(NA )(NA )
Estimates ( 11 )NANANANANANANA
(p-val)(NA )(NA )(NA )(NA )(NA )(NA )(NA )
Estimates ( 12 )NANANANANANANA
(p-val)(NA )(NA )(NA )(NA )(NA )(NA )(NA )
Estimates ( 13 )NANANANANANANA
(p-val)(NA )(NA )(NA )(NA )(NA )(NA )(NA )


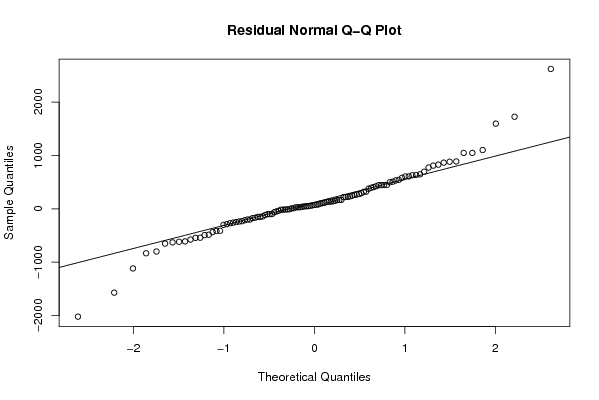
Estimated ARIMA Residuals
Value
10.0699947754242
65.7731821094984
-150.198460641018
-247.385699879324
-617.482560413075
51.0478428322415
150.198460641018
84.4252785302456
543.855864020419
224.806846318910
-171.795624916197
-268.982864154503
268.980915214612
48.2372215011231
-15.8551476059929
-9.99671370398755
395.817726508698
647.094559970665
-166.144852394007
167.617926105329
-48.5310341586937
-213.622033975345
-627.664384516658
72.1940493853472
218.805950614653
-100.619843111337
-115.427984589998
278.048375417337
248.424972151986
-199.151424986032
-540.902975307326
-485.050018565342
165.142113813998
-36.6168306733252
221.913381911367
443.190215373332
423.377418308653
-416.046458411329
319.620664685339
-97.8606247660136
-149.337258631349
-258.90379688133
446.007394166028
322.720154100021
-609.526104714676
100.143756962003
29.7130337919953
57.8513135939775
-11.4823848833566
234.481837167355
10.6151875253181
-238.047006127332
-200.474990717328
108.003560154013
28.6146398093169
44.8540521739887
165.721797248028
634.427436873995
-16.1434831040024
77.760039919327
497.951350724663
581.045636837325
444.237221500664
828.050840139345
773.526652430677
376.33260304533
-62.7154985140041
1101.85596917999
1048.33260304533
-2020.00848959803
883.333424619334
-231.001369290005
-799.720975674025
-299.198431113364
606.946421280643
-491.772089671373
134.561882663964
695.28066747398
-411.427984589998
29.8425501379443
-435.728095982053
137.167582608094
-287.011502036044
129.193227811344
888.723440396036
628.859529334008
531.800473454634
114.337806347350
1596.80595061465
607.51378110463
40.0054771600226
-1570.28888321401
-98.4255198679894
-7.33041218132348
809.668218528674
-1115.95354158867
260.180630343297
1047.84939658797
-575.484849605367
445.666027664665
865.883257531252
2621.37111957463
-650.380430746663
-832.694411447923
141.239960080675
-141.475538433329
-543.915025059374
293.347665235389
508.042350541313
406.842002421941
1725.52966486869

\begin{tabular}{lllllllll}
\hline
Estimated ARIMA Residuals \tabularnewline
Value \tabularnewline
10.0699947754242 \tabularnewline
65.7731821094984 \tabularnewline
-150.198460641018 \tabularnewline
-247.385699879324 \tabularnewline
-617.482560413075 \tabularnewline
51.0478428322415 \tabularnewline
150.198460641018 \tabularnewline
84.4252785302456 \tabularnewline
543.855864020419 \tabularnewline
224.806846318910 \tabularnewline
-171.795624916197 \tabularnewline
-268.982864154503 \tabularnewline
268.980915214612 \tabularnewline
48.2372215011231 \tabularnewline
-15.8551476059929 \tabularnewline
-9.99671370398755 \tabularnewline
395.817726508698 \tabularnewline
647.094559970665 \tabularnewline
-166.144852394007 \tabularnewline
167.617926105329 \tabularnewline
-48.5310341586937 \tabularnewline
-213.622033975345 \tabularnewline
-627.664384516658 \tabularnewline
72.1940493853472 \tabularnewline
218.805950614653 \tabularnewline
-100.619843111337 \tabularnewline
-115.427984589998 \tabularnewline
278.048375417337 \tabularnewline
248.424972151986 \tabularnewline
-199.151424986032 \tabularnewline
-540.902975307326 \tabularnewline
-485.050018565342 \tabularnewline
165.142113813998 \tabularnewline
-36.6168306733252 \tabularnewline
221.913381911367 \tabularnewline
443.190215373332 \tabularnewline
423.377418308653 \tabularnewline
-416.046458411329 \tabularnewline
319.620664685339 \tabularnewline
-97.8606247660136 \tabularnewline
-149.337258631349 \tabularnewline
-258.90379688133 \tabularnewline
446.007394166028 \tabularnewline
322.720154100021 \tabularnewline
-609.526104714676 \tabularnewline
100.143756962003 \tabularnewline
29.7130337919953 \tabularnewline
57.8513135939775 \tabularnewline
-11.4823848833566 \tabularnewline
234.481837167355 \tabularnewline
10.6151875253181 \tabularnewline
-238.047006127332 \tabularnewline
-200.474990717328 \tabularnewline
108.003560154013 \tabularnewline
28.6146398093169 \tabularnewline
44.8540521739887 \tabularnewline
165.721797248028 \tabularnewline
634.427436873995 \tabularnewline
-16.1434831040024 \tabularnewline
77.760039919327 \tabularnewline
497.951350724663 \tabularnewline
581.045636837325 \tabularnewline
444.237221500664 \tabularnewline
828.050840139345 \tabularnewline
773.526652430677 \tabularnewline
376.33260304533 \tabularnewline
-62.7154985140041 \tabularnewline
1101.85596917999 \tabularnewline
1048.33260304533 \tabularnewline
-2020.00848959803 \tabularnewline
883.333424619334 \tabularnewline
-231.001369290005 \tabularnewline
-799.720975674025 \tabularnewline
-299.198431113364 \tabularnewline
606.946421280643 \tabularnewline
-491.772089671373 \tabularnewline
134.561882663964 \tabularnewline
695.28066747398 \tabularnewline
-411.427984589998 \tabularnewline
29.8425501379443 \tabularnewline
-435.728095982053 \tabularnewline
137.167582608094 \tabularnewline
-287.011502036044 \tabularnewline
129.193227811344 \tabularnewline
888.723440396036 \tabularnewline
628.859529334008 \tabularnewline
531.800473454634 \tabularnewline
114.337806347350 \tabularnewline
1596.80595061465 \tabularnewline
607.51378110463 \tabularnewline
40.0054771600226 \tabularnewline
-1570.28888321401 \tabularnewline
-98.4255198679894 \tabularnewline
-7.33041218132348 \tabularnewline
809.668218528674 \tabularnewline
-1115.95354158867 \tabularnewline
260.180630343297 \tabularnewline
1047.84939658797 \tabularnewline
-575.484849605367 \tabularnewline
445.666027664665 \tabularnewline
865.883257531252 \tabularnewline
2621.37111957463 \tabularnewline
-650.380430746663 \tabularnewline
-832.694411447923 \tabularnewline
141.239960080675 \tabularnewline
-141.475538433329 \tabularnewline
-543.915025059374 \tabularnewline
293.347665235389 \tabularnewline
508.042350541313 \tabularnewline
406.842002421941 \tabularnewline
1725.52966486869 \tabularnewline
\hline
\end{tabular}
%Source: https://freestatistics.org/blog/index.php?pk=71272&T=2

[TABLE]
[ROW][C]Estimated ARIMA Residuals[/C][/ROW]
[ROW][C]Value[/C][/ROW]
[ROW][C]10.0699947754242[/C][/ROW]
[ROW][C]65.7731821094984[/C][/ROW]
[ROW][C]-150.198460641018[/C][/ROW]
[ROW][C]-247.385699879324[/C][/ROW]
[ROW][C]-617.482560413075[/C][/ROW]
[ROW][C]51.0478428322415[/C][/ROW]
[ROW][C]150.198460641018[/C][/ROW]
[ROW][C]84.4252785302456[/C][/ROW]
[ROW][C]543.855864020419[/C][/ROW]
[ROW][C]224.806846318910[/C][/ROW]
[ROW][C]-171.795624916197[/C][/ROW]
[ROW][C]-268.982864154503[/C][/ROW]
[ROW][C]268.980915214612[/C][/ROW]
[ROW][C]48.2372215011231[/C][/ROW]
[ROW][C]-15.8551476059929[/C][/ROW]
[ROW][C]-9.99671370398755[/C][/ROW]
[ROW][C]395.817726508698[/C][/ROW]
[ROW][C]647.094559970665[/C][/ROW]
[ROW][C]-166.144852394007[/C][/ROW]
[ROW][C]167.617926105329[/C][/ROW]
[ROW][C]-48.5310341586937[/C][/ROW]
[ROW][C]-213.622033975345[/C][/ROW]
[ROW][C]-627.664384516658[/C][/ROW]
[ROW][C]72.1940493853472[/C][/ROW]
[ROW][C]218.805950614653[/C][/ROW]
[ROW][C]-100.619843111337[/C][/ROW]
[ROW][C]-115.427984589998[/C][/ROW]
[ROW][C]278.048375417337[/C][/ROW]
[ROW][C]248.424972151986[/C][/ROW]
[ROW][C]-199.151424986032[/C][/ROW]
[ROW][C]-540.902975307326[/C][/ROW]
[ROW][C]-485.050018565342[/C][/ROW]
[ROW][C]165.142113813998[/C][/ROW]
[ROW][C]-36.6168306733252[/C][/ROW]
[ROW][C]221.913381911367[/C][/ROW]
[ROW][C]443.190215373332[/C][/ROW]
[ROW][C]423.377418308653[/C][/ROW]
[ROW][C]-416.046458411329[/C][/ROW]
[ROW][C]319.620664685339[/C][/ROW]
[ROW][C]-97.8606247660136[/C][/ROW]
[ROW][C]-149.337258631349[/C][/ROW]
[ROW][C]-258.90379688133[/C][/ROW]
[ROW][C]446.007394166028[/C][/ROW]
[ROW][C]322.720154100021[/C][/ROW]
[ROW][C]-609.526104714676[/C][/ROW]
[ROW][C]100.143756962003[/C][/ROW]
[ROW][C]29.7130337919953[/C][/ROW]
[ROW][C]57.8513135939775[/C][/ROW]
[ROW][C]-11.4823848833566[/C][/ROW]
[ROW][C]234.481837167355[/C][/ROW]
[ROW][C]10.6151875253181[/C][/ROW]
[ROW][C]-238.047006127332[/C][/ROW]
[ROW][C]-200.474990717328[/C][/ROW]
[ROW][C]108.003560154013[/C][/ROW]
[ROW][C]28.6146398093169[/C][/ROW]
[ROW][C]44.8540521739887[/C][/ROW]
[ROW][C]165.721797248028[/C][/ROW]
[ROW][C]634.427436873995[/C][/ROW]
[ROW][C]-16.1434831040024[/C][/ROW]
[ROW][C]77.760039919327[/C][/ROW]
[ROW][C]497.951350724663[/C][/ROW]
[ROW][C]581.045636837325[/C][/ROW]
[ROW][C]444.237221500664[/C][/ROW]
[ROW][C]828.050840139345[/C][/ROW]
[ROW][C]773.526652430677[/C][/ROW]
[ROW][C]376.33260304533[/C][/ROW]
[ROW][C]-62.7154985140041[/C][/ROW]
[ROW][C]1101.85596917999[/C][/ROW]
[ROW][C]1048.33260304533[/C][/ROW]
[ROW][C]-2020.00848959803[/C][/ROW]
[ROW][C]883.333424619334[/C][/ROW]
[ROW][C]-231.001369290005[/C][/ROW]
[ROW][C]-799.720975674025[/C][/ROW]
[ROW][C]-299.198431113364[/C][/ROW]
[ROW][C]606.946421280643[/C][/ROW]
[ROW][C]-491.772089671373[/C][/ROW]
[ROW][C]134.561882663964[/C][/ROW]
[ROW][C]695.28066747398[/C][/ROW]
[ROW][C]-411.427984589998[/C][/ROW]
[ROW][C]29.8425501379443[/C][/ROW]
[ROW][C]-435.728095982053[/C][/ROW]
[ROW][C]137.167582608094[/C][/ROW]
[ROW][C]-287.011502036044[/C][/ROW]
[ROW][C]129.193227811344[/C][/ROW]
[ROW][C]888.723440396036[/C][/ROW]
[ROW][C]628.859529334008[/C][/ROW]
[ROW][C]531.800473454634[/C][/ROW]
[ROW][C]114.337806347350[/C][/ROW]
[ROW][C]1596.80595061465[/C][/ROW]
[ROW][C]607.51378110463[/C][/ROW]
[ROW][C]40.0054771600226[/C][/ROW]
[ROW][C]-1570.28888321401[/C][/ROW]
[ROW][C]-98.4255198679894[/C][/ROW]
[ROW][C]-7.33041218132348[/C][/ROW]
[ROW][C]809.668218528674[/C][/ROW]
[ROW][C]-1115.95354158867[/C][/ROW]
[ROW][C]260.180630343297[/C][/ROW]
[ROW][C]1047.84939658797[/C][/ROW]
[ROW][C]-575.484849605367[/C][/ROW]
[ROW][C]445.666027664665[/C][/ROW]
[ROW][C]865.883257531252[/C][/ROW]
[ROW][C]2621.37111957463[/C][/ROW]
[ROW][C]-650.380430746663[/C][/ROW]
[ROW][C]-832.694411447923[/C][/ROW]
[ROW][C]141.239960080675[/C][/ROW]
[ROW][C]-141.475538433329[/C][/ROW]
[ROW][C]-543.915025059374[/C][/ROW]
[ROW][C]293.347665235389[/C][/ROW]
[ROW][C]508.042350541313[/C][/ROW]
[ROW][C]406.842002421941[/C][/ROW]
[ROW][C]1725.52966486869[/C][/ROW]
[/TABLE]
Source: https://freestatistics.org/blog/index.php?pk=71272&T=2

Globally Unique Identifier (entire table): ba.freestatistics.org/blog/index.php?pk=71272&T=2

As an alternative you can also use a QR Code:  

The GUIDs for individual cells are displayed in the table below:

Estimated ARIMA Residuals
Value
10.0699947754242
65.7731821094984
-150.198460641018
-247.385699879324
-617.482560413075
51.0478428322415
150.198460641018
84.4252785302456
543.855864020419
224.806846318910
-171.795624916197
-268.982864154503
268.980915214612
48.2372215011231
-15.8551476059929
-9.99671370398755
395.817726508698
647.094559970665
-166.144852394007
167.617926105329
-48.5310341586937
-213.622033975345
-627.664384516658
72.1940493853472
218.805950614653
-100.619843111337
-115.427984589998
278.048375417337
248.424972151986
-199.151424986032
-540.902975307326
-485.050018565342
165.142113813998
-36.6168306733252
221.913381911367
443.190215373332
423.377418308653
-416.046458411329
319.620664685339
-97.8606247660136
-149.337258631349
-258.90379688133
446.007394166028
322.720154100021
-609.526104714676
100.143756962003
29.7130337919953
57.8513135939775
-11.4823848833566
234.481837167355
10.6151875253181
-238.047006127332
-200.474990717328
108.003560154013
28.6146398093169
44.8540521739887
165.721797248028
634.427436873995
-16.1434831040024
77.760039919327
497.951350724663
581.045636837325
444.237221500664
828.050840139345
773.526652430677
376.33260304533
-62.7154985140041
1101.85596917999
1048.33260304533
-2020.00848959803
883.333424619334
-231.001369290005
-799.720975674025
-299.198431113364
606.946421280643
-491.772089671373
134.561882663964
695.28066747398
-411.427984589998
29.8425501379443
-435.728095982053
137.167582608094
-287.011502036044
129.193227811344
888.723440396036
628.859529334008
531.800473454634
114.337806347350
1596.80595061465
607.51378110463
40.0054771600226
-1570.28888321401
-98.4255198679894
-7.33041218132348
809.668218528674
-1115.95354158867
260.180630343297
1047.84939658797
-575.484849605367
445.666027664665
865.883257531252
2621.37111957463
-650.380430746663
-832.694411447923
141.239960080675
-141.475538433329
-543.915025059374
293.347665235389
508.042350541313
406.842002421941
1725.52966486869


Parameters (Session):
par1 = FALSE ; par2 = 1 ; par3 = 1 ; par4 = 0 ; par5 = 12 ; par6 = 3 ; par7 = 1 ; par8 = 2 ; par9 = 1 ;
Parameters (R input):
par1 = FALSE ; par2 = 1 ; par3 = 1 ; par4 = 0 ; par5 = 12 ; par6 = 3 ; par7 = 1 ; par8 = 2 ; par9 = 1 ;
R code (references can be found in the software module):
library(lattice)
if (par1 == 'TRUE') par1 <- TRUE
if (par1 == 'FALSE') par1 <- FALSE
par2 <- as.numeric(par2) #Box-Cox lambda transformation parameter
par3 <- as.numeric(par3) #degree of non-seasonal differencing
par4 <- as.numeric(par4) #degree of seasonal differencing
par5 <- as.numeric(par5) #seasonal period
par6 <- as.numeric(par6) #degree (p) of the non-seasonal AR(p) polynomial
par7 <- as.numeric(par7) #degree (q) of the non-seasonal MA(q) polynomial
par8 <- as.numeric(par8) #degree (P) of the seasonal AR(P) polynomial
par9 <- as.numeric(par9) #degree (Q) of the seasonal MA(Q) polynomial
armaGR <- function(arima.out, names, n){
try1 <- arima.out$coef
try2 <- sqrt(diag(arima.out$var.coef))
try.data.frame <- data.frame(matrix(NA,ncol=4,nrow=length(names)))
dimnames(try.data.frame) <- list(names,c('coef','std','tstat','pv'))
try.data.frame[,1] <- try1
for(i in 1:length(try2)) try.data.frame[which(rownames(try.data.frame)==names(try2)[i]),2] <- try2[i]
try.data.frame[,3] <- try.data.frame[,1] / try.data.frame[,2]
try.data.frame[,4] <- round((1-pt(abs(try.data.frame[,3]),df=n-(length(try2)+1)))*2,5)
vector <- rep(NA,length(names))
vector[is.na(try.data.frame[,4])] <- 0
maxi <- which.max(try.data.frame[,4])
continue <- max(try.data.frame[,4],na.rm=TRUE) > .05
vector[maxi] <- 0
list(summary=try.data.frame,next.vector=vector,continue=continue)
}
arimaSelect <- function(series, order=c(13,0,0), seasonal=list(order=c(2,0,0),period=12), include.mean=F){
nrc <- order[1]+order[3]+seasonal$order[1]+seasonal$order[3]
coeff <- matrix(NA, nrow=nrc*2, ncol=nrc)
pval <- matrix(NA, nrow=nrc*2, ncol=nrc)
mylist <- rep(list(NULL), nrc)
names <- NULL
if(order[1] > 0) names <- paste('ar',1:order[1],sep='')
if(order[3] > 0) names <- c( names , paste('ma',1:order[3],sep='') )
if(seasonal$order[1] > 0) names <- c(names, paste('sar',1:seasonal$order[1],sep=''))
if(seasonal$order[3] > 0) names <- c(names, paste('sma',1:seasonal$order[3],sep=''))
arima.out <- arima(series, order=order, seasonal=seasonal, include.mean=include.mean, method='ML')
mylist[[1]] <- arima.out
last.arma <- armaGR(arima.out, names, length(series))
mystop <- FALSE
i <- 1
coeff[i,] <- last.arma[[1]][,1]
pval [i,] <- last.arma[[1]][,4]
i <- 2
aic <- arima.out$aic
while(!mystop){
mylist[[i]] <- arima.out
arima.out <- arima(series, order=order, seasonal=seasonal, include.mean=include.mean, method='ML', fixed=last.arma$next.vector)
aic <- c(aic, arima.out$aic)
last.arma <- armaGR(arima.out, names, length(series))
mystop <- !last.arma$continue
coeff[i,] <- last.arma[[1]][,1]
pval [i,] <- last.arma[[1]][,4]
i <- i+1
}
list(coeff, pval, mylist, aic=aic)
}
arimaSelectplot <- function(arimaSelect.out,noms,choix){
noms <- names(arimaSelect.out[[3]][[1]]$coef)
coeff <- arimaSelect.out[[1]]
k <- min(which(is.na(coeff[,1])))-1
coeff <- coeff[1:k,]
pval <- arimaSelect.out[[2]][1:k,]
aic <- arimaSelect.out$aic[1:k]
coeff[coeff==0] <- NA
n <- ncol(coeff)
if(missing(choix)) choix <- k
layout(matrix(c(1,1,1,2,
3,3,3,2,
3,3,3,4,
5,6,7,7),nr=4),
widths=c(10,35,45,15),
heights=c(30,30,15,15))
couleurs <- rainbow(75)[1:50]#(50)
ticks <- pretty(coeff)
par(mar=c(1,1,3,1))
plot(aic,k:1-.5,type='o',pch=21,bg='blue',cex=2,axes=F,lty=2,xpd=NA)
points(aic[choix],k-choix+.5,pch=21,cex=4,bg=2,xpd=NA)
title('aic',line=2)
par(mar=c(3,0,0,0))
plot(0,axes=F,xlab='',ylab='',xlim=range(ticks),ylim=c(.1,1))
rect(xleft = min(ticks) + (0:49)/50*(max(ticks)-min(ticks)),
xright = min(ticks) + (1:50)/50*(max(ticks)-min(ticks)),
ytop = rep(1,50),
ybottom= rep(0,50),col=couleurs,border=NA)
axis(1,ticks)
rect(xleft=min(ticks),xright=max(ticks),ytop=1,ybottom=0)
text(mean(coeff,na.rm=T),.5,'coefficients',cex=2,font=2)
par(mar=c(1,1,3,1))
image(1:n,1:k,t(coeff[k:1,]),axes=F,col=couleurs,zlim=range(ticks))
for(i in 1:n) for(j in 1:k) if(!is.na(coeff[j,i])) {
if(pval[j,i]<.01) symb = 'green'
else if( (pval[j,i]<.05) & (pval[j,i]>=.01)) symb = 'orange'
else if( (pval[j,i]<.1) & (pval[j,i]>=.05)) symb = 'red'
else symb = 'black'
polygon(c(i+.5 ,i+.2 ,i+.5 ,i+.5),
c(k-j+0.5,k-j+0.5,k-j+0.8,k-j+0.5),
col=symb)
if(j==choix) {
rect(xleft=i-.5,
xright=i+.5,
ybottom=k-j+1.5,
ytop=k-j+.5,
lwd=4)
text(i,
k-j+1,
round(coeff[j,i],2),
cex=1.2,
font=2)
}
else{
rect(xleft=i-.5,xright=i+.5,ybottom=k-j+1.5,ytop=k-j+.5)
text(i,k-j+1,round(coeff[j,i],2),cex=1.2,font=1)
}
}
axis(3,1:n,noms)
par(mar=c(0.5,0,0,0.5))
plot(0,axes=F,xlab='',ylab='',type='n',xlim=c(0,8),ylim=c(-.2,.8))
cols <- c('green','orange','red','black')
niv <- c('0','0.01','0.05','0.1')
for(i in 0:3){
polygon(c(1+2*i ,1+2*i ,1+2*i-.5 ,1+2*i),
c(.4 ,.7 , .4 , .4),
col=cols[i+1])
text(2*i,0.5,niv[i+1],cex=1.5)
}
text(8,.5,1,cex=1.5)
text(4,0,'p-value',cex=2)
box()
residus <- arimaSelect.out[[3]][[choix]]$res
par(mar=c(1,2,4,1))
acf(residus,main='')
title('acf',line=.5)
par(mar=c(1,2,4,1))
pacf(residus,main='')
title('pacf',line=.5)
par(mar=c(2,2,4,1))
qqnorm(residus,main='')
title('qq-norm',line=.5)
qqline(residus)
residus
}
if (par2 == 0) x <- log(x)
if (par2 != 0) x <- x^par2
(selection <- arimaSelect(x, order=c(par6,par3,par7), seasonal=list(order=c(par8,par4,par9), period=par5)))
bitmap(file='test1.png')
resid <- arimaSelectplot(selection)
dev.off()
resid
bitmap(file='test2.png')
acf(resid,length(resid)/2, main='Residual Autocorrelation Function')
dev.off()
bitmap(file='test3.png')
pacf(resid,length(resid)/2, main='Residual Partial Autocorrelation Function')
dev.off()
bitmap(file='test4.png')
cpgram(resid, main='Residual Cumulative Periodogram')
dev.off()
bitmap(file='test5.png')
hist(resid, main='Residual Histogram', xlab='values of Residuals')
dev.off()
bitmap(file='test6.png')
densityplot(~resid,col='black',main='Residual Density Plot', xlab='values of Residuals')
dev.off()
bitmap(file='test7.png')
qqnorm(resid, main='Residual Normal Q-Q Plot')
qqline(resid)
dev.off()
ncols <- length(selection[[1]][1,])
nrows <- length(selection[[2]][,1])-1
load(file='createtable')
a<-table.start()
a<-table.row.start(a)
a<-table.element(a,'ARIMA Parameter Estimation and Backward Selection', ncols+1,TRUE)
a<-table.row.end(a)
a<-table.row.start(a)
a<-table.element(a,'Iteration', header=TRUE)
for (i in 1:ncols) {
a<-table.element(a,names(selection[[3]][[1]]$coef)[i],header=TRUE)
}
a<-table.row.end(a)
for (j in 1:nrows) {
a<-table.row.start(a)
mydum <- 'Estimates ('
mydum <- paste(mydum,j)
mydum <- paste(mydum,')')
a<-table.element(a,mydum, header=TRUE)
for (i in 1:ncols) {
a<-table.element(a,round(selection[[1]][j,i],4))
}
a<-table.row.end(a)
a<-table.row.start(a)
a<-table.element(a,'(p-val)', header=TRUE)
for (i in 1:ncols) {
mydum <- '('
mydum <- paste(mydum,round(selection[[2]][j,i],4),sep='')
mydum <- paste(mydum,')')
a<-table.element(a,mydum)
}
a<-table.row.end(a)
}
a<-table.end(a)
table.save(a,file='mytable.tab')
a<-table.start()
a<-table.row.start(a)
a<-table.element(a,'Estimated ARIMA Residuals', 1,TRUE)
a<-table.row.end(a)
a<-table.row.start(a)
a<-table.element(a,'Value', 1,TRUE)
a<-table.row.end(a)
for (i in (par4*par5+par3):length(resid)) {
a<-table.row.start(a)
a<-table.element(a,resid[i])
a<-table.row.end(a)
}
a<-table.end(a)
table.save(a,file='mytable1.tab')