Free Statistics

of Irreproducible Research!

Author's title

Author*Unverified author*
R Software Modulerwasp_arimabackwardselection.wasp
Title produced by softwareARIMA Backward Selection
Date of computationWed, 30 Dec 2009 06:14:35 -0700
Cite this page as followsStatistical Computations at FreeStatistics.org, Office for Research Development and Education, URL https://freestatistics.org/blog/index.php?v=date/2009/Dec/30/t1262179091gr5vjom8a5k0fhb.htm/, Retrieved Mon, 29 Apr 2024 04:01:53 +0000
Statistical Computations at FreeStatistics.org, Office for Research Development and Education, URL https://freestatistics.org/blog/index.php?pk=71266, Retrieved Mon, 29 Apr 2024 04:01:53 +0000
QR Codes:

Original text written by user:
IsPrivate?No (this computation is public)
User-defined keywords
Estimated Impact128
Family? (F = Feedback message, R = changed R code, M = changed R Module, P = changed Parameters, D = changed Data)
-       [ARIMA Backward Selection] [arima backward se...] [2009-12-30 13:14:35] [dbd46bd47d5f87b1007a5a1708bef00e] [Current]
Feedback Forum

Post a new message
Dataseries X:
3032,93
3045,78
3110,52
3013,24
2987,1
2995,55
2833,18
2848,96
2794,83
2845,26
2915,02
2892,63
2604,42
2641,65
2659,81
2638,53
2720,25
2745,88
2735,7
2811,7
2799,43
2555,28
2304,98
2214,95
2065,81
1940,49
2042
1995,37
1946,81
1765,9
1635,25
1833,42
1910,43
1959,67
1969,6
2061,41
2093,48
2120,88
2174,56
2196,72
2350,44
2440,25
2408,64
2472,81
2407,6
2454,62
2448,05
2497,84
2645,64
2756,76
2849,27
2921,44
2981,85
3080,58
3106,22
3119,31
3061,26
3097,31
3161,69
3257,16
3277,01
3295,32
3363,99
3494,17
3667,03
3813,06
3917,96
3895,51
3801,06
3570,12
3701,61
3862,27
3970,1
4138,52
4199,75
4290,89
4443,91
4502,64
4356,98
4591,27
4696,96
4621,4
4562,84
4202,52
4296,49
4435,23
4105,18
4116,68
3844,49
3720,98
3674,4
3857,62
3801,06
3504,37
3032,6
3047,03
2962,34
2197,82
2014,45
1862,83
1905,41
1810,99
1670,07
1864,44
2052,02
2029,60
2070,83
2293,41
2443,27
2513,17
2466,92


Summary of computational transaction
Raw Inputview raw input (R code)
Raw Outputview raw output of R engine
Computing time9 seconds
R Server'Gwilym Jenkins' @ 72.249.127.135

\begin{tabular}{lllllllll}
\hline
Summary of computational transaction \tabularnewline
Raw Input & view raw input (R code)  \tabularnewline
Raw Output & view raw output of R engine  \tabularnewline
Computing time & 9 seconds \tabularnewline
R Server & 'Gwilym Jenkins' @ 72.249.127.135 \tabularnewline
\hline
\end{tabular}
%Source: https://freestatistics.org/blog/index.php?pk=71266&T=0

[TABLE]
[ROW][C]Summary of computational transaction[/C][/ROW]
[ROW][C]Raw Input[/C][C]view raw input (R code) [/C][/ROW]
[ROW][C]Raw Output[/C][C]view raw output of R engine [/C][/ROW]
[ROW][C]Computing time[/C][C]9 seconds[/C][/ROW]
[ROW][C]R Server[/C][C]'Gwilym Jenkins' @ 72.249.127.135[/C][/ROW]
[/TABLE]
Source: https://freestatistics.org/blog/index.php?pk=71266&T=0

Globally Unique Identifier (entire table): ba.freestatistics.org/blog/index.php?pk=71266&T=0

As an alternative you can also use a QR Code:  

The GUIDs for individual cells are displayed in the table below:

Summary of computational transaction
Raw Inputview raw input (R code)
Raw Outputview raw output of R engine
Computing time9 seconds
R Server'Gwilym Jenkins' @ 72.249.127.135


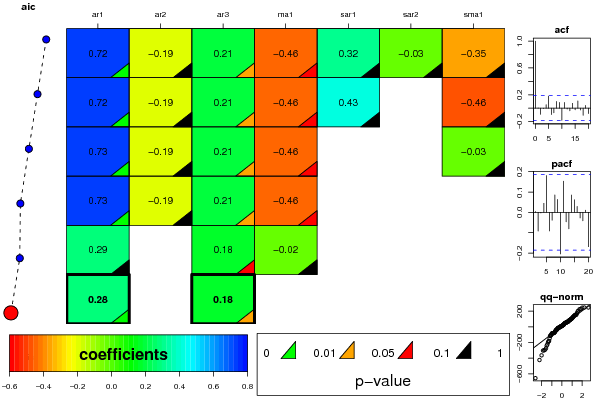
ARIMA Parameter Estimation and Backward Selection
Iterationar1ar2ar3ma1sar1sar2sma1
Estimates ( 1 )0.7246-0.19490.2114-0.45880.3214-0.0258-0.3516
(p-val)(0.0078 )(0.1431 )(0.034 )(0.087 )(0.7923 )(0.8452 )(0.7735 )
Estimates ( 2 )0.7247-0.19390.2118-0.4570.42590-0.4615
(p-val)(0.0076 )(0.1453 )(0.034 )(0.0872 )(0.7259 )(NA )(0.7015 )
Estimates ( 3 )0.7264-0.19210.2101-0.457100-0.0296
(p-val)(0.0075 )(0.1497 )(0.0356 )(0.0874 )(NA )(NA )(0.7714 )
Estimates ( 4 )0.7265-0.18780.2054-0.4588000
(p-val)(0.008 )(0.1572 )(0.0377 )(0.0886 )(NA )(NA )(NA )
Estimates ( 5 )0.293700.1811-0.0207000
(p-val)(0.4916 )(NA )(0.0524 )(0.9674 )(NA )(NA )(NA )
Estimates ( 6 )0.276600.1820000
(p-val)(0.0024 )(NA )(0.0437 )(NA )(NA )(NA )(NA )
Estimates ( 7 )NANANANANANANA
(p-val)(NA )(NA )(NA )(NA )(NA )(NA )(NA )
Estimates ( 8 )NANANANANANANA
(p-val)(NA )(NA )(NA )(NA )(NA )(NA )(NA )
Estimates ( 9 )NANANANANANANA
(p-val)(NA )(NA )(NA )(NA )(NA )(NA )(NA )
Estimates ( 10 )NANANANANANANA
(p-val)(NA )(NA )(NA )(NA )(NA )(NA )(NA )
Estimates ( 11 )NANANANANANANA
(p-val)(NA )(NA )(NA )(NA )(NA )(NA )(NA )
Estimates ( 12 )NANANANANANANA
(p-val)(NA )(NA )(NA )(NA )(NA )(NA )(NA )
Estimates ( 13 )NANANANANANANA
(p-val)(NA )(NA )(NA )(NA )(NA )(NA )(NA )

\begin{tabular}{lllllllll}
\hline
ARIMA Parameter Estimation and Backward Selection \tabularnewline
Iteration & ar1 & ar2 & ar3 & ma1 & sar1 & sar2 & sma1 \tabularnewline
Estimates ( 1 ) & 0.7246 & -0.1949 & 0.2114 & -0.4588 & 0.3214 & -0.0258 & -0.3516 \tabularnewline
(p-val) & (0.0078 ) & (0.1431 ) & (0.034 ) & (0.087 ) & (0.7923 ) & (0.8452 ) & (0.7735 ) \tabularnewline
Estimates ( 2 ) & 0.7247 & -0.1939 & 0.2118 & -0.457 & 0.4259 & 0 & -0.4615 \tabularnewline
(p-val) & (0.0076 ) & (0.1453 ) & (0.034 ) & (0.0872 ) & (0.7259 ) & (NA ) & (0.7015 ) \tabularnewline
Estimates ( 3 ) & 0.7264 & -0.1921 & 0.2101 & -0.4571 & 0 & 0 & -0.0296 \tabularnewline
(p-val) & (0.0075 ) & (0.1497 ) & (0.0356 ) & (0.0874 ) & (NA ) & (NA ) & (0.7714 ) \tabularnewline
Estimates ( 4 ) & 0.7265 & -0.1878 & 0.2054 & -0.4588 & 0 & 0 & 0 \tabularnewline
(p-val) & (0.008 ) & (0.1572 ) & (0.0377 ) & (0.0886 ) & (NA ) & (NA ) & (NA ) \tabularnewline
Estimates ( 5 ) & 0.2937 & 0 & 0.1811 & -0.0207 & 0 & 0 & 0 \tabularnewline
(p-val) & (0.4916 ) & (NA ) & (0.0524 ) & (0.9674 ) & (NA ) & (NA ) & (NA ) \tabularnewline
Estimates ( 6 ) & 0.2766 & 0 & 0.182 & 0 & 0 & 0 & 0 \tabularnewline
(p-val) & (0.0024 ) & (NA ) & (0.0437 ) & (NA ) & (NA ) & (NA ) & (NA ) \tabularnewline
Estimates ( 7 ) & NA & NA & NA & NA & NA & NA & NA \tabularnewline
(p-val) & (NA ) & (NA ) & (NA ) & (NA ) & (NA ) & (NA ) & (NA ) \tabularnewline
Estimates ( 8 ) & NA & NA & NA & NA & NA & NA & NA \tabularnewline
(p-val) & (NA ) & (NA ) & (NA ) & (NA ) & (NA ) & (NA ) & (NA ) \tabularnewline
Estimates ( 9 ) & NA & NA & NA & NA & NA & NA & NA \tabularnewline
(p-val) & (NA ) & (NA ) & (NA ) & (NA ) & (NA ) & (NA ) & (NA ) \tabularnewline
Estimates ( 10 ) & NA & NA & NA & NA & NA & NA & NA \tabularnewline
(p-val) & (NA ) & (NA ) & (NA ) & (NA ) & (NA ) & (NA ) & (NA ) \tabularnewline
Estimates ( 11 ) & NA & NA & NA & NA & NA & NA & NA \tabularnewline
(p-val) & (NA ) & (NA ) & (NA ) & (NA ) & (NA ) & (NA ) & (NA ) \tabularnewline
Estimates ( 12 ) & NA & NA & NA & NA & NA & NA & NA \tabularnewline
(p-val) & (NA ) & (NA ) & (NA ) & (NA ) & (NA ) & (NA ) & (NA ) \tabularnewline
Estimates ( 13 ) & NA & NA & NA & NA & NA & NA & NA \tabularnewline
(p-val) & (NA ) & (NA ) & (NA ) & (NA ) & (NA ) & (NA ) & (NA ) \tabularnewline
\hline
\end{tabular}
%Source: https://freestatistics.org/blog/index.php?pk=71266&T=1

[TABLE]
[ROW][C]ARIMA Parameter Estimation and Backward Selection[/C][/ROW]
[ROW][C]Iteration[/C][C]ar1[/C][C]ar2[/C][C]ar3[/C][C]ma1[/C][C]sar1[/C][C]sar2[/C][C]sma1[/C][/ROW]
[ROW][C]Estimates ( 1 )[/C][C]0.7246[/C][C]-0.1949[/C][C]0.2114[/C][C]-0.4588[/C][C]0.3214[/C][C]-0.0258[/C][C]-0.3516[/C][/ROW]
[ROW][C](p-val)[/C][C](0.0078 )[/C][C](0.1431 )[/C][C](0.034 )[/C][C](0.087 )[/C][C](0.7923 )[/C][C](0.8452 )[/C][C](0.7735 )[/C][/ROW]
[ROW][C]Estimates ( 2 )[/C][C]0.7247[/C][C]-0.1939[/C][C]0.2118[/C][C]-0.457[/C][C]0.4259[/C][C]0[/C][C]-0.4615[/C][/ROW]
[ROW][C](p-val)[/C][C](0.0076 )[/C][C](0.1453 )[/C][C](0.034 )[/C][C](0.0872 )[/C][C](0.7259 )[/C][C](NA )[/C][C](0.7015 )[/C][/ROW]
[ROW][C]Estimates ( 3 )[/C][C]0.7264[/C][C]-0.1921[/C][C]0.2101[/C][C]-0.4571[/C][C]0[/C][C]0[/C][C]-0.0296[/C][/ROW]
[ROW][C](p-val)[/C][C](0.0075 )[/C][C](0.1497 )[/C][C](0.0356 )[/C][C](0.0874 )[/C][C](NA )[/C][C](NA )[/C][C](0.7714 )[/C][/ROW]
[ROW][C]Estimates ( 4 )[/C][C]0.7265[/C][C]-0.1878[/C][C]0.2054[/C][C]-0.4588[/C][C]0[/C][C]0[/C][C]0[/C][/ROW]
[ROW][C](p-val)[/C][C](0.008 )[/C][C](0.1572 )[/C][C](0.0377 )[/C][C](0.0886 )[/C][C](NA )[/C][C](NA )[/C][C](NA )[/C][/ROW]
[ROW][C]Estimates ( 5 )[/C][C]0.2937[/C][C]0[/C][C]0.1811[/C][C]-0.0207[/C][C]0[/C][C]0[/C][C]0[/C][/ROW]
[ROW][C](p-val)[/C][C](0.4916 )[/C][C](NA )[/C][C](0.0524 )[/C][C](0.9674 )[/C][C](NA )[/C][C](NA )[/C][C](NA )[/C][/ROW]
[ROW][C]Estimates ( 6 )[/C][C]0.2766[/C][C]0[/C][C]0.182[/C][C]0[/C][C]0[/C][C]0[/C][C]0[/C][/ROW]
[ROW][C](p-val)[/C][C](0.0024 )[/C][C](NA )[/C][C](0.0437 )[/C][C](NA )[/C][C](NA )[/C][C](NA )[/C][C](NA )[/C][/ROW]
[ROW][C]Estimates ( 7 )[/C][C]NA[/C][C]NA[/C][C]NA[/C][C]NA[/C][C]NA[/C][C]NA[/C][C]NA[/C][/ROW]
[ROW][C](p-val)[/C][C](NA )[/C][C](NA )[/C][C](NA )[/C][C](NA )[/C][C](NA )[/C][C](NA )[/C][C](NA )[/C][/ROW]
[ROW][C]Estimates ( 8 )[/C][C]NA[/C][C]NA[/C][C]NA[/C][C]NA[/C][C]NA[/C][C]NA[/C][C]NA[/C][/ROW]
[ROW][C](p-val)[/C][C](NA )[/C][C](NA )[/C][C](NA )[/C][C](NA )[/C][C](NA )[/C][C](NA )[/C][C](NA )[/C][/ROW]
[ROW][C]Estimates ( 9 )[/C][C]NA[/C][C]NA[/C][C]NA[/C][C]NA[/C][C]NA[/C][C]NA[/C][C]NA[/C][/ROW]
[ROW][C](p-val)[/C][C](NA )[/C][C](NA )[/C][C](NA )[/C][C](NA )[/C][C](NA )[/C][C](NA )[/C][C](NA )[/C][/ROW]
[ROW][C]Estimates ( 10 )[/C][C]NA[/C][C]NA[/C][C]NA[/C][C]NA[/C][C]NA[/C][C]NA[/C][C]NA[/C][/ROW]
[ROW][C](p-val)[/C][C](NA )[/C][C](NA )[/C][C](NA )[/C][C](NA )[/C][C](NA )[/C][C](NA )[/C][C](NA )[/C][/ROW]
[ROW][C]Estimates ( 11 )[/C][C]NA[/C][C]NA[/C][C]NA[/C][C]NA[/C][C]NA[/C][C]NA[/C][C]NA[/C][/ROW]
[ROW][C](p-val)[/C][C](NA )[/C][C](NA )[/C][C](NA )[/C][C](NA )[/C][C](NA )[/C][C](NA )[/C][C](NA )[/C][/ROW]
[ROW][C]Estimates ( 12 )[/C][C]NA[/C][C]NA[/C][C]NA[/C][C]NA[/C][C]NA[/C][C]NA[/C][C]NA[/C][/ROW]
[ROW][C](p-val)[/C][C](NA )[/C][C](NA )[/C][C](NA )[/C][C](NA )[/C][C](NA )[/C][C](NA )[/C][C](NA )[/C][/ROW]
[ROW][C]Estimates ( 13 )[/C][C]NA[/C][C]NA[/C][C]NA[/C][C]NA[/C][C]NA[/C][C]NA[/C][C]NA[/C][/ROW]
[ROW][C](p-val)[/C][C](NA )[/C][C](NA )[/C][C](NA )[/C][C](NA )[/C][C](NA )[/C][C](NA )[/C][C](NA )[/C][/ROW]
[/TABLE]
Source: https://freestatistics.org/blog/index.php?pk=71266&T=1

Globally Unique Identifier (entire table): ba.freestatistics.org/blog/index.php?pk=71266&T=1

As an alternative you can also use a QR Code:  

The GUIDs for individual cells are displayed in the table below:

ARIMA Parameter Estimation and Backward Selection
Iterationar1ar2ar3ma1sar1sar2sma1
Estimates ( 1 )0.7246-0.19490.2114-0.45880.3214-0.0258-0.3516
(p-val)(0.0078 )(0.1431 )(0.034 )(0.087 )(0.7923 )(0.8452 )(0.7735 )
Estimates ( 2 )0.7247-0.19390.2118-0.4570.42590-0.4615
(p-val)(0.0076 )(0.1453 )(0.034 )(0.0872 )(0.7259 )(NA )(0.7015 )
Estimates ( 3 )0.7264-0.19210.2101-0.457100-0.0296
(p-val)(0.0075 )(0.1497 )(0.0356 )(0.0874 )(NA )(NA )(0.7714 )
Estimates ( 4 )0.7265-0.18780.2054-0.4588000
(p-val)(0.008 )(0.1572 )(0.0377 )(0.0886 )(NA )(NA )(NA )
Estimates ( 5 )0.293700.1811-0.0207000
(p-val)(0.4916 )(NA )(0.0524 )(0.9674 )(NA )(NA )(NA )
Estimates ( 6 )0.276600.1820000
(p-val)(0.0024 )(NA )(0.0437 )(NA )(NA )(NA )(NA )
Estimates ( 7 )NANANANANANANA
(p-val)(NA )(NA )(NA )(NA )(NA )(NA )(NA )
Estimates ( 8 )NANANANANANANA
(p-val)(NA )(NA )(NA )(NA )(NA )(NA )(NA )
Estimates ( 9 )NANANANANANANA
(p-val)(NA )(NA )(NA )(NA )(NA )(NA )(NA )
Estimates ( 10 )NANANANANANANA
(p-val)(NA )(NA )(NA )(NA )(NA )(NA )(NA )
Estimates ( 11 )NANANANANANANA
(p-val)(NA )(NA )(NA )(NA )(NA )(NA )(NA )
Estimates ( 12 )NANANANANANANA
(p-val)(NA )(NA )(NA )(NA )(NA )(NA )(NA )
Estimates ( 13 )NANANANANANANA
(p-val)(NA )(NA )(NA )(NA )(NA )(NA )(NA )


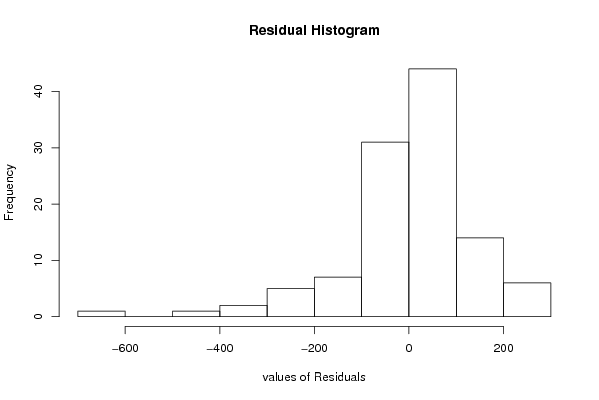
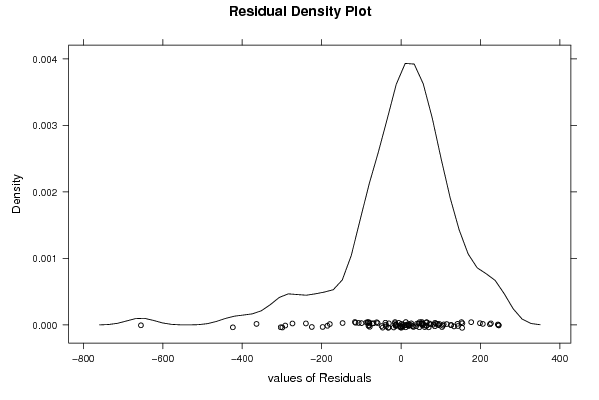
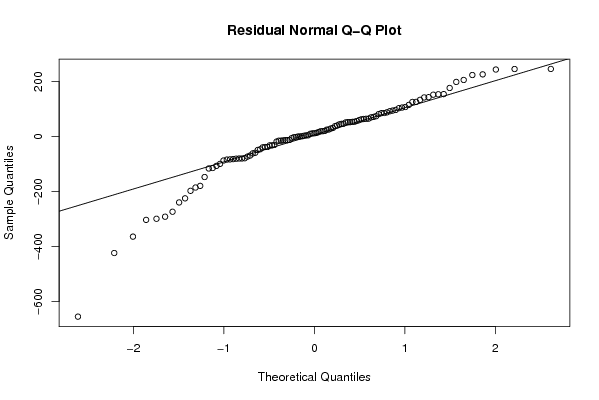
Estimated ARIMA Residuals
Value
3.03292826890205
12.0260515677640
59.7475455407064
-114.465065205481
-2.22693508199627
4.35951995596352
-147.147615338686
65.153572198053
-58.9442153086111
94.5064127441215
54.0497539166126
-31.9582830652207
-291.427228013426
103.210014980995
13.4184752845463
25.848767749962
81.7651411018169
0.0342656138418533
-13.8542282976155
63.9062793697858
-37.9084354029856
-239.488697273233
-197.314334937415
-18.3811532105201
-78.8708128245712
-37.8295732489139
153.835701431603
-46.2523335694268
-13.131794384233
-185.299119376881
-72.9117819276823
243.825225144514
56.6148178109725
51.4504706290238
-39.3475780548667
74.1339479106434
-2.27501727330446
16.1353440571070
29.3431180387506
1.19479122514349
142.274824521032
37.8895641544145
-61.2157143422046
44.3522168977665
-99.399814019555
69.8361993067019
-30.5517825502993
62.8935794195445
125.965949022935
71.5094060664719
52.3393013125101
19.3218862161034
19.4930838292207
64.6403579028697
-15.0861494969154
-5.69174869726749
-79.8892245215648
46.8017120289928
52.3915521634676
88.1573151431521
-12.8910808605979
0.555556031137257
46.017345842899
107.370226415589
133.534342762899
85.592463340406
40.2118083758105
-83.726149814921
-116.032498074396
-224.597367333123
198.730124441566
143.260275801969
105.426085784684
115.125784565585
-14.9411382270919
53.3217795102973
96.8611024849115
4.70669897899825
-179.314662214792
245.649258923567
31.3333205409763
-79.5796685631494
-80.4379200791709
-363.924056075888
205.939379895812
126.011618846088
-302.947102260051
85.1467909607727
-298.923496535926
10.0005383240823
-12.1778514262342
245.932788294570
-82.9134977046492
-273.362164089219
-423.468312216033
154.459638009162
-32.0064376545452
-654.887885136994
24.9943895258984
-81.9085187968208
223.842710037987
-69.0844660783794
-87.1663497407853
226.244015203884
152.276241081288
-48.8432924693116
11.6091732540151
176.746655051392
92.2077545126504
20.3296664845438
-106.660701819339

\begin{tabular}{lllllllll}
\hline
Estimated ARIMA Residuals \tabularnewline
Value \tabularnewline
3.03292826890205 \tabularnewline
12.0260515677640 \tabularnewline
59.7475455407064 \tabularnewline
-114.465065205481 \tabularnewline
-2.22693508199627 \tabularnewline
4.35951995596352 \tabularnewline
-147.147615338686 \tabularnewline
65.153572198053 \tabularnewline
-58.9442153086111 \tabularnewline
94.5064127441215 \tabularnewline
54.0497539166126 \tabularnewline
-31.9582830652207 \tabularnewline
-291.427228013426 \tabularnewline
103.210014980995 \tabularnewline
13.4184752845463 \tabularnewline
25.848767749962 \tabularnewline
81.7651411018169 \tabularnewline
0.0342656138418533 \tabularnewline
-13.8542282976155 \tabularnewline
63.9062793697858 \tabularnewline
-37.9084354029856 \tabularnewline
-239.488697273233 \tabularnewline
-197.314334937415 \tabularnewline
-18.3811532105201 \tabularnewline
-78.8708128245712 \tabularnewline
-37.8295732489139 \tabularnewline
153.835701431603 \tabularnewline
-46.2523335694268 \tabularnewline
-13.131794384233 \tabularnewline
-185.299119376881 \tabularnewline
-72.9117819276823 \tabularnewline
243.825225144514 \tabularnewline
56.6148178109725 \tabularnewline
51.4504706290238 \tabularnewline
-39.3475780548667 \tabularnewline
74.1339479106434 \tabularnewline
-2.27501727330446 \tabularnewline
16.1353440571070 \tabularnewline
29.3431180387506 \tabularnewline
1.19479122514349 \tabularnewline
142.274824521032 \tabularnewline
37.8895641544145 \tabularnewline
-61.2157143422046 \tabularnewline
44.3522168977665 \tabularnewline
-99.399814019555 \tabularnewline
69.8361993067019 \tabularnewline
-30.5517825502993 \tabularnewline
62.8935794195445 \tabularnewline
125.965949022935 \tabularnewline
71.5094060664719 \tabularnewline
52.3393013125101 \tabularnewline
19.3218862161034 \tabularnewline
19.4930838292207 \tabularnewline
64.6403579028697 \tabularnewline
-15.0861494969154 \tabularnewline
-5.69174869726749 \tabularnewline
-79.8892245215648 \tabularnewline
46.8017120289928 \tabularnewline
52.3915521634676 \tabularnewline
88.1573151431521 \tabularnewline
-12.8910808605979 \tabularnewline
0.555556031137257 \tabularnewline
46.017345842899 \tabularnewline
107.370226415589 \tabularnewline
133.534342762899 \tabularnewline
85.592463340406 \tabularnewline
40.2118083758105 \tabularnewline
-83.726149814921 \tabularnewline
-116.032498074396 \tabularnewline
-224.597367333123 \tabularnewline
198.730124441566 \tabularnewline
143.260275801969 \tabularnewline
105.426085784684 \tabularnewline
115.125784565585 \tabularnewline
-14.9411382270919 \tabularnewline
53.3217795102973 \tabularnewline
96.8611024849115 \tabularnewline
4.70669897899825 \tabularnewline
-179.314662214792 \tabularnewline
245.649258923567 \tabularnewline
31.3333205409763 \tabularnewline
-79.5796685631494 \tabularnewline
-80.4379200791709 \tabularnewline
-363.924056075888 \tabularnewline
205.939379895812 \tabularnewline
126.011618846088 \tabularnewline
-302.947102260051 \tabularnewline
85.1467909607727 \tabularnewline
-298.923496535926 \tabularnewline
10.0005383240823 \tabularnewline
-12.1778514262342 \tabularnewline
245.932788294570 \tabularnewline
-82.9134977046492 \tabularnewline
-273.362164089219 \tabularnewline
-423.468312216033 \tabularnewline
154.459638009162 \tabularnewline
-32.0064376545452 \tabularnewline
-654.887885136994 \tabularnewline
24.9943895258984 \tabularnewline
-81.9085187968208 \tabularnewline
223.842710037987 \tabularnewline
-69.0844660783794 \tabularnewline
-87.1663497407853 \tabularnewline
226.244015203884 \tabularnewline
152.276241081288 \tabularnewline
-48.8432924693116 \tabularnewline
11.6091732540151 \tabularnewline
176.746655051392 \tabularnewline
92.2077545126504 \tabularnewline
20.3296664845438 \tabularnewline
-106.660701819339 \tabularnewline
\hline
\end{tabular}
%Source: https://freestatistics.org/blog/index.php?pk=71266&T=2

[TABLE]
[ROW][C]Estimated ARIMA Residuals[/C][/ROW]
[ROW][C]Value[/C][/ROW]
[ROW][C]3.03292826890205[/C][/ROW]
[ROW][C]12.0260515677640[/C][/ROW]
[ROW][C]59.7475455407064[/C][/ROW]
[ROW][C]-114.465065205481[/C][/ROW]
[ROW][C]-2.22693508199627[/C][/ROW]
[ROW][C]4.35951995596352[/C][/ROW]
[ROW][C]-147.147615338686[/C][/ROW]
[ROW][C]65.153572198053[/C][/ROW]
[ROW][C]-58.9442153086111[/C][/ROW]
[ROW][C]94.5064127441215[/C][/ROW]
[ROW][C]54.0497539166126[/C][/ROW]
[ROW][C]-31.9582830652207[/C][/ROW]
[ROW][C]-291.427228013426[/C][/ROW]
[ROW][C]103.210014980995[/C][/ROW]
[ROW][C]13.4184752845463[/C][/ROW]
[ROW][C]25.848767749962[/C][/ROW]
[ROW][C]81.7651411018169[/C][/ROW]
[ROW][C]0.0342656138418533[/C][/ROW]
[ROW][C]-13.8542282976155[/C][/ROW]
[ROW][C]63.9062793697858[/C][/ROW]
[ROW][C]-37.9084354029856[/C][/ROW]
[ROW][C]-239.488697273233[/C][/ROW]
[ROW][C]-197.314334937415[/C][/ROW]
[ROW][C]-18.3811532105201[/C][/ROW]
[ROW][C]-78.8708128245712[/C][/ROW]
[ROW][C]-37.8295732489139[/C][/ROW]
[ROW][C]153.835701431603[/C][/ROW]
[ROW][C]-46.2523335694268[/C][/ROW]
[ROW][C]-13.131794384233[/C][/ROW]
[ROW][C]-185.299119376881[/C][/ROW]
[ROW][C]-72.9117819276823[/C][/ROW]
[ROW][C]243.825225144514[/C][/ROW]
[ROW][C]56.6148178109725[/C][/ROW]
[ROW][C]51.4504706290238[/C][/ROW]
[ROW][C]-39.3475780548667[/C][/ROW]
[ROW][C]74.1339479106434[/C][/ROW]
[ROW][C]-2.27501727330446[/C][/ROW]
[ROW][C]16.1353440571070[/C][/ROW]
[ROW][C]29.3431180387506[/C][/ROW]
[ROW][C]1.19479122514349[/C][/ROW]
[ROW][C]142.274824521032[/C][/ROW]
[ROW][C]37.8895641544145[/C][/ROW]
[ROW][C]-61.2157143422046[/C][/ROW]
[ROW][C]44.3522168977665[/C][/ROW]
[ROW][C]-99.399814019555[/C][/ROW]
[ROW][C]69.8361993067019[/C][/ROW]
[ROW][C]-30.5517825502993[/C][/ROW]
[ROW][C]62.8935794195445[/C][/ROW]
[ROW][C]125.965949022935[/C][/ROW]
[ROW][C]71.5094060664719[/C][/ROW]
[ROW][C]52.3393013125101[/C][/ROW]
[ROW][C]19.3218862161034[/C][/ROW]
[ROW][C]19.4930838292207[/C][/ROW]
[ROW][C]64.6403579028697[/C][/ROW]
[ROW][C]-15.0861494969154[/C][/ROW]
[ROW][C]-5.69174869726749[/C][/ROW]
[ROW][C]-79.8892245215648[/C][/ROW]
[ROW][C]46.8017120289928[/C][/ROW]
[ROW][C]52.3915521634676[/C][/ROW]
[ROW][C]88.1573151431521[/C][/ROW]
[ROW][C]-12.8910808605979[/C][/ROW]
[ROW][C]0.555556031137257[/C][/ROW]
[ROW][C]46.017345842899[/C][/ROW]
[ROW][C]107.370226415589[/C][/ROW]
[ROW][C]133.534342762899[/C][/ROW]
[ROW][C]85.592463340406[/C][/ROW]
[ROW][C]40.2118083758105[/C][/ROW]
[ROW][C]-83.726149814921[/C][/ROW]
[ROW][C]-116.032498074396[/C][/ROW]
[ROW][C]-224.597367333123[/C][/ROW]
[ROW][C]198.730124441566[/C][/ROW]
[ROW][C]143.260275801969[/C][/ROW]
[ROW][C]105.426085784684[/C][/ROW]
[ROW][C]115.125784565585[/C][/ROW]
[ROW][C]-14.9411382270919[/C][/ROW]
[ROW][C]53.3217795102973[/C][/ROW]
[ROW][C]96.8611024849115[/C][/ROW]
[ROW][C]4.70669897899825[/C][/ROW]
[ROW][C]-179.314662214792[/C][/ROW]
[ROW][C]245.649258923567[/C][/ROW]
[ROW][C]31.3333205409763[/C][/ROW]
[ROW][C]-79.5796685631494[/C][/ROW]
[ROW][C]-80.4379200791709[/C][/ROW]
[ROW][C]-363.924056075888[/C][/ROW]
[ROW][C]205.939379895812[/C][/ROW]
[ROW][C]126.011618846088[/C][/ROW]
[ROW][C]-302.947102260051[/C][/ROW]
[ROW][C]85.1467909607727[/C][/ROW]
[ROW][C]-298.923496535926[/C][/ROW]
[ROW][C]10.0005383240823[/C][/ROW]
[ROW][C]-12.1778514262342[/C][/ROW]
[ROW][C]245.932788294570[/C][/ROW]
[ROW][C]-82.9134977046492[/C][/ROW]
[ROW][C]-273.362164089219[/C][/ROW]
[ROW][C]-423.468312216033[/C][/ROW]
[ROW][C]154.459638009162[/C][/ROW]
[ROW][C]-32.0064376545452[/C][/ROW]
[ROW][C]-654.887885136994[/C][/ROW]
[ROW][C]24.9943895258984[/C][/ROW]
[ROW][C]-81.9085187968208[/C][/ROW]
[ROW][C]223.842710037987[/C][/ROW]
[ROW][C]-69.0844660783794[/C][/ROW]
[ROW][C]-87.1663497407853[/C][/ROW]
[ROW][C]226.244015203884[/C][/ROW]
[ROW][C]152.276241081288[/C][/ROW]
[ROW][C]-48.8432924693116[/C][/ROW]
[ROW][C]11.6091732540151[/C][/ROW]
[ROW][C]176.746655051392[/C][/ROW]
[ROW][C]92.2077545126504[/C][/ROW]
[ROW][C]20.3296664845438[/C][/ROW]
[ROW][C]-106.660701819339[/C][/ROW]
[/TABLE]
Source: https://freestatistics.org/blog/index.php?pk=71266&T=2

Globally Unique Identifier (entire table): ba.freestatistics.org/blog/index.php?pk=71266&T=2

As an alternative you can also use a QR Code:  

The GUIDs for individual cells are displayed in the table below:

Estimated ARIMA Residuals
Value
3.03292826890205
12.0260515677640
59.7475455407064
-114.465065205481
-2.22693508199627
4.35951995596352
-147.147615338686
65.153572198053
-58.9442153086111
94.5064127441215
54.0497539166126
-31.9582830652207
-291.427228013426
103.210014980995
13.4184752845463
25.848767749962
81.7651411018169
0.0342656138418533
-13.8542282976155
63.9062793697858
-37.9084354029856
-239.488697273233
-197.314334937415
-18.3811532105201
-78.8708128245712
-37.8295732489139
153.835701431603
-46.2523335694268
-13.131794384233
-185.299119376881
-72.9117819276823
243.825225144514
56.6148178109725
51.4504706290238
-39.3475780548667
74.1339479106434
-2.27501727330446
16.1353440571070
29.3431180387506
1.19479122514349
142.274824521032
37.8895641544145
-61.2157143422046
44.3522168977665
-99.399814019555
69.8361993067019
-30.5517825502993
62.8935794195445
125.965949022935
71.5094060664719
52.3393013125101
19.3218862161034
19.4930838292207
64.6403579028697
-15.0861494969154
-5.69174869726749
-79.8892245215648
46.8017120289928
52.3915521634676
88.1573151431521
-12.8910808605979
0.555556031137257
46.017345842899
107.370226415589
133.534342762899
85.592463340406
40.2118083758105
-83.726149814921
-116.032498074396
-224.597367333123
198.730124441566
143.260275801969
105.426085784684
115.125784565585
-14.9411382270919
53.3217795102973
96.8611024849115
4.70669897899825
-179.314662214792
245.649258923567
31.3333205409763
-79.5796685631494
-80.4379200791709
-363.924056075888
205.939379895812
126.011618846088
-302.947102260051
85.1467909607727
-298.923496535926
10.0005383240823
-12.1778514262342
245.932788294570
-82.9134977046492
-273.362164089219
-423.468312216033
154.459638009162
-32.0064376545452
-654.887885136994
24.9943895258984
-81.9085187968208
223.842710037987
-69.0844660783794
-87.1663497407853
226.244015203884
152.276241081288
-48.8432924693116
11.6091732540151
176.746655051392
92.2077545126504
20.3296664845438
-106.660701819339


Parameters (Session):
par1 = FALSE ; par2 = 1 ; par3 = 1 ; par4 = 0 ; par5 = 12 ; par6 = 3 ; par7 = 1 ; par8 = 2 ; par9 = 1 ;
Parameters (R input):
par1 = FALSE ; par2 = 1 ; par3 = 1 ; par4 = 0 ; par5 = 12 ; par6 = 3 ; par7 = 1 ; par8 = 2 ; par9 = 1 ;
R code (references can be found in the software module):
library(lattice)
if (par1 == 'TRUE') par1 <- TRUE
if (par1 == 'FALSE') par1 <- FALSE
par2 <- as.numeric(par2) #Box-Cox lambda transformation parameter
par3 <- as.numeric(par3) #degree of non-seasonal differencing
par4 <- as.numeric(par4) #degree of seasonal differencing
par5 <- as.numeric(par5) #seasonal period
par6 <- as.numeric(par6) #degree (p) of the non-seasonal AR(p) polynomial
par7 <- as.numeric(par7) #degree (q) of the non-seasonal MA(q) polynomial
par8 <- as.numeric(par8) #degree (P) of the seasonal AR(P) polynomial
par9 <- as.numeric(par9) #degree (Q) of the seasonal MA(Q) polynomial
armaGR <- function(arima.out, names, n){
try1 <- arima.out$coef
try2 <- sqrt(diag(arima.out$var.coef))
try.data.frame <- data.frame(matrix(NA,ncol=4,nrow=length(names)))
dimnames(try.data.frame) <- list(names,c('coef','std','tstat','pv'))
try.data.frame[,1] <- try1
for(i in 1:length(try2)) try.data.frame[which(rownames(try.data.frame)==names(try2)[i]),2] <- try2[i]
try.data.frame[,3] <- try.data.frame[,1] / try.data.frame[,2]
try.data.frame[,4] <- round((1-pt(abs(try.data.frame[,3]),df=n-(length(try2)+1)))*2,5)
vector <- rep(NA,length(names))
vector[is.na(try.data.frame[,4])] <- 0
maxi <- which.max(try.data.frame[,4])
continue <- max(try.data.frame[,4],na.rm=TRUE) > .05
vector[maxi] <- 0
list(summary=try.data.frame,next.vector=vector,continue=continue)
}
arimaSelect <- function(series, order=c(13,0,0), seasonal=list(order=c(2,0,0),period=12), include.mean=F){
nrc <- order[1]+order[3]+seasonal$order[1]+seasonal$order[3]
coeff <- matrix(NA, nrow=nrc*2, ncol=nrc)
pval <- matrix(NA, nrow=nrc*2, ncol=nrc)
mylist <- rep(list(NULL), nrc)
names <- NULL
if(order[1] > 0) names <- paste('ar',1:order[1],sep='')
if(order[3] > 0) names <- c( names , paste('ma',1:order[3],sep='') )
if(seasonal$order[1] > 0) names <- c(names, paste('sar',1:seasonal$order[1],sep=''))
if(seasonal$order[3] > 0) names <- c(names, paste('sma',1:seasonal$order[3],sep=''))
arima.out <- arima(series, order=order, seasonal=seasonal, include.mean=include.mean, method='ML')
mylist[[1]] <- arima.out
last.arma <- armaGR(arima.out, names, length(series))
mystop <- FALSE
i <- 1
coeff[i,] <- last.arma[[1]][,1]
pval [i,] <- last.arma[[1]][,4]
i <- 2
aic <- arima.out$aic
while(!mystop){
mylist[[i]] <- arima.out
arima.out <- arima(series, order=order, seasonal=seasonal, include.mean=include.mean, method='ML', fixed=last.arma$next.vector)
aic <- c(aic, arima.out$aic)
last.arma <- armaGR(arima.out, names, length(series))
mystop <- !last.arma$continue
coeff[i,] <- last.arma[[1]][,1]
pval [i,] <- last.arma[[1]][,4]
i <- i+1
}
list(coeff, pval, mylist, aic=aic)
}
arimaSelectplot <- function(arimaSelect.out,noms,choix){
noms <- names(arimaSelect.out[[3]][[1]]$coef)
coeff <- arimaSelect.out[[1]]
k <- min(which(is.na(coeff[,1])))-1
coeff <- coeff[1:k,]
pval <- arimaSelect.out[[2]][1:k,]
aic <- arimaSelect.out$aic[1:k]
coeff[coeff==0] <- NA
n <- ncol(coeff)
if(missing(choix)) choix <- k
layout(matrix(c(1,1,1,2,
3,3,3,2,
3,3,3,4,
5,6,7,7),nr=4),
widths=c(10,35,45,15),
heights=c(30,30,15,15))
couleurs <- rainbow(75)[1:50]#(50)
ticks <- pretty(coeff)
par(mar=c(1,1,3,1))
plot(aic,k:1-.5,type='o',pch=21,bg='blue',cex=2,axes=F,lty=2,xpd=NA)
points(aic[choix],k-choix+.5,pch=21,cex=4,bg=2,xpd=NA)
title('aic',line=2)
par(mar=c(3,0,0,0))
plot(0,axes=F,xlab='',ylab='',xlim=range(ticks),ylim=c(.1,1))
rect(xleft = min(ticks) + (0:49)/50*(max(ticks)-min(ticks)),
xright = min(ticks) + (1:50)/50*(max(ticks)-min(ticks)),
ytop = rep(1,50),
ybottom= rep(0,50),col=couleurs,border=NA)
axis(1,ticks)
rect(xleft=min(ticks),xright=max(ticks),ytop=1,ybottom=0)
text(mean(coeff,na.rm=T),.5,'coefficients',cex=2,font=2)
par(mar=c(1,1,3,1))
image(1:n,1:k,t(coeff[k:1,]),axes=F,col=couleurs,zlim=range(ticks))
for(i in 1:n) for(j in 1:k) if(!is.na(coeff[j,i])) {
if(pval[j,i]<.01) symb = 'green'
else if( (pval[j,i]<.05) & (pval[j,i]>=.01)) symb = 'orange'
else if( (pval[j,i]<.1) & (pval[j,i]>=.05)) symb = 'red'
else symb = 'black'
polygon(c(i+.5 ,i+.2 ,i+.5 ,i+.5),
c(k-j+0.5,k-j+0.5,k-j+0.8,k-j+0.5),
col=symb)
if(j==choix) {
rect(xleft=i-.5,
xright=i+.5,
ybottom=k-j+1.5,
ytop=k-j+.5,
lwd=4)
text(i,
k-j+1,
round(coeff[j,i],2),
cex=1.2,
font=2)
}
else{
rect(xleft=i-.5,xright=i+.5,ybottom=k-j+1.5,ytop=k-j+.5)
text(i,k-j+1,round(coeff[j,i],2),cex=1.2,font=1)
}
}
axis(3,1:n,noms)
par(mar=c(0.5,0,0,0.5))
plot(0,axes=F,xlab='',ylab='',type='n',xlim=c(0,8),ylim=c(-.2,.8))
cols <- c('green','orange','red','black')
niv <- c('0','0.01','0.05','0.1')
for(i in 0:3){
polygon(c(1+2*i ,1+2*i ,1+2*i-.5 ,1+2*i),
c(.4 ,.7 , .4 , .4),
col=cols[i+1])
text(2*i,0.5,niv[i+1],cex=1.5)
}
text(8,.5,1,cex=1.5)
text(4,0,'p-value',cex=2)
box()
residus <- arimaSelect.out[[3]][[choix]]$res
par(mar=c(1,2,4,1))
acf(residus,main='')
title('acf',line=.5)
par(mar=c(1,2,4,1))
pacf(residus,main='')
title('pacf',line=.5)
par(mar=c(2,2,4,1))
qqnorm(residus,main='')
title('qq-norm',line=.5)
qqline(residus)
residus
}
if (par2 == 0) x <- log(x)
if (par2 != 0) x <- x^par2
(selection <- arimaSelect(x, order=c(par6,par3,par7), seasonal=list(order=c(par8,par4,par9), period=par5)))
bitmap(file='test1.png')
resid <- arimaSelectplot(selection)
dev.off()
resid
bitmap(file='test2.png')
acf(resid,length(resid)/2, main='Residual Autocorrelation Function')
dev.off()
bitmap(file='test3.png')
pacf(resid,length(resid)/2, main='Residual Partial Autocorrelation Function')
dev.off()
bitmap(file='test4.png')
cpgram(resid, main='Residual Cumulative Periodogram')
dev.off()
bitmap(file='test5.png')
hist(resid, main='Residual Histogram', xlab='values of Residuals')
dev.off()
bitmap(file='test6.png')
densityplot(~resid,col='black',main='Residual Density Plot', xlab='values of Residuals')
dev.off()
bitmap(file='test7.png')
qqnorm(resid, main='Residual Normal Q-Q Plot')
qqline(resid)
dev.off()
ncols <- length(selection[[1]][1,])
nrows <- length(selection[[2]][,1])-1
load(file='createtable')
a<-table.start()
a<-table.row.start(a)
a<-table.element(a,'ARIMA Parameter Estimation and Backward Selection', ncols+1,TRUE)
a<-table.row.end(a)
a<-table.row.start(a)
a<-table.element(a,'Iteration', header=TRUE)
for (i in 1:ncols) {
a<-table.element(a,names(selection[[3]][[1]]$coef)[i],header=TRUE)
}
a<-table.row.end(a)
for (j in 1:nrows) {
a<-table.row.start(a)
mydum <- 'Estimates ('
mydum <- paste(mydum,j)
mydum <- paste(mydum,')')
a<-table.element(a,mydum, header=TRUE)
for (i in 1:ncols) {
a<-table.element(a,round(selection[[1]][j,i],4))
}
a<-table.row.end(a)
a<-table.row.start(a)
a<-table.element(a,'(p-val)', header=TRUE)
for (i in 1:ncols) {
mydum <- '('
mydum <- paste(mydum,round(selection[[2]][j,i],4),sep='')
mydum <- paste(mydum,')')
a<-table.element(a,mydum)
}
a<-table.row.end(a)
}
a<-table.end(a)
table.save(a,file='mytable.tab')
a<-table.start()
a<-table.row.start(a)
a<-table.element(a,'Estimated ARIMA Residuals', 1,TRUE)
a<-table.row.end(a)
a<-table.row.start(a)
a<-table.element(a,'Value', 1,TRUE)
a<-table.row.end(a)
for (i in (par4*par5+par3):length(resid)) {
a<-table.row.start(a)
a<-table.element(a,resid[i])
a<-table.row.end(a)
}
a<-table.end(a)
table.save(a,file='mytable1.tab')