Free Statistics

of Irreproducible Research!

Author's title

Author*The author of this computation has been verified*
R Software Modulerwasp_autocorrelation.wasp
Title produced by software(Partial) Autocorrelation Function
Date of computationWed, 30 Dec 2009 04:52:31 -0700
Cite this page as followsStatistical Computations at FreeStatistics.org, Office for Research Development and Education, URL https://freestatistics.org/blog/index.php?v=date/2009/Dec/30/t1262174000ln4bbhq7lmsqdai.htm/, Retrieved Sun, 28 Apr 2024 20:38:43 +0000
Statistical Computations at FreeStatistics.org, Office for Research Development and Education, URL https://freestatistics.org/blog/index.php?pk=71254, Retrieved Sun, 28 Apr 2024 20:38:43 +0000
QR Codes:

Original text written by user:
IsPrivate?No (this computation is public)
User-defined keywords
Estimated Impact134
Family? (F = Feedback message, R = changed R code, M = changed R Module, P = changed Parameters, D = changed Data)
-       [(Partial) Autocorrelation Function] [paper diffacf wlh] [2009-12-30 11:52:31] [1b03feaac1d41902024770a37504c07f] [Current]
Feedback Forum

Post a new message
Dataseries X:
401
394
372
334
320
334
400
427
423
395
373
377
391
398
393
375
371
364
400
406
407
397
389
394
399
401
396
392
384
370
380
376
378
376
373
374
379
376
371
375
360
338
352
344
330
334
333
343
350
341
320
302
287
304
370
385
365
333
313
330
367


Summary of computational transaction
Raw Inputview raw input (R code)
Raw Outputview raw output of R engine
Computing time2 seconds
R Server'Gwilym Jenkins' @ 72.249.127.135

\begin{tabular}{lllllllll}
\hline
Summary of computational transaction \tabularnewline
Raw Input & view raw input (R code)  \tabularnewline
Raw Output & view raw output of R engine  \tabularnewline
Computing time & 2 seconds \tabularnewline
R Server & 'Gwilym Jenkins' @ 72.249.127.135 \tabularnewline
\hline
\end{tabular}
%Source: https://freestatistics.org/blog/index.php?pk=71254&T=0

[TABLE]
[ROW][C]Summary of computational transaction[/C][/ROW]
[ROW][C]Raw Input[/C][C]view raw input (R code) [/C][/ROW]
[ROW][C]Raw Output[/C][C]view raw output of R engine [/C][/ROW]
[ROW][C]Computing time[/C][C]2 seconds[/C][/ROW]
[ROW][C]R Server[/C][C]'Gwilym Jenkins' @ 72.249.127.135[/C][/ROW]
[/TABLE]
Source: https://freestatistics.org/blog/index.php?pk=71254&T=0

Globally Unique Identifier (entire table): ba.freestatistics.org/blog/index.php?pk=71254&T=0

As an alternative you can also use a QR Code:  

The GUIDs for individual cells are displayed in the table below:

Summary of computational transaction
Raw Inputview raw input (R code)
Raw Outputview raw output of R engine
Computing time2 seconds
R Server'Gwilym Jenkins' @ 72.249.127.135


Autocorrelation Function
Time lag kACF(k)T-STATP-value
10.3252172.22960.015296
2-0.232004-1.59050.059209
3-0.617769-4.23525.3e-05
4-0.412806-2.83010.003413
50.0242360.16620.434374
60.3706992.54140.0072
70.3040672.08460.021284
8-0.01122-0.07690.469507
9-0.162491-1.1140.135475
10-0.19513-1.33770.093709
110.0767340.52610.300659
120.0593180.40670.34305
130.0884670.60650.273552
140.0211320.14490.442716
15-0.060435-0.41430.340262
16-0.015541-0.10650.457801
17-0.046026-0.31550.376874
18-0.002408-0.01650.493451
19-0.055421-0.37990.352849
200.0873740.5990.276023
210.1128530.77370.221497
220.0402890.27620.391799
23-0.109259-0.7490.228783
24-0.182173-1.24890.10894
25-0.057875-0.39680.346665
260.1261180.86460.195818
270.2523021.72970.045124
28-0.00625-0.04290.483001
29-0.121588-0.83360.204372
30-0.23486-1.61010.057035
31-0.025384-0.1740.431297
320.1704361.16840.124259
330.2705691.85490.034943
340.0785860.53880.296299
35-0.199824-1.36990.08861
36-0.314486-2.1560.018117
37-0.148426-1.01760.157049
380.1395460.95670.171813
390.2361881.61920.056046
400.1606031.1010.138244
41-0.035259-0.24170.405022
42-0.116421-0.79810.214401
43-0.087468-0.59960.27581
44-0.010525-0.07220.471392
450.0111080.07620.469809
460.0052090.03570.485831
47NANANA
48NANANA
49NANANA
50NANANA
51NANANA
52NANANA
53NANANA
54NANANA
55NANANA
56NANANA
57NANANA
58NANANA
59NANANA
60NANANA

\begin{tabular}{lllllllll}
\hline
Autocorrelation Function \tabularnewline
Time lag k & ACF(k) & T-STAT & P-value \tabularnewline
1 & 0.325217 & 2.2296 & 0.015296 \tabularnewline
2 & -0.232004 & -1.5905 & 0.059209 \tabularnewline
3 & -0.617769 & -4.2352 & 5.3e-05 \tabularnewline
4 & -0.412806 & -2.8301 & 0.003413 \tabularnewline
5 & 0.024236 & 0.1662 & 0.434374 \tabularnewline
6 & 0.370699 & 2.5414 & 0.0072 \tabularnewline
7 & 0.304067 & 2.0846 & 0.021284 \tabularnewline
8 & -0.01122 & -0.0769 & 0.469507 \tabularnewline
9 & -0.162491 & -1.114 & 0.135475 \tabularnewline
10 & -0.19513 & -1.3377 & 0.093709 \tabularnewline
11 & 0.076734 & 0.5261 & 0.300659 \tabularnewline
12 & 0.059318 & 0.4067 & 0.34305 \tabularnewline
13 & 0.088467 & 0.6065 & 0.273552 \tabularnewline
14 & 0.021132 & 0.1449 & 0.442716 \tabularnewline
15 & -0.060435 & -0.4143 & 0.340262 \tabularnewline
16 & -0.015541 & -0.1065 & 0.457801 \tabularnewline
17 & -0.046026 & -0.3155 & 0.376874 \tabularnewline
18 & -0.002408 & -0.0165 & 0.493451 \tabularnewline
19 & -0.055421 & -0.3799 & 0.352849 \tabularnewline
20 & 0.087374 & 0.599 & 0.276023 \tabularnewline
21 & 0.112853 & 0.7737 & 0.221497 \tabularnewline
22 & 0.040289 & 0.2762 & 0.391799 \tabularnewline
23 & -0.109259 & -0.749 & 0.228783 \tabularnewline
24 & -0.182173 & -1.2489 & 0.10894 \tabularnewline
25 & -0.057875 & -0.3968 & 0.346665 \tabularnewline
26 & 0.126118 & 0.8646 & 0.195818 \tabularnewline
27 & 0.252302 & 1.7297 & 0.045124 \tabularnewline
28 & -0.00625 & -0.0429 & 0.483001 \tabularnewline
29 & -0.121588 & -0.8336 & 0.204372 \tabularnewline
30 & -0.23486 & -1.6101 & 0.057035 \tabularnewline
31 & -0.025384 & -0.174 & 0.431297 \tabularnewline
32 & 0.170436 & 1.1684 & 0.124259 \tabularnewline
33 & 0.270569 & 1.8549 & 0.034943 \tabularnewline
34 & 0.078586 & 0.5388 & 0.296299 \tabularnewline
35 & -0.199824 & -1.3699 & 0.08861 \tabularnewline
36 & -0.314486 & -2.156 & 0.018117 \tabularnewline
37 & -0.148426 & -1.0176 & 0.157049 \tabularnewline
38 & 0.139546 & 0.9567 & 0.171813 \tabularnewline
39 & 0.236188 & 1.6192 & 0.056046 \tabularnewline
40 & 0.160603 & 1.101 & 0.138244 \tabularnewline
41 & -0.035259 & -0.2417 & 0.405022 \tabularnewline
42 & -0.116421 & -0.7981 & 0.214401 \tabularnewline
43 & -0.087468 & -0.5996 & 0.27581 \tabularnewline
44 & -0.010525 & -0.0722 & 0.471392 \tabularnewline
45 & 0.011108 & 0.0762 & 0.469809 \tabularnewline
46 & 0.005209 & 0.0357 & 0.485831 \tabularnewline
47 & NA & NA & NA \tabularnewline
48 & NA & NA & NA \tabularnewline
49 & NA & NA & NA \tabularnewline
50 & NA & NA & NA \tabularnewline
51 & NA & NA & NA \tabularnewline
52 & NA & NA & NA \tabularnewline
53 & NA & NA & NA \tabularnewline
54 & NA & NA & NA \tabularnewline
55 & NA & NA & NA \tabularnewline
56 & NA & NA & NA \tabularnewline
57 & NA & NA & NA \tabularnewline
58 & NA & NA & NA \tabularnewline
59 & NA & NA & NA \tabularnewline
60 & NA & NA & NA \tabularnewline
\hline
\end{tabular}
%Source: https://freestatistics.org/blog/index.php?pk=71254&T=1

[TABLE]
[ROW][C]Autocorrelation Function[/C][/ROW]
[ROW][C]Time lag k[/C][C]ACF(k)[/C][C]T-STAT[/C][C]P-value[/C][/ROW]
[ROW][C]1[/C][C]0.325217[/C][C]2.2296[/C][C]0.015296[/C][/ROW]
[ROW][C]2[/C][C]-0.232004[/C][C]-1.5905[/C][C]0.059209[/C][/ROW]
[ROW][C]3[/C][C]-0.617769[/C][C]-4.2352[/C][C]5.3e-05[/C][/ROW]
[ROW][C]4[/C][C]-0.412806[/C][C]-2.8301[/C][C]0.003413[/C][/ROW]
[ROW][C]5[/C][C]0.024236[/C][C]0.1662[/C][C]0.434374[/C][/ROW]
[ROW][C]6[/C][C]0.370699[/C][C]2.5414[/C][C]0.0072[/C][/ROW]
[ROW][C]7[/C][C]0.304067[/C][C]2.0846[/C][C]0.021284[/C][/ROW]
[ROW][C]8[/C][C]-0.01122[/C][C]-0.0769[/C][C]0.469507[/C][/ROW]
[ROW][C]9[/C][C]-0.162491[/C][C]-1.114[/C][C]0.135475[/C][/ROW]
[ROW][C]10[/C][C]-0.19513[/C][C]-1.3377[/C][C]0.093709[/C][/ROW]
[ROW][C]11[/C][C]0.076734[/C][C]0.5261[/C][C]0.300659[/C][/ROW]
[ROW][C]12[/C][C]0.059318[/C][C]0.4067[/C][C]0.34305[/C][/ROW]
[ROW][C]13[/C][C]0.088467[/C][C]0.6065[/C][C]0.273552[/C][/ROW]
[ROW][C]14[/C][C]0.021132[/C][C]0.1449[/C][C]0.442716[/C][/ROW]
[ROW][C]15[/C][C]-0.060435[/C][C]-0.4143[/C][C]0.340262[/C][/ROW]
[ROW][C]16[/C][C]-0.015541[/C][C]-0.1065[/C][C]0.457801[/C][/ROW]
[ROW][C]17[/C][C]-0.046026[/C][C]-0.3155[/C][C]0.376874[/C][/ROW]
[ROW][C]18[/C][C]-0.002408[/C][C]-0.0165[/C][C]0.493451[/C][/ROW]
[ROW][C]19[/C][C]-0.055421[/C][C]-0.3799[/C][C]0.352849[/C][/ROW]
[ROW][C]20[/C][C]0.087374[/C][C]0.599[/C][C]0.276023[/C][/ROW]
[ROW][C]21[/C][C]0.112853[/C][C]0.7737[/C][C]0.221497[/C][/ROW]
[ROW][C]22[/C][C]0.040289[/C][C]0.2762[/C][C]0.391799[/C][/ROW]
[ROW][C]23[/C][C]-0.109259[/C][C]-0.749[/C][C]0.228783[/C][/ROW]
[ROW][C]24[/C][C]-0.182173[/C][C]-1.2489[/C][C]0.10894[/C][/ROW]
[ROW][C]25[/C][C]-0.057875[/C][C]-0.3968[/C][C]0.346665[/C][/ROW]
[ROW][C]26[/C][C]0.126118[/C][C]0.8646[/C][C]0.195818[/C][/ROW]
[ROW][C]27[/C][C]0.252302[/C][C]1.7297[/C][C]0.045124[/C][/ROW]
[ROW][C]28[/C][C]-0.00625[/C][C]-0.0429[/C][C]0.483001[/C][/ROW]
[ROW][C]29[/C][C]-0.121588[/C][C]-0.8336[/C][C]0.204372[/C][/ROW]
[ROW][C]30[/C][C]-0.23486[/C][C]-1.6101[/C][C]0.057035[/C][/ROW]
[ROW][C]31[/C][C]-0.025384[/C][C]-0.174[/C][C]0.431297[/C][/ROW]
[ROW][C]32[/C][C]0.170436[/C][C]1.1684[/C][C]0.124259[/C][/ROW]
[ROW][C]33[/C][C]0.270569[/C][C]1.8549[/C][C]0.034943[/C][/ROW]
[ROW][C]34[/C][C]0.078586[/C][C]0.5388[/C][C]0.296299[/C][/ROW]
[ROW][C]35[/C][C]-0.199824[/C][C]-1.3699[/C][C]0.08861[/C][/ROW]
[ROW][C]36[/C][C]-0.314486[/C][C]-2.156[/C][C]0.018117[/C][/ROW]
[ROW][C]37[/C][C]-0.148426[/C][C]-1.0176[/C][C]0.157049[/C][/ROW]
[ROW][C]38[/C][C]0.139546[/C][C]0.9567[/C][C]0.171813[/C][/ROW]
[ROW][C]39[/C][C]0.236188[/C][C]1.6192[/C][C]0.056046[/C][/ROW]
[ROW][C]40[/C][C]0.160603[/C][C]1.101[/C][C]0.138244[/C][/ROW]
[ROW][C]41[/C][C]-0.035259[/C][C]-0.2417[/C][C]0.405022[/C][/ROW]
[ROW][C]42[/C][C]-0.116421[/C][C]-0.7981[/C][C]0.214401[/C][/ROW]
[ROW][C]43[/C][C]-0.087468[/C][C]-0.5996[/C][C]0.27581[/C][/ROW]
[ROW][C]44[/C][C]-0.010525[/C][C]-0.0722[/C][C]0.471392[/C][/ROW]
[ROW][C]45[/C][C]0.011108[/C][C]0.0762[/C][C]0.469809[/C][/ROW]
[ROW][C]46[/C][C]0.005209[/C][C]0.0357[/C][C]0.485831[/C][/ROW]
[ROW][C]47[/C][C]NA[/C][C]NA[/C][C]NA[/C][/ROW]
[ROW][C]48[/C][C]NA[/C][C]NA[/C][C]NA[/C][/ROW]
[ROW][C]49[/C][C]NA[/C][C]NA[/C][C]NA[/C][/ROW]
[ROW][C]50[/C][C]NA[/C][C]NA[/C][C]NA[/C][/ROW]
[ROW][C]51[/C][C]NA[/C][C]NA[/C][C]NA[/C][/ROW]
[ROW][C]52[/C][C]NA[/C][C]NA[/C][C]NA[/C][/ROW]
[ROW][C]53[/C][C]NA[/C][C]NA[/C][C]NA[/C][/ROW]
[ROW][C]54[/C][C]NA[/C][C]NA[/C][C]NA[/C][/ROW]
[ROW][C]55[/C][C]NA[/C][C]NA[/C][C]NA[/C][/ROW]
[ROW][C]56[/C][C]NA[/C][C]NA[/C][C]NA[/C][/ROW]
[ROW][C]57[/C][C]NA[/C][C]NA[/C][C]NA[/C][/ROW]
[ROW][C]58[/C][C]NA[/C][C]NA[/C][C]NA[/C][/ROW]
[ROW][C]59[/C][C]NA[/C][C]NA[/C][C]NA[/C][/ROW]
[ROW][C]60[/C][C]NA[/C][C]NA[/C][C]NA[/C][/ROW]
[/TABLE]
Source: https://freestatistics.org/blog/index.php?pk=71254&T=1

Globally Unique Identifier (entire table): ba.freestatistics.org/blog/index.php?pk=71254&T=1

As an alternative you can also use a QR Code:  

The GUIDs for individual cells are displayed in the table below:

Autocorrelation Function
Time lag kACF(k)T-STATP-value
10.3252172.22960.015296
2-0.232004-1.59050.059209
3-0.617769-4.23525.3e-05
4-0.412806-2.83010.003413
50.0242360.16620.434374
60.3706992.54140.0072
70.3040672.08460.021284
8-0.01122-0.07690.469507
9-0.162491-1.1140.135475
10-0.19513-1.33770.093709
110.0767340.52610.300659
120.0593180.40670.34305
130.0884670.60650.273552
140.0211320.14490.442716
15-0.060435-0.41430.340262
16-0.015541-0.10650.457801
17-0.046026-0.31550.376874
18-0.002408-0.01650.493451
19-0.055421-0.37990.352849
200.0873740.5990.276023
210.1128530.77370.221497
220.0402890.27620.391799
23-0.109259-0.7490.228783
24-0.182173-1.24890.10894
25-0.057875-0.39680.346665
260.1261180.86460.195818
270.2523021.72970.045124
28-0.00625-0.04290.483001
29-0.121588-0.83360.204372
30-0.23486-1.61010.057035
31-0.025384-0.1740.431297
320.1704361.16840.124259
330.2705691.85490.034943
340.0785860.53880.296299
35-0.199824-1.36990.08861
36-0.314486-2.1560.018117
37-0.148426-1.01760.157049
380.1395460.95670.171813
390.2361881.61920.056046
400.1606031.1010.138244
41-0.035259-0.24170.405022
42-0.116421-0.79810.214401
43-0.087468-0.59960.27581
44-0.010525-0.07220.471392
450.0111080.07620.469809
460.0052090.03570.485831
47NANANA
48NANANA
49NANANA
50NANANA
51NANANA
52NANANA
53NANANA
54NANANA
55NANANA
56NANANA
57NANANA
58NANANA
59NANANA
60NANANA


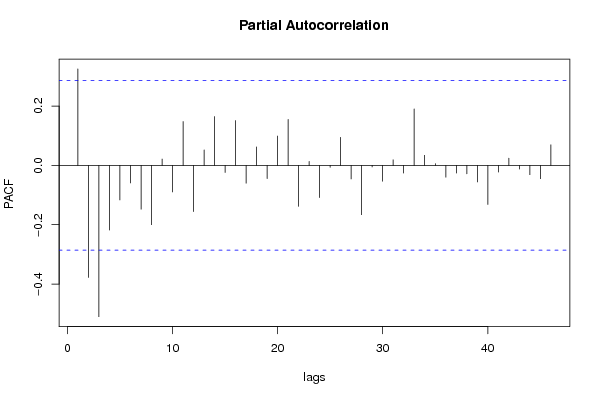
Partial Autocorrelation Function
Time lag kPACF(k)T-STATP-value
10.3252172.22960.015296
2-0.37772-2.58950.006377
3-0.509979-3.49620.000521
4-0.2182-1.49590.070682
5-0.116575-0.79920.214099
6-0.059295-0.40650.343107
7-0.147716-1.01270.158196
8-0.19981-1.36980.088625
90.0215960.14810.441467
10-0.089551-0.61390.271112
110.1478041.01330.158055
12-0.155462-1.06580.14598
130.0519890.35640.36156
140.1646891.1290.132304
15-0.023743-0.16280.435698
160.1512341.03680.152565
17-0.05979-0.40990.34187
180.0624520.42810.33525
19-0.044403-0.30440.381078
200.0989420.67830.250451
210.1551161.06340.146512
22-0.138064-0.94650.174362
230.0133830.09170.463644
24-0.10858-0.74440.230175
25-0.006342-0.04350.482753
260.094510.64790.260092
27-0.045827-0.31420.377391
28-0.166111-1.13880.130279
29-0.005322-0.03650.485525
30-0.053247-0.3650.358358
310.018780.12870.449053
32-0.025773-0.17670.430255
330.1904181.30540.099048
340.0338860.23230.408653
350.0055890.03830.4848
36-0.039646-0.27180.393483
37-0.025815-0.1770.430143
38-0.028547-0.19570.42284
39-0.055848-0.38290.35177
40-0.131728-0.90310.185544
41-0.022306-0.15290.439557
420.0242690.16640.434286
43-0.012551-0.0860.465899
44-0.031425-0.21540.41518
45-0.044728-0.30660.380235
460.06950.47650.317974
47NANANA
48NANANA
49NANANA
50NANANA
51NANANA
52NANANA
53NANANA
54NANANA
55NANANA
56NANANA
57NANANA
58NANANA
59NANANA
60NANANA

\begin{tabular}{lllllllll}
\hline
Partial Autocorrelation Function \tabularnewline
Time lag k & PACF(k) & T-STAT & P-value \tabularnewline
1 & 0.325217 & 2.2296 & 0.015296 \tabularnewline
2 & -0.37772 & -2.5895 & 0.006377 \tabularnewline
3 & -0.509979 & -3.4962 & 0.000521 \tabularnewline
4 & -0.2182 & -1.4959 & 0.070682 \tabularnewline
5 & -0.116575 & -0.7992 & 0.214099 \tabularnewline
6 & -0.059295 & -0.4065 & 0.343107 \tabularnewline
7 & -0.147716 & -1.0127 & 0.158196 \tabularnewline
8 & -0.19981 & -1.3698 & 0.088625 \tabularnewline
9 & 0.021596 & 0.1481 & 0.441467 \tabularnewline
10 & -0.089551 & -0.6139 & 0.271112 \tabularnewline
11 & 0.147804 & 1.0133 & 0.158055 \tabularnewline
12 & -0.155462 & -1.0658 & 0.14598 \tabularnewline
13 & 0.051989 & 0.3564 & 0.36156 \tabularnewline
14 & 0.164689 & 1.129 & 0.132304 \tabularnewline
15 & -0.023743 & -0.1628 & 0.435698 \tabularnewline
16 & 0.151234 & 1.0368 & 0.152565 \tabularnewline
17 & -0.05979 & -0.4099 & 0.34187 \tabularnewline
18 & 0.062452 & 0.4281 & 0.33525 \tabularnewline
19 & -0.044403 & -0.3044 & 0.381078 \tabularnewline
20 & 0.098942 & 0.6783 & 0.250451 \tabularnewline
21 & 0.155116 & 1.0634 & 0.146512 \tabularnewline
22 & -0.138064 & -0.9465 & 0.174362 \tabularnewline
23 & 0.013383 & 0.0917 & 0.463644 \tabularnewline
24 & -0.10858 & -0.7444 & 0.230175 \tabularnewline
25 & -0.006342 & -0.0435 & 0.482753 \tabularnewline
26 & 0.09451 & 0.6479 & 0.260092 \tabularnewline
27 & -0.045827 & -0.3142 & 0.377391 \tabularnewline
28 & -0.166111 & -1.1388 & 0.130279 \tabularnewline
29 & -0.005322 & -0.0365 & 0.485525 \tabularnewline
30 & -0.053247 & -0.365 & 0.358358 \tabularnewline
31 & 0.01878 & 0.1287 & 0.449053 \tabularnewline
32 & -0.025773 & -0.1767 & 0.430255 \tabularnewline
33 & 0.190418 & 1.3054 & 0.099048 \tabularnewline
34 & 0.033886 & 0.2323 & 0.408653 \tabularnewline
35 & 0.005589 & 0.0383 & 0.4848 \tabularnewline
36 & -0.039646 & -0.2718 & 0.393483 \tabularnewline
37 & -0.025815 & -0.177 & 0.430143 \tabularnewline
38 & -0.028547 & -0.1957 & 0.42284 \tabularnewline
39 & -0.055848 & -0.3829 & 0.35177 \tabularnewline
40 & -0.131728 & -0.9031 & 0.185544 \tabularnewline
41 & -0.022306 & -0.1529 & 0.439557 \tabularnewline
42 & 0.024269 & 0.1664 & 0.434286 \tabularnewline
43 & -0.012551 & -0.086 & 0.465899 \tabularnewline
44 & -0.031425 & -0.2154 & 0.41518 \tabularnewline
45 & -0.044728 & -0.3066 & 0.380235 \tabularnewline
46 & 0.0695 & 0.4765 & 0.317974 \tabularnewline
47 & NA & NA & NA \tabularnewline
48 & NA & NA & NA \tabularnewline
49 & NA & NA & NA \tabularnewline
50 & NA & NA & NA \tabularnewline
51 & NA & NA & NA \tabularnewline
52 & NA & NA & NA \tabularnewline
53 & NA & NA & NA \tabularnewline
54 & NA & NA & NA \tabularnewline
55 & NA & NA & NA \tabularnewline
56 & NA & NA & NA \tabularnewline
57 & NA & NA & NA \tabularnewline
58 & NA & NA & NA \tabularnewline
59 & NA & NA & NA \tabularnewline
60 & NA & NA & NA \tabularnewline
\hline
\end{tabular}
%Source: https://freestatistics.org/blog/index.php?pk=71254&T=2

[TABLE]
[ROW][C]Partial Autocorrelation Function[/C][/ROW]
[ROW][C]Time lag k[/C][C]PACF(k)[/C][C]T-STAT[/C][C]P-value[/C][/ROW]
[ROW][C]1[/C][C]0.325217[/C][C]2.2296[/C][C]0.015296[/C][/ROW]
[ROW][C]2[/C][C]-0.37772[/C][C]-2.5895[/C][C]0.006377[/C][/ROW]
[ROW][C]3[/C][C]-0.509979[/C][C]-3.4962[/C][C]0.000521[/C][/ROW]
[ROW][C]4[/C][C]-0.2182[/C][C]-1.4959[/C][C]0.070682[/C][/ROW]
[ROW][C]5[/C][C]-0.116575[/C][C]-0.7992[/C][C]0.214099[/C][/ROW]
[ROW][C]6[/C][C]-0.059295[/C][C]-0.4065[/C][C]0.343107[/C][/ROW]
[ROW][C]7[/C][C]-0.147716[/C][C]-1.0127[/C][C]0.158196[/C][/ROW]
[ROW][C]8[/C][C]-0.19981[/C][C]-1.3698[/C][C]0.088625[/C][/ROW]
[ROW][C]9[/C][C]0.021596[/C][C]0.1481[/C][C]0.441467[/C][/ROW]
[ROW][C]10[/C][C]-0.089551[/C][C]-0.6139[/C][C]0.271112[/C][/ROW]
[ROW][C]11[/C][C]0.147804[/C][C]1.0133[/C][C]0.158055[/C][/ROW]
[ROW][C]12[/C][C]-0.155462[/C][C]-1.0658[/C][C]0.14598[/C][/ROW]
[ROW][C]13[/C][C]0.051989[/C][C]0.3564[/C][C]0.36156[/C][/ROW]
[ROW][C]14[/C][C]0.164689[/C][C]1.129[/C][C]0.132304[/C][/ROW]
[ROW][C]15[/C][C]-0.023743[/C][C]-0.1628[/C][C]0.435698[/C][/ROW]
[ROW][C]16[/C][C]0.151234[/C][C]1.0368[/C][C]0.152565[/C][/ROW]
[ROW][C]17[/C][C]-0.05979[/C][C]-0.4099[/C][C]0.34187[/C][/ROW]
[ROW][C]18[/C][C]0.062452[/C][C]0.4281[/C][C]0.33525[/C][/ROW]
[ROW][C]19[/C][C]-0.044403[/C][C]-0.3044[/C][C]0.381078[/C][/ROW]
[ROW][C]20[/C][C]0.098942[/C][C]0.6783[/C][C]0.250451[/C][/ROW]
[ROW][C]21[/C][C]0.155116[/C][C]1.0634[/C][C]0.146512[/C][/ROW]
[ROW][C]22[/C][C]-0.138064[/C][C]-0.9465[/C][C]0.174362[/C][/ROW]
[ROW][C]23[/C][C]0.013383[/C][C]0.0917[/C][C]0.463644[/C][/ROW]
[ROW][C]24[/C][C]-0.10858[/C][C]-0.7444[/C][C]0.230175[/C][/ROW]
[ROW][C]25[/C][C]-0.006342[/C][C]-0.0435[/C][C]0.482753[/C][/ROW]
[ROW][C]26[/C][C]0.09451[/C][C]0.6479[/C][C]0.260092[/C][/ROW]
[ROW][C]27[/C][C]-0.045827[/C][C]-0.3142[/C][C]0.377391[/C][/ROW]
[ROW][C]28[/C][C]-0.166111[/C][C]-1.1388[/C][C]0.130279[/C][/ROW]
[ROW][C]29[/C][C]-0.005322[/C][C]-0.0365[/C][C]0.485525[/C][/ROW]
[ROW][C]30[/C][C]-0.053247[/C][C]-0.365[/C][C]0.358358[/C][/ROW]
[ROW][C]31[/C][C]0.01878[/C][C]0.1287[/C][C]0.449053[/C][/ROW]
[ROW][C]32[/C][C]-0.025773[/C][C]-0.1767[/C][C]0.430255[/C][/ROW]
[ROW][C]33[/C][C]0.190418[/C][C]1.3054[/C][C]0.099048[/C][/ROW]
[ROW][C]34[/C][C]0.033886[/C][C]0.2323[/C][C]0.408653[/C][/ROW]
[ROW][C]35[/C][C]0.005589[/C][C]0.0383[/C][C]0.4848[/C][/ROW]
[ROW][C]36[/C][C]-0.039646[/C][C]-0.2718[/C][C]0.393483[/C][/ROW]
[ROW][C]37[/C][C]-0.025815[/C][C]-0.177[/C][C]0.430143[/C][/ROW]
[ROW][C]38[/C][C]-0.028547[/C][C]-0.1957[/C][C]0.42284[/C][/ROW]
[ROW][C]39[/C][C]-0.055848[/C][C]-0.3829[/C][C]0.35177[/C][/ROW]
[ROW][C]40[/C][C]-0.131728[/C][C]-0.9031[/C][C]0.185544[/C][/ROW]
[ROW][C]41[/C][C]-0.022306[/C][C]-0.1529[/C][C]0.439557[/C][/ROW]
[ROW][C]42[/C][C]0.024269[/C][C]0.1664[/C][C]0.434286[/C][/ROW]
[ROW][C]43[/C][C]-0.012551[/C][C]-0.086[/C][C]0.465899[/C][/ROW]
[ROW][C]44[/C][C]-0.031425[/C][C]-0.2154[/C][C]0.41518[/C][/ROW]
[ROW][C]45[/C][C]-0.044728[/C][C]-0.3066[/C][C]0.380235[/C][/ROW]
[ROW][C]46[/C][C]0.0695[/C][C]0.4765[/C][C]0.317974[/C][/ROW]
[ROW][C]47[/C][C]NA[/C][C]NA[/C][C]NA[/C][/ROW]
[ROW][C]48[/C][C]NA[/C][C]NA[/C][C]NA[/C][/ROW]
[ROW][C]49[/C][C]NA[/C][C]NA[/C][C]NA[/C][/ROW]
[ROW][C]50[/C][C]NA[/C][C]NA[/C][C]NA[/C][/ROW]
[ROW][C]51[/C][C]NA[/C][C]NA[/C][C]NA[/C][/ROW]
[ROW][C]52[/C][C]NA[/C][C]NA[/C][C]NA[/C][/ROW]
[ROW][C]53[/C][C]NA[/C][C]NA[/C][C]NA[/C][/ROW]
[ROW][C]54[/C][C]NA[/C][C]NA[/C][C]NA[/C][/ROW]
[ROW][C]55[/C][C]NA[/C][C]NA[/C][C]NA[/C][/ROW]
[ROW][C]56[/C][C]NA[/C][C]NA[/C][C]NA[/C][/ROW]
[ROW][C]57[/C][C]NA[/C][C]NA[/C][C]NA[/C][/ROW]
[ROW][C]58[/C][C]NA[/C][C]NA[/C][C]NA[/C][/ROW]
[ROW][C]59[/C][C]NA[/C][C]NA[/C][C]NA[/C][/ROW]
[ROW][C]60[/C][C]NA[/C][C]NA[/C][C]NA[/C][/ROW]
[/TABLE]
Source: https://freestatistics.org/blog/index.php?pk=71254&T=2

Globally Unique Identifier (entire table): ba.freestatistics.org/blog/index.php?pk=71254&T=2

As an alternative you can also use a QR Code:  

The GUIDs for individual cells are displayed in the table below:

Partial Autocorrelation Function
Time lag kPACF(k)T-STATP-value
10.3252172.22960.015296
2-0.37772-2.58950.006377
3-0.509979-3.49620.000521
4-0.2182-1.49590.070682
5-0.116575-0.79920.214099
6-0.059295-0.40650.343107
7-0.147716-1.01270.158196
8-0.19981-1.36980.088625
90.0215960.14810.441467
10-0.089551-0.61390.271112
110.1478041.01330.158055
12-0.155462-1.06580.14598
130.0519890.35640.36156
140.1646891.1290.132304
15-0.023743-0.16280.435698
160.1512341.03680.152565
17-0.05979-0.40990.34187
180.0624520.42810.33525
19-0.044403-0.30440.381078
200.0989420.67830.250451
210.1551161.06340.146512
22-0.138064-0.94650.174362
230.0133830.09170.463644
24-0.10858-0.74440.230175
25-0.006342-0.04350.482753
260.094510.64790.260092
27-0.045827-0.31420.377391
28-0.166111-1.13880.130279
29-0.005322-0.03650.485525
30-0.053247-0.3650.358358
310.018780.12870.449053
32-0.025773-0.17670.430255
330.1904181.30540.099048
340.0338860.23230.408653
350.0055890.03830.4848
36-0.039646-0.27180.393483
37-0.025815-0.1770.430143
38-0.028547-0.19570.42284
39-0.055848-0.38290.35177
40-0.131728-0.90310.185544
41-0.022306-0.15290.439557
420.0242690.16640.434286
43-0.012551-0.0860.465899
44-0.031425-0.21540.41518
45-0.044728-0.30660.380235
460.06950.47650.317974
47NANANA
48NANANA
49NANANA
50NANANA
51NANANA
52NANANA
53NANANA
54NANANA
55NANANA
56NANANA
57NANANA
58NANANA
59NANANA
60NANANA


Parameters (Session):
par1 = 60 ; par2 = 1 ; par3 = 2 ; par4 = 1 ; par5 = 12 ; par6 = White Noise ; par7 = 0.95 ;
Parameters (R input):
par1 = 60 ; par2 = 1 ; par3 = 2 ; par4 = 1 ; par5 = 12 ; par6 = White Noise ; par7 = 0.95 ;
R code (references can be found in the software module):
if (par1 == 'Default') {
par1 = 10*log10(length(x))
} else {
par1 <- as.numeric(par1)
}
par2 <- as.numeric(par2)
par3 <- as.numeric(par3)
par4 <- as.numeric(par4)
par5 <- as.numeric(par5)
if (par6 == 'White Noise') par6 <- 'white' else par6 <- 'ma'
par7 <- as.numeric(par7)
if (par2 == 0) {
x <- log(x)
} else {
x <- (x ^ par2 - 1) / par2
}
if (par3 > 0) x <- diff(x,lag=1,difference=par3)
if (par4 > 0) x <- diff(x,lag=par5,difference=par4)
bitmap(file='pic1.png')
racf <- acf(x, par1, main='Autocorrelation', xlab='time lag', ylab='ACF', ci.type=par6, ci=par7, sub=paste('(lambda=',par2,', d=',par3,', D=',par4,', CI=', par7, ', CI type=',par6,')',sep=''))
dev.off()
bitmap(file='pic2.png')
rpacf <- pacf(x,par1,main='Partial Autocorrelation',xlab='lags',ylab='PACF')
dev.off()
(myacf <- c(racf$acf))
(mypacf <- c(rpacf$acf))
lengthx <- length(x)
sqrtn <- sqrt(lengthx)
load(file='createtable')
a<-table.start()
a<-table.row.start(a)
a<-table.element(a,'Autocorrelation Function',4,TRUE)
a<-table.row.end(a)
a<-table.row.start(a)
a<-table.element(a,'Time lag k',header=TRUE)
a<-table.element(a,hyperlink('basics.htm','ACF(k)','click here for more information about the Autocorrelation Function'),header=TRUE)
a<-table.element(a,'T-STAT',header=TRUE)
a<-table.element(a,'P-value',header=TRUE)
a<-table.row.end(a)
for (i in 2:(par1+1)) {
a<-table.row.start(a)
a<-table.element(a,i-1,header=TRUE)
a<-table.element(a,round(myacf[i],6))
mytstat <- myacf[i]*sqrtn
a<-table.element(a,round(mytstat,4))
a<-table.element(a,round(1-pt(abs(mytstat),lengthx),6))
a<-table.row.end(a)
}
a<-table.end(a)
table.save(a,file='mytable.tab')
a<-table.start()
a<-table.row.start(a)
a<-table.element(a,'Partial Autocorrelation Function',4,TRUE)
a<-table.row.end(a)
a<-table.row.start(a)
a<-table.element(a,'Time lag k',header=TRUE)
a<-table.element(a,hyperlink('basics.htm','PACF(k)','click here for more information about the Partial Autocorrelation Function'),header=TRUE)
a<-table.element(a,'T-STAT',header=TRUE)
a<-table.element(a,'P-value',header=TRUE)
a<-table.row.end(a)
for (i in 1:par1) {
a<-table.row.start(a)
a<-table.element(a,i,header=TRUE)
a<-table.element(a,round(mypacf[i],6))
mytstat <- mypacf[i]*sqrtn
a<-table.element(a,round(mytstat,4))
a<-table.element(a,round(1-pt(abs(mytstat),lengthx),6))
a<-table.row.end(a)
}
a<-table.end(a)
table.save(a,file='mytable1.tab')