Free Statistics

of Irreproducible Research!

Author's title

Author*The author of this computation has been verified*
R Software Modulerwasp_smp.wasp
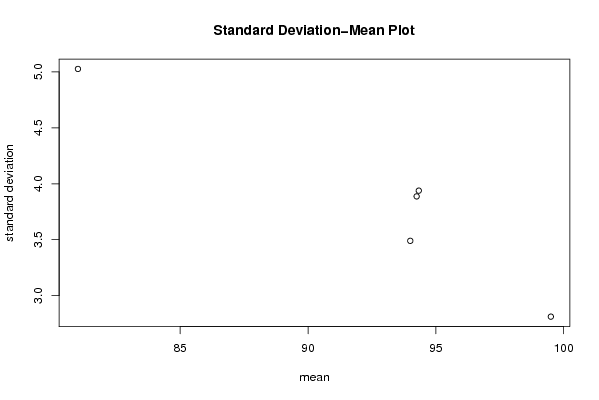
Title produced by softwareStandard Deviation-Mean Plot
Date of computationWed, 30 Dec 2009 02:26:44 -0700
Cite this page as followsStatistical Computations at FreeStatistics.org, Office for Research Development and Education, URL https://freestatistics.org/blog/index.php?v=date/2009/Dec/30/t1262165234r85yim48oi6vpal.htm/, Retrieved Sun, 28 Apr 2024 20:51:07 +0000
Statistical Computations at FreeStatistics.org, Office for Research Development and Education, URL https://freestatistics.org/blog/index.php?pk=71228, Retrieved Sun, 28 Apr 2024 20:51:07 +0000
QR Codes:

Original text written by user:
IsPrivate?No (this computation is public)
User-defined keywords
Estimated Impact134
Family? (F = Feedback message, R = changed R code, M = changed R Module, P = changed Parameters, D = changed Data)
-       [Standard Deviation-Mean Plot] [] [2009-12-30 09:26:44] [abbb6febea381ea822009ab8520873eb] [Current]
Feedback Forum

Post a new message
Dataseries X:
98
98
94
93
94
94
97
98
95
89
89
89
90
86
92
91
95
99
98
95
96
94
98
98
98
98
102
101
92
99
101
99
102
102
101
99
98
98
99
92
96
94
97
97
93
91
89
87
89
91
83
78
75
80
76
76
78
81
82
83
89
89
88
90


Summary of computational transaction
Raw Inputview raw input (R code)
Raw Outputview raw output of R engine
Computing time1 seconds
R Server'Gwilym Jenkins' @ 72.249.127.135

\begin{tabular}{lllllllll}
\hline
Summary of computational transaction \tabularnewline
Raw Input & view raw input (R code)  \tabularnewline
Raw Output & view raw output of R engine  \tabularnewline
Computing time & 1 seconds \tabularnewline
R Server & 'Gwilym Jenkins' @ 72.249.127.135 \tabularnewline
\hline
\end{tabular}
%Source: https://freestatistics.org/blog/index.php?pk=71228&T=0

[TABLE]
[ROW][C]Summary of computational transaction[/C][/ROW]
[ROW][C]Raw Input[/C][C]view raw input (R code) [/C][/ROW]
[ROW][C]Raw Output[/C][C]view raw output of R engine [/C][/ROW]
[ROW][C]Computing time[/C][C]1 seconds[/C][/ROW]
[ROW][C]R Server[/C][C]'Gwilym Jenkins' @ 72.249.127.135[/C][/ROW]
[/TABLE]
Source: https://freestatistics.org/blog/index.php?pk=71228&T=0

Globally Unique Identifier (entire table): ba.freestatistics.org/blog/index.php?pk=71228&T=0

As an alternative you can also use a QR Code:  

The GUIDs for individual cells are displayed in the table below:

Summary of computational transaction
Raw Inputview raw input (R code)
Raw Outputview raw output of R engine
Computing time1 seconds
R Server'Gwilym Jenkins' @ 72.249.127.135


Standard Deviation-Mean Plot
SectionMeanStandard DeviationRange
1943.490246149173189
294.33333333333333.9389277113386513
399.52.8123105996832810
494.253.8876260575878912
5815.0271987500721816

\begin{tabular}{lllllllll}
\hline
Standard Deviation-Mean Plot \tabularnewline
Section & Mean & Standard Deviation & Range \tabularnewline
1 & 94 & 3.49024614917318 & 9 \tabularnewline
2 & 94.3333333333333 & 3.93892771133865 & 13 \tabularnewline
3 & 99.5 & 2.81231059968328 & 10 \tabularnewline
4 & 94.25 & 3.88762605758789 & 12 \tabularnewline
5 & 81 & 5.02719875007218 & 16 \tabularnewline
\hline
\end{tabular}
%Source: https://freestatistics.org/blog/index.php?pk=71228&T=1

[TABLE]
[ROW][C]Standard Deviation-Mean Plot[/C][/ROW]
[ROW][C]Section[/C][C]Mean[/C][C]Standard Deviation[/C][C]Range[/C][/ROW]
[ROW][C]1[/C][C]94[/C][C]3.49024614917318[/C][C]9[/C][/ROW]
[ROW][C]2[/C][C]94.3333333333333[/C][C]3.93892771133865[/C][C]13[/C][/ROW]
[ROW][C]3[/C][C]99.5[/C][C]2.81231059968328[/C][C]10[/C][/ROW]
[ROW][C]4[/C][C]94.25[/C][C]3.88762605758789[/C][C]12[/C][/ROW]
[ROW][C]5[/C][C]81[/C][C]5.02719875007218[/C][C]16[/C][/ROW]
[/TABLE]
Source: https://freestatistics.org/blog/index.php?pk=71228&T=1

Globally Unique Identifier (entire table): ba.freestatistics.org/blog/index.php?pk=71228&T=1

As an alternative you can also use a QR Code:  

The GUIDs for individual cells are displayed in the table below:

Standard Deviation-Mean Plot
SectionMeanStandard DeviationRange
1943.490246149173189
294.33333333333333.9389277113386513
399.52.8123105996832810
494.253.8876260575878912
5815.0271987500721816


Regression: S.E.(k) = alpha + beta * Mean(k)
alpha14.1251101265887
beta-0.11114466373602
S.D.0.0211290601692504
T-STAT-5.26027484638297
p-value0.0133857495084881

\begin{tabular}{lllllllll}
\hline
Regression: S.E.(k) = alpha + beta * Mean(k) \tabularnewline
alpha & 14.1251101265887 \tabularnewline
beta & -0.11114466373602 \tabularnewline
S.D. & 0.0211290601692504 \tabularnewline
T-STAT & -5.26027484638297 \tabularnewline
p-value & 0.0133857495084881 \tabularnewline
\hline
\end{tabular}
%Source: https://freestatistics.org/blog/index.php?pk=71228&T=2

[TABLE]
[ROW][C]Regression: S.E.(k) = alpha + beta * Mean(k)[/C][/ROW]
[ROW][C]alpha[/C][C]14.1251101265887[/C][/ROW]
[ROW][C]beta[/C][C]-0.11114466373602[/C][/ROW]
[ROW][C]S.D.[/C][C]0.0211290601692504[/C][/ROW]
[ROW][C]T-STAT[/C][C]-5.26027484638297[/C][/ROW]
[ROW][C]p-value[/C][C]0.0133857495084881[/C][/ROW]
[/TABLE]
Source: https://freestatistics.org/blog/index.php?pk=71228&T=2

Globally Unique Identifier (entire table): ba.freestatistics.org/blog/index.php?pk=71228&T=2

As an alternative you can also use a QR Code:  

The GUIDs for individual cells are displayed in the table below:

Regression: S.E.(k) = alpha + beta * Mean(k)
alpha14.1251101265887
beta-0.11114466373602
S.D.0.0211290601692504
T-STAT-5.26027484638297
p-value0.0133857495084881


Regression: ln S.E.(k) = alpha + beta * ln Mean(k)
alpha12.5572592850097
beta-2.48153083210511
S.D.0.647547552311832
T-STAT-3.83219861343882
p-value0.0313139234280883
Lambda3.48153083210511

\begin{tabular}{lllllllll}
\hline
Regression: ln S.E.(k) = alpha + beta * ln Mean(k) \tabularnewline
alpha & 12.5572592850097 \tabularnewline
beta & -2.48153083210511 \tabularnewline
S.D. & 0.647547552311832 \tabularnewline
T-STAT & -3.83219861343882 \tabularnewline
p-value & 0.0313139234280883 \tabularnewline
Lambda & 3.48153083210511 \tabularnewline
\hline
\end{tabular}
%Source: https://freestatistics.org/blog/index.php?pk=71228&T=3

[TABLE]
[ROW][C]Regression: ln S.E.(k) = alpha + beta * ln Mean(k)[/C][/ROW]
[ROW][C]alpha[/C][C]12.5572592850097[/C][/ROW]
[ROW][C]beta[/C][C]-2.48153083210511[/C][/ROW]
[ROW][C]S.D.[/C][C]0.647547552311832[/C][/ROW]
[ROW][C]T-STAT[/C][C]-3.83219861343882[/C][/ROW]
[ROW][C]p-value[/C][C]0.0313139234280883[/C][/ROW]
[ROW][C]Lambda[/C][C]3.48153083210511[/C][/ROW]
[/TABLE]
Source: https://freestatistics.org/blog/index.php?pk=71228&T=3

Globally Unique Identifier (entire table): ba.freestatistics.org/blog/index.php?pk=71228&T=3

As an alternative you can also use a QR Code:  

The GUIDs for individual cells are displayed in the table below:

Regression: ln S.E.(k) = alpha + beta * ln Mean(k)
alpha12.5572592850097
beta-2.48153083210511
S.D.0.647547552311832
T-STAT-3.83219861343882
p-value0.0313139234280883
Lambda3.48153083210511


Parameters (Session):
par1 = 12 ;
Parameters (R input):
par1 = 12 ;
R code (references can be found in the software module):
par1 <- as.numeric(par1)
(n <- length(x))
(np <- floor(n / par1))
arr <- array(NA,dim=c(par1,np))
j <- 0
k <- 1
for (i in 1:(np*par1))
{
j = j + 1
arr[j,k] <- x[i]
if (j == par1) {
j = 0
k=k+1
}
}
arr
arr.mean <- array(NA,dim=np)
arr.sd <- array(NA,dim=np)
arr.range <- array(NA,dim=np)
for (j in 1:np)
{
arr.mean[j] <- mean(arr[,j],na.rm=TRUE)
arr.sd[j] <- sd(arr[,j],na.rm=TRUE)
arr.range[j] <- max(arr[,j],na.rm=TRUE) - min(arr[,j],na.rm=TRUE)
}
arr.mean
arr.sd
arr.range
(lm1 <- lm(arr.sd~arr.mean))
(lnlm1 <- lm(log(arr.sd)~log(arr.mean)))
(lm2 <- lm(arr.range~arr.mean))
bitmap(file='test1.png')
plot(arr.mean,arr.sd,main='Standard Deviation-Mean Plot',xlab='mean',ylab='standard deviation')
dev.off()
bitmap(file='test2.png')
plot(arr.mean,arr.range,main='Range-Mean Plot',xlab='mean',ylab='range')
dev.off()
load(file='createtable')
a<-table.start()
a<-table.row.start(a)
a<-table.element(a,'Standard Deviation-Mean Plot',4,TRUE)
a<-table.row.end(a)
a<-table.row.start(a)
a<-table.element(a,'Section',header=TRUE)
a<-table.element(a,'Mean',header=TRUE)
a<-table.element(a,'Standard Deviation',header=TRUE)
a<-table.element(a,'Range',header=TRUE)
a<-table.row.end(a)
for (j in 1:np) {
a<-table.row.start(a)
a<-table.element(a,j,header=TRUE)
a<-table.element(a,arr.mean[j])
a<-table.element(a,arr.sd[j] )
a<-table.element(a,arr.range[j] )
a<-table.row.end(a)
}
a<-table.end(a)
table.save(a,file='mytable.tab')
a<-table.start()
a<-table.row.start(a)
a<-table.element(a,'Regression: S.E.(k) = alpha + beta * Mean(k)',2,TRUE)
a<-table.row.end(a)
a<-table.row.start(a)
a<-table.element(a,'alpha',header=TRUE)
a<-table.element(a,lm1$coefficients[[1]])
a<-table.row.end(a)
a<-table.row.start(a)
a<-table.element(a,'beta',header=TRUE)
a<-table.element(a,lm1$coefficients[[2]])
a<-table.row.end(a)
a<-table.row.start(a)
a<-table.element(a,'S.D.',header=TRUE)
a<-table.element(a,summary(lm1)$coefficients[2,2])
a<-table.row.end(a)
a<-table.row.start(a)
a<-table.element(a,'T-STAT',header=TRUE)
a<-table.element(a,summary(lm1)$coefficients[2,3])
a<-table.row.end(a)
a<-table.row.start(a)
a<-table.element(a,'p-value',header=TRUE)
a<-table.element(a,summary(lm1)$coefficients[2,4])
a<-table.row.end(a)
a<-table.end(a)
table.save(a,file='mytable1.tab')
a<-table.start()
a<-table.row.start(a)
a<-table.element(a,'Regression: ln S.E.(k) = alpha + beta * ln Mean(k)',2,TRUE)
a<-table.row.end(a)
a<-table.row.start(a)
a<-table.element(a,'alpha',header=TRUE)
a<-table.element(a,lnlm1$coefficients[[1]])
a<-table.row.end(a)
a<-table.row.start(a)
a<-table.element(a,'beta',header=TRUE)
a<-table.element(a,lnlm1$coefficients[[2]])
a<-table.row.end(a)
a<-table.row.start(a)
a<-table.element(a,'S.D.',header=TRUE)
a<-table.element(a,summary(lnlm1)$coefficients[2,2])
a<-table.row.end(a)
a<-table.row.start(a)
a<-table.element(a,'T-STAT',header=TRUE)
a<-table.element(a,summary(lnlm1)$coefficients[2,3])
a<-table.row.end(a)
a<-table.row.start(a)
a<-table.element(a,'p-value',header=TRUE)
a<-table.element(a,summary(lnlm1)$coefficients[2,4])
a<-table.row.end(a)
a<-table.row.start(a)
a<-table.element(a,'Lambda',header=TRUE)
a<-table.element(a,1-lnlm1$coefficients[[2]])
a<-table.row.end(a)
a<-table.end(a)
table.save(a,file='mytable2.tab')