Free Statistics

of Irreproducible Research!

Author's title

Author*The author of this computation has been verified*
R Software Modulerwasp_edabi.wasp
Title produced by softwareBivariate Explorative Data Analysis
Date of computationTue, 29 Dec 2009 02:45:53 -0700
Cite this page as followsStatistical Computations at FreeStatistics.org, Office for Research Development and Education, URL https://freestatistics.org/blog/index.php?v=date/2009/Dec/29/t1262080000z1wvdw47pqjsxm7.htm/, Retrieved Fri, 03 May 2024 07:43:28 +0000
Statistical Computations at FreeStatistics.org, Office for Research Development and Education, URL https://freestatistics.org/blog/index.php?pk=71076, Retrieved Fri, 03 May 2024 07:43:28 +0000
QR Codes:

Original text written by user:
IsPrivate?No (this computation is public)
User-defined keywordsPaper
Estimated Impact146
Family? (F = Feedback message, R = changed R code, M = changed R Module, P = changed Parameters, D = changed Data)
-     [Trivariate Scatterplots] [SHW_WS5] [2009-10-29 16:26:54] [8b1aef4e7013bd33fbc2a5833375c5f5]
- RMPD  [Bivariate Explorative Data Analysis] [SHW_WS5] [2009-10-29 17:44:27] [8b1aef4e7013bd33fbc2a5833375c5f5]
- RM D      [Bivariate Explorative Data Analysis] [model_3] [2009-12-29 09:45:53] [5b5bced41faf164488f2c271c918b21f] [Current]
Feedback Forum

Post a new message
Dataseries X:
-50,74706514
-48,93785253
-47,15852374
-45,17543128
-46,94276659
-47,29735115
-42,25443623
-45,636011
-40,5706558
-34,94664303
-32,38276206
-32,7877051
-26,14063339
-22,09709979
-21,64764034
-16,98759233
-17,90735002
-15,42376615
-11,53425643
-13,32206639
-9,014273186
-4,253762759
-0,425986315
2,843751224
5,304276145
3,352359662
4,868775794
2,749804351
0,226872673
0,617183142
-0,16183631
0,436478416
2,548934314
6,596089819
10,3692672
9,720903334
12,32020087
12,14404607
12,94839943
13,76345412
16,31332119
16,81965467
15,68801627
17,19533256
18,78454744
24,92140923
27,36016736
27,69815372
30,48854798
30,43069115
30,29093572
28,97275052
27,2951215
25,22718201
26,17030799
25,74716525
29,830356
38,0397072
56,54216423
59,12713853
Dataseries Y:
-7,384479833
-348,812296
656,3387963
168,4268193
163,9341261
-219,1238071
131,7351533
68,87952107
-499,4813227
88,460018
-3,676899151
-250,2346886
174,1014888
-231,4249098
544,4571966
124,3024887
245,2234366
98,23681742
372,6587033
36,0872455
-337,1878898
-72,72145156
-121,8431801
-137,6524521
19,966092
-447,5428034
769,4438158
243,4453361
-164,2602175
454,3943467
-69,44942508
405,8522526
-358,8682021
-83,29905889
50,36917358
-94,12503992
-307,9726466
-171,4972374
581,7501227
244,4978459
74,07234434
218,1732414
41,97296758
230,9245802
-379,8087485
-230,0475763
-14,66583292
-134,2125562
-277,3250263
-389,3945325
682,2209027
-261,6970045
148,0023313
158,047103
-258,1716876
153,2005099
-667,3263955
-162,5924918
-58,96570282
-588,4092144


Summary of computational transaction
Raw Inputview raw input (R code)
Raw Outputview raw output of R engine
Computing time4 seconds
R Server'Gwilym Jenkins' @ 72.249.127.135

\begin{tabular}{lllllllll}
\hline
Summary of computational transaction \tabularnewline
Raw Input & view raw input (R code)  \tabularnewline
Raw Output & view raw output of R engine  \tabularnewline
Computing time & 4 seconds \tabularnewline
R Server & 'Gwilym Jenkins' @ 72.249.127.135 \tabularnewline
\hline
\end{tabular}
%Source: https://freestatistics.org/blog/index.php?pk=71076&T=0

[TABLE]
[ROW][C]Summary of computational transaction[/C][/ROW]
[ROW][C]Raw Input[/C][C]view raw input (R code) [/C][/ROW]
[ROW][C]Raw Output[/C][C]view raw output of R engine [/C][/ROW]
[ROW][C]Computing time[/C][C]4 seconds[/C][/ROW]
[ROW][C]R Server[/C][C]'Gwilym Jenkins' @ 72.249.127.135[/C][/ROW]
[/TABLE]
Source: https://freestatistics.org/blog/index.php?pk=71076&T=0

Globally Unique Identifier (entire table): ba.freestatistics.org/blog/index.php?pk=71076&T=0

As an alternative you can also use a QR Code:  

The GUIDs for individual cells are displayed in the table below:

Summary of computational transaction
Raw Inputview raw input (R code)
Raw Outputview raw output of R engine
Computing time4 seconds
R Server'Gwilym Jenkins' @ 72.249.127.135


Model: Y[t] = c + b X[t] + e[t]
c-2.27534584045291e-09
b-1.97826169300941

\begin{tabular}{lllllllll}
\hline
Model: Y[t] = c + b X[t] + e[t] \tabularnewline
c & -2.27534584045291e-09 \tabularnewline
b & -1.97826169300941 \tabularnewline
\hline
\end{tabular}
%Source: https://freestatistics.org/blog/index.php?pk=71076&T=1

[TABLE]
[ROW][C]Model: Y[t] = c + b X[t] + e[t][/C][/ROW]
[ROW][C]c[/C][C]-2.27534584045291e-09[/C][/ROW]
[ROW][C]b[/C][C]-1.97826169300941[/C][/ROW]
[/TABLE]
Source: https://freestatistics.org/blog/index.php?pk=71076&T=1

Globally Unique Identifier (entire table): ba.freestatistics.org/blog/index.php?pk=71076&T=1

As an alternative you can also use a QR Code:  

The GUIDs for individual cells are displayed in the table below:

Model: Y[t] = c + b X[t] + e[t]
c-2.27534584045291e-09
b-1.97826169300941


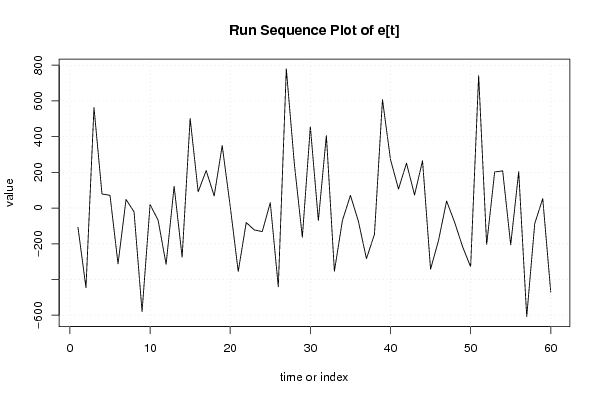
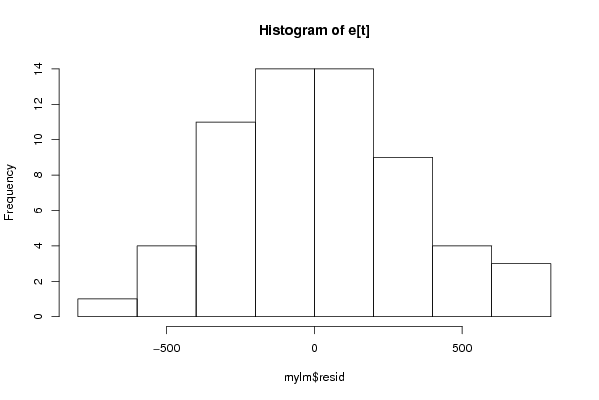
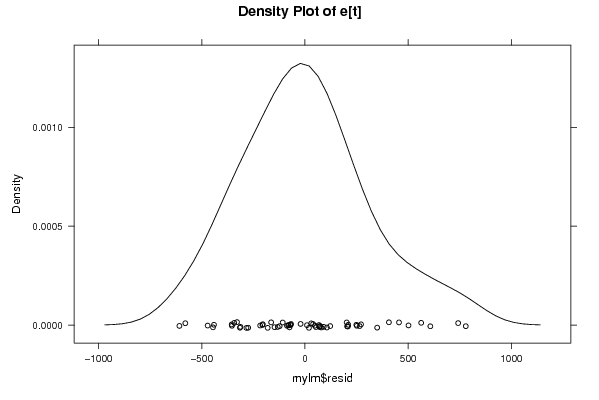
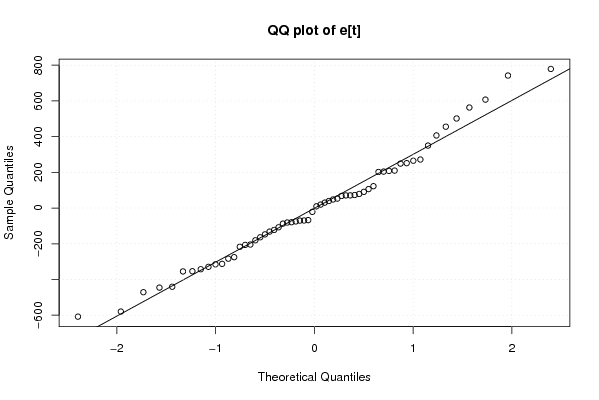
Descriptive Statistics about e[t]
# observations60
minimum-608.314144934091
Q1-204.88598395388
median-5.8338697097854
mean1.04143545639109e-14
Q3202.533203583806
maximum779.075528447397

\begin{tabular}{lllllllll}
\hline
Descriptive Statistics about e[t] \tabularnewline
# observations & 60 \tabularnewline
minimum & -608.314144934091 \tabularnewline
Q1 & -204.88598395388 \tabularnewline
median & -5.8338697097854 \tabularnewline
mean & 1.04143545639109e-14 \tabularnewline
Q3 & 202.533203583806 \tabularnewline
maximum & 779.075528447397 \tabularnewline
\hline
\end{tabular}
%Source: https://freestatistics.org/blog/index.php?pk=71076&T=2

[TABLE]
[ROW][C]Descriptive Statistics about e[t][/C][/ROW]
[ROW][C]# observations[/C][C]60[/C][/ROW]
[ROW][C]minimum[/C][C]-608.314144934091[/C][/ROW]
[ROW][C]Q1[/C][C]-204.88598395388[/C][/ROW]
[ROW][C]median[/C][C]-5.8338697097854[/C][/ROW]
[ROW][C]mean[/C][C]1.04143545639109e-14[/C][/ROW]
[ROW][C]Q3[/C][C]202.533203583806[/C][/ROW]
[ROW][C]maximum[/C][C]779.075528447397[/C][/ROW]
[/TABLE]
Source: https://freestatistics.org/blog/index.php?pk=71076&T=2

Globally Unique Identifier (entire table): ba.freestatistics.org/blog/index.php?pk=71076&T=2

As an alternative you can also use a QR Code:  

The GUIDs for individual cells are displayed in the table below:

Descriptive Statistics about e[t]
# observations60
minimum-608.314144934091
Q1-204.88598395388
median-5.8338697097854
mean1.04143545639109e-14
Q3202.533203583806
maximum779.075528447397


Parameters (Session):
par1 = 0 ; par2 = 36 ;
Parameters (R input):
par1 = 0 ; par2 = 36 ;
R code (references can be found in the software module):
par1 <- as.numeric(par1)
par2 <- as.numeric(par2)
x <- as.ts(x)
y <- as.ts(y)
mylm <- lm(y~x)
cbind(mylm$resid)
library(lattice)
bitmap(file='pic1.png')
plot(y,type='l',main='Run Sequence Plot of Y[t]',xlab='time or index',ylab='value')
grid()
dev.off()
bitmap(file='pic1a.png')
plot(x,type='l',main='Run Sequence Plot of X[t]',xlab='time or index',ylab='value')
grid()
dev.off()
bitmap(file='pic1b.png')
plot(x,y,main='Scatter Plot',xlab='X[t]',ylab='Y[t]')
grid()
dev.off()
bitmap(file='pic1c.png')
plot(mylm$resid,type='l',main='Run Sequence Plot of e[t]',xlab='time or index',ylab='value')
grid()
dev.off()
bitmap(file='pic2.png')
hist(mylm$resid,main='Histogram of e[t]')
dev.off()
bitmap(file='pic3.png')
if (par1 > 0)
{
densityplot(~mylm$resid,col='black',main=paste('Density Plot of e[t] bw = ',par1),bw=par1)
} else {
densityplot(~mylm$resid,col='black',main='Density Plot of e[t]')
}
dev.off()
bitmap(file='pic4.png')
qqnorm(mylm$resid,main='QQ plot of e[t]')
qqline(mylm$resid)
grid()
dev.off()
if (par2 > 0)
{
bitmap(file='pic5.png')
acf(mylm$resid,lag.max=par2,main='Residual Autocorrelation Function')
grid()
dev.off()
}
summary(x)
load(file='createtable')
a<-table.start()
a<-table.row.start(a)
a<-table.element(a,'Model: Y[t] = c + b X[t] + e[t]',2,TRUE)
a<-table.row.end(a)
a<-table.row.start(a)
a<-table.element(a,'c',1,TRUE)
a<-table.element(a,mylm$coeff[[1]])
a<-table.row.end(a)
a<-table.row.start(a)
a<-table.element(a,'b',1,TRUE)
a<-table.element(a,mylm$coeff[[2]])
a<-table.row.end(a)
a<-table.end(a)
table.save(a,file='mytable.tab')
a<-table.start()
a<-table.row.start(a)
a<-table.element(a,'Descriptive Statistics about e[t]',2,TRUE)
a<-table.row.end(a)
a<-table.row.start(a)
a<-table.element(a,'# observations',header=TRUE)
a<-table.element(a,length(mylm$resid))
a<-table.row.end(a)
a<-table.row.start(a)
a<-table.element(a,'minimum',header=TRUE)
a<-table.element(a,min(mylm$resid))
a<-table.row.end(a)
a<-table.row.start(a)
a<-table.element(a,'Q1',header=TRUE)
a<-table.element(a,quantile(mylm$resid,0.25))
a<-table.row.end(a)
a<-table.row.start(a)
a<-table.element(a,'median',header=TRUE)
a<-table.element(a,median(mylm$resid))
a<-table.row.end(a)
a<-table.row.start(a)
a<-table.element(a,'mean',header=TRUE)
a<-table.element(a,mean(mylm$resid))
a<-table.row.end(a)
a<-table.row.start(a)
a<-table.element(a,'Q3',header=TRUE)
a<-table.element(a,quantile(mylm$resid,0.75))
a<-table.row.end(a)
a<-table.row.start(a)
a<-table.element(a,'maximum',header=TRUE)
a<-table.element(a,max(mylm$resid))
a<-table.row.end(a)
a<-table.end(a)
table.save(a,file='mytable.tab')