Free Statistics

of Irreproducible Research!

Author's title

Author*The author of this computation has been verified*
R Software Modulerwasp_edabi.wasp
Title produced by softwareBivariate Explorative Data Analysis
Date of computationTue, 29 Dec 2009 02:39:08 -0700
Cite this page as followsStatistical Computations at FreeStatistics.org, Office for Research Development and Education, URL https://freestatistics.org/blog/index.php?v=date/2009/Dec/29/t1262079577fw68v0uta6r7egb.htm/, Retrieved Fri, 03 May 2024 09:32:05 +0000
Statistical Computations at FreeStatistics.org, Office for Research Development and Education, URL https://freestatistics.org/blog/index.php?pk=71074, Retrieved Fri, 03 May 2024 09:32:05 +0000
QR Codes:

Original text written by user:
IsPrivate?No (this computation is public)
User-defined keywordsPaper
Estimated Impact146
Family? (F = Feedback message, R = changed R code, M = changed R Module, P = changed Parameters, D = changed Data)
-     [Trivariate Scatterplots] [SHW_WS5] [2009-10-29 16:26:54] [8b1aef4e7013bd33fbc2a5833375c5f5]
- RMPD  [Bivariate Explorative Data Analysis] [SHW_WS5] [2009-10-29 17:44:27] [8b1aef4e7013bd33fbc2a5833375c5f5]
- RM D      [Bivariate Explorative Data Analysis] [model_3b] [2009-12-29 09:39:08] [5b5bced41faf164488f2c271c918b21f] [Current]
Feedback Forum

Post a new message
Dataseries X:
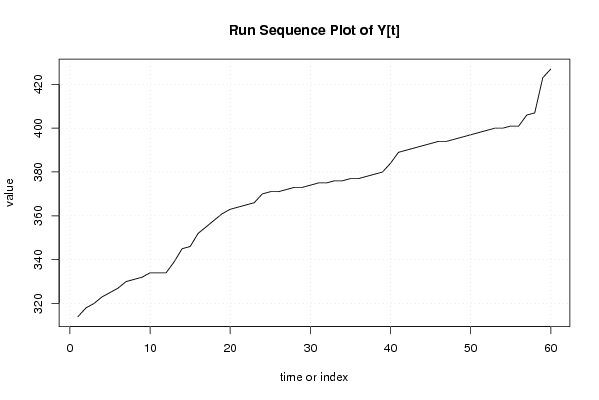
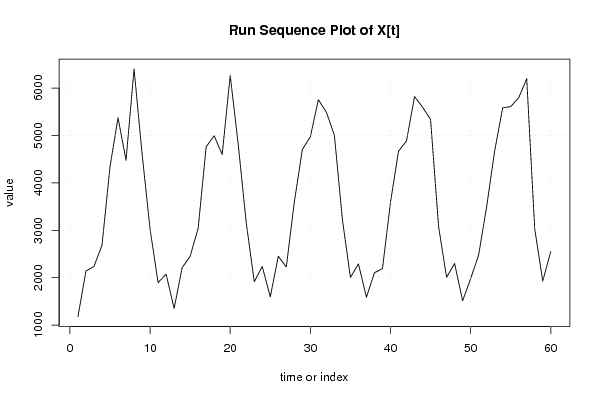
1178
2141
2238
2685
4341
5376
4478
6404
4617
3024
1897
2075
1351
2211
2453
3042
4765
4992
4601
6266
4812
3159
1916
2237
1595
2453
2226
3597
4706
4974
5756
5493
5004
3225
2006
2291
1588
2105
2191
3591
4668
4885
5822
5599
5340
3082
2010
2301
1514
1979
2480
3499
4676
5585
5610
5796
6199
3030
1930
2552
Dataseries Y:
314
318
320
323
325
327
330
331
332
334
334
334
339
345
346
352
355
358
361
363
364
365
366
370
371
371
372
373
373
374
375
375
376
376
377
377
378
379
380
384
389
390
391
392
393
394
394
395
396
397
398
399
400
400
401
401
406
407
423
427


Summary of computational transaction
Raw Inputview raw input (R code)
Raw Outputview raw output of R engine
Computing time2 seconds
R Server'Gwilym Jenkins' @ 72.249.127.135

\begin{tabular}{lllllllll}
\hline
Summary of computational transaction \tabularnewline
Raw Input & view raw input (R code)  \tabularnewline
Raw Output & view raw output of R engine  \tabularnewline
Computing time & 2 seconds \tabularnewline
R Server & 'Gwilym Jenkins' @ 72.249.127.135 \tabularnewline
\hline
\end{tabular}
%Source: https://freestatistics.org/blog/index.php?pk=71074&T=0

[TABLE]
[ROW][C]Summary of computational transaction[/C][/ROW]
[ROW][C]Raw Input[/C][C]view raw input (R code) [/C][/ROW]
[ROW][C]Raw Output[/C][C]view raw output of R engine [/C][/ROW]
[ROW][C]Computing time[/C][C]2 seconds[/C][/ROW]
[ROW][C]R Server[/C][C]'Gwilym Jenkins' @ 72.249.127.135[/C][/ROW]
[/TABLE]
Source: https://freestatistics.org/blog/index.php?pk=71074&T=0

Globally Unique Identifier (entire table): ba.freestatistics.org/blog/index.php?pk=71074&T=0

As an alternative you can also use a QR Code:  

The GUIDs for individual cells are displayed in the table below:

Summary of computational transaction
Raw Inputview raw input (R code)
Raw Outputview raw output of R engine
Computing time2 seconds
R Server'Gwilym Jenkins' @ 72.249.127.135


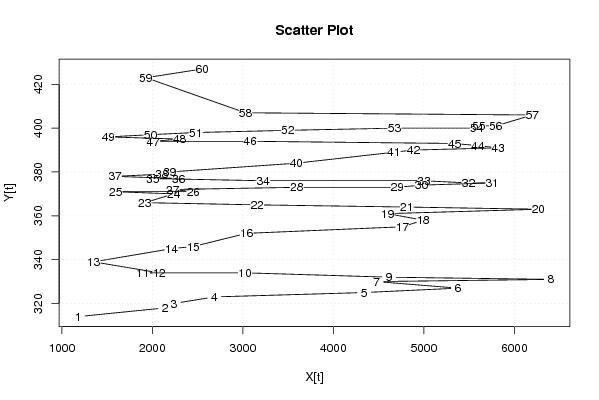
Model: Y[t] = c + b X[t] + e[t]
c362.067161161865
b0.00227496093610581

\begin{tabular}{lllllllll}
\hline
Model: Y[t] = c + b X[t] + e[t] \tabularnewline
c & 362.067161161865 \tabularnewline
b & 0.00227496093610581 \tabularnewline
\hline
\end{tabular}
%Source: https://freestatistics.org/blog/index.php?pk=71074&T=1

[TABLE]
[ROW][C]Model: Y[t] = c + b X[t] + e[t][/C][/ROW]
[ROW][C]c[/C][C]362.067161161865[/C][/ROW]
[ROW][C]b[/C][C]0.00227496093610581[/C][/ROW]
[/TABLE]
Source: https://freestatistics.org/blog/index.php?pk=71074&T=1

Globally Unique Identifier (entire table): ba.freestatistics.org/blog/index.php?pk=71074&T=1

As an alternative you can also use a QR Code:  

The GUIDs for individual cells are displayed in the table below:

Model: Y[t] = c + b X[t] + e[t]
c362.067161161865
b0.00227496093610581


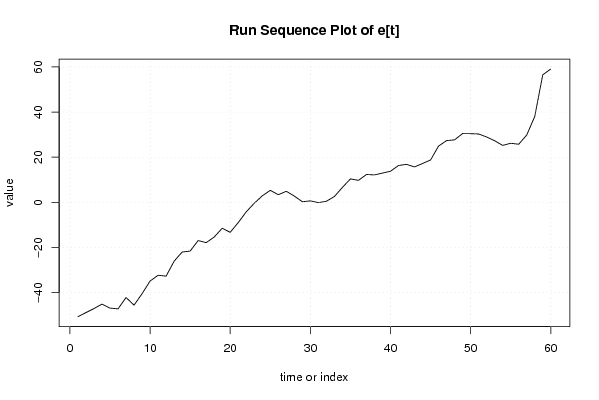
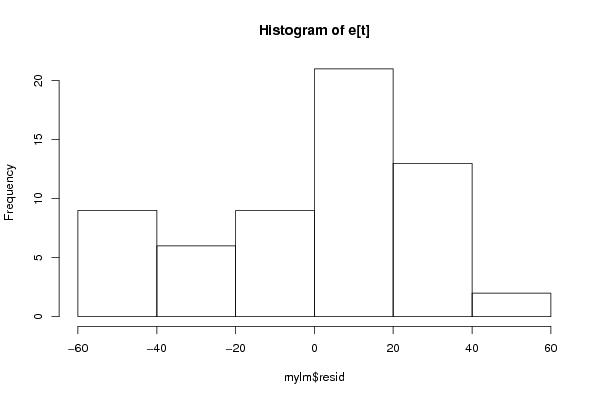
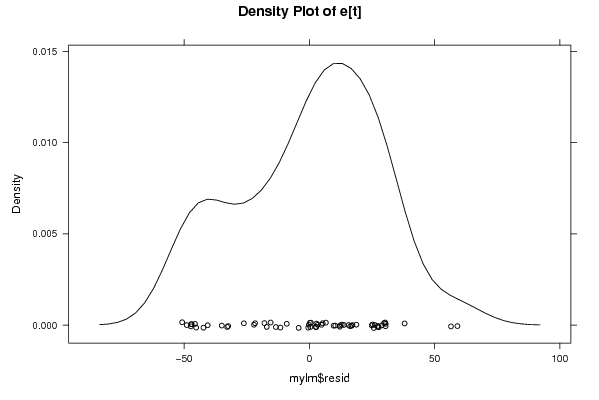
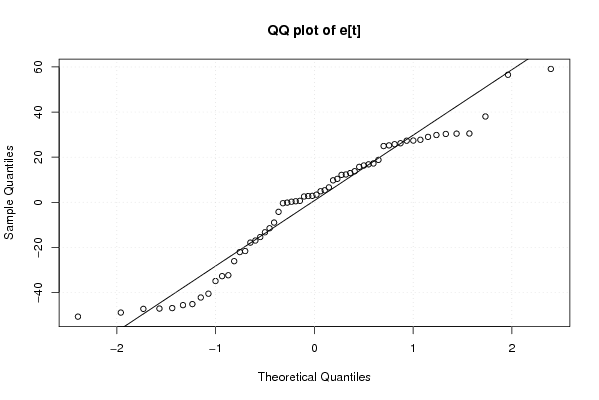
Descriptive Statistics about e[t]
# observations60
minimum-50.7470651445968
Q1-18.8424226013398
median3.09805544296711
mean1.11022302462516e-15
Q320.3187628877619
maximum59.1271385291932

\begin{tabular}{lllllllll}
\hline
Descriptive Statistics about e[t] \tabularnewline
# observations & 60 \tabularnewline
minimum & -50.7470651445968 \tabularnewline
Q1 & -18.8424226013398 \tabularnewline
median & 3.09805544296711 \tabularnewline
mean & 1.11022302462516e-15 \tabularnewline
Q3 & 20.3187628877619 \tabularnewline
maximum & 59.1271385291932 \tabularnewline
\hline
\end{tabular}
%Source: https://freestatistics.org/blog/index.php?pk=71074&T=2

[TABLE]
[ROW][C]Descriptive Statistics about e[t][/C][/ROW]
[ROW][C]# observations[/C][C]60[/C][/ROW]
[ROW][C]minimum[/C][C]-50.7470651445968[/C][/ROW]
[ROW][C]Q1[/C][C]-18.8424226013398[/C][/ROW]
[ROW][C]median[/C][C]3.09805544296711[/C][/ROW]
[ROW][C]mean[/C][C]1.11022302462516e-15[/C][/ROW]
[ROW][C]Q3[/C][C]20.3187628877619[/C][/ROW]
[ROW][C]maximum[/C][C]59.1271385291932[/C][/ROW]
[/TABLE]
Source: https://freestatistics.org/blog/index.php?pk=71074&T=2

Globally Unique Identifier (entire table): ba.freestatistics.org/blog/index.php?pk=71074&T=2

As an alternative you can also use a QR Code:  

The GUIDs for individual cells are displayed in the table below:

Descriptive Statistics about e[t]
# observations60
minimum-50.7470651445968
Q1-18.8424226013398
median3.09805544296711
mean1.11022302462516e-15
Q320.3187628877619
maximum59.1271385291932


Parameters (Session):
par1 = 0 ; par2 = 36 ;
Parameters (R input):
par1 = 0 ; par2 = 36 ;
R code (references can be found in the software module):
par1 <- as.numeric(par1)
par2 <- as.numeric(par2)
x <- as.ts(x)
y <- as.ts(y)
mylm <- lm(y~x)
cbind(mylm$resid)
library(lattice)
bitmap(file='pic1.png')
plot(y,type='l',main='Run Sequence Plot of Y[t]',xlab='time or index',ylab='value')
grid()
dev.off()
bitmap(file='pic1a.png')
plot(x,type='l',main='Run Sequence Plot of X[t]',xlab='time or index',ylab='value')
grid()
dev.off()
bitmap(file='pic1b.png')
plot(x,y,main='Scatter Plot',xlab='X[t]',ylab='Y[t]')
grid()
dev.off()
bitmap(file='pic1c.png')
plot(mylm$resid,type='l',main='Run Sequence Plot of e[t]',xlab='time or index',ylab='value')
grid()
dev.off()
bitmap(file='pic2.png')
hist(mylm$resid,main='Histogram of e[t]')
dev.off()
bitmap(file='pic3.png')
if (par1 > 0)
{
densityplot(~mylm$resid,col='black',main=paste('Density Plot of e[t] bw = ',par1),bw=par1)
} else {
densityplot(~mylm$resid,col='black',main='Density Plot of e[t]')
}
dev.off()
bitmap(file='pic4.png')
qqnorm(mylm$resid,main='QQ plot of e[t]')
qqline(mylm$resid)
grid()
dev.off()
if (par2 > 0)
{
bitmap(file='pic5.png')
acf(mylm$resid,lag.max=par2,main='Residual Autocorrelation Function')
grid()
dev.off()
}
summary(x)
load(file='createtable')
a<-table.start()
a<-table.row.start(a)
a<-table.element(a,'Model: Y[t] = c + b X[t] + e[t]',2,TRUE)
a<-table.row.end(a)
a<-table.row.start(a)
a<-table.element(a,'c',1,TRUE)
a<-table.element(a,mylm$coeff[[1]])
a<-table.row.end(a)
a<-table.row.start(a)
a<-table.element(a,'b',1,TRUE)
a<-table.element(a,mylm$coeff[[2]])
a<-table.row.end(a)
a<-table.end(a)
table.save(a,file='mytable.tab')
a<-table.start()
a<-table.row.start(a)
a<-table.element(a,'Descriptive Statistics about e[t]',2,TRUE)
a<-table.row.end(a)
a<-table.row.start(a)
a<-table.element(a,'# observations',header=TRUE)
a<-table.element(a,length(mylm$resid))
a<-table.row.end(a)
a<-table.row.start(a)
a<-table.element(a,'minimum',header=TRUE)
a<-table.element(a,min(mylm$resid))
a<-table.row.end(a)
a<-table.row.start(a)
a<-table.element(a,'Q1',header=TRUE)
a<-table.element(a,quantile(mylm$resid,0.25))
a<-table.row.end(a)
a<-table.row.start(a)
a<-table.element(a,'median',header=TRUE)
a<-table.element(a,median(mylm$resid))
a<-table.row.end(a)
a<-table.row.start(a)
a<-table.element(a,'mean',header=TRUE)
a<-table.element(a,mean(mylm$resid))
a<-table.row.end(a)
a<-table.row.start(a)
a<-table.element(a,'Q3',header=TRUE)
a<-table.element(a,quantile(mylm$resid,0.75))
a<-table.row.end(a)
a<-table.row.start(a)
a<-table.element(a,'maximum',header=TRUE)
a<-table.element(a,max(mylm$resid))
a<-table.row.end(a)
a<-table.end(a)
table.save(a,file='mytable.tab')