Free Statistics

of Irreproducible Research!

Author's title

Author*The author of this computation has been verified*
R Software Modulerwasp_multipleregression.wasp
Title produced by softwareMultiple Regression
Date of computationFri, 25 Dec 2009 12:34:22 -0700
Cite this page as followsStatistical Computations at FreeStatistics.org, Office for Research Development and Education, URL https://freestatistics.org/blog/index.php?v=date/2009/Dec/25/t1261769749tvoxqrm6j40ahpe.htm/, Retrieved Sat, 04 May 2024 09:12:47 +0000
Statistical Computations at FreeStatistics.org, Office for Research Development and Education, URL https://freestatistics.org/blog/index.php?pk=70729, Retrieved Sat, 04 May 2024 09:12:47 +0000
QR Codes:

Original text written by user:
IsPrivate?No (this computation is public)
User-defined keywords
Estimated Impact156
Family? (F = Feedback message, R = changed R code, M = changed R Module, P = changed Parameters, D = changed Data)
-       [Multiple Regression] [lin regr wagens s...] [2009-12-25 19:34:22] [a315839f8c359622c3a1e6ed387dd5cd] [Current]
Feedback Forum

Post a new message
Dataseries X:
20366
22782
19169
13807
29743
25591
29096
26482
22405
27044
17970
18730
19684
19785
18479
10698
31956
29506
34506
27165
26736
23691
18157
17328
18205
20995
17382
9367
31124
26551
30651
25859
25100
25778
20418
18688
20424
24776
19814
12738
31566
30111
30019
31934
25826
26835
20205
17789
20520
22518
15572
11509
25447
24090
27786
26195
20516
22759
19028
16971


Summary of computational transaction
Raw Inputview raw input (R code)
Raw Outputview raw output of R engine
Computing time4 seconds
R Server'Gwilym Jenkins' @ 72.249.127.135

\begin{tabular}{lllllllll}
\hline
Summary of computational transaction \tabularnewline
Raw Input & view raw input (R code)  \tabularnewline
Raw Output & view raw output of R engine  \tabularnewline
Computing time & 4 seconds \tabularnewline
R Server & 'Gwilym Jenkins' @ 72.249.127.135 \tabularnewline
\hline
\end{tabular}
%Source: https://freestatistics.org/blog/index.php?pk=70729&T=0

[TABLE]
[ROW][C]Summary of computational transaction[/C][/ROW]
[ROW][C]Raw Input[/C][C]view raw input (R code) [/C][/ROW]
[ROW][C]Raw Output[/C][C]view raw output of R engine [/C][/ROW]
[ROW][C]Computing time[/C][C]4 seconds[/C][/ROW]
[ROW][C]R Server[/C][C]'Gwilym Jenkins' @ 72.249.127.135[/C][/ROW]
[/TABLE]
Source: https://freestatistics.org/blog/index.php?pk=70729&T=0

Globally Unique Identifier (entire table): ba.freestatistics.org/blog/index.php?pk=70729&T=0

As an alternative you can also use a QR Code:  

The GUIDs for individual cells are displayed in the table below:

Summary of computational transaction
Raw Inputview raw input (R code)
Raw Outputview raw output of R engine
Computing time4 seconds
R Server'Gwilym Jenkins' @ 72.249.127.135


Multiple Linear Regression - Estimated Regression Equation
wagens[t] = + 17901.2 + 1938.59999999999M1[t] + 4269.99999999999M2[t] + 181.999999999999M3[t] -6277.40000000001M4[t] + 12066M5[t] + 9268.6M6[t] + 12510.4M7[t] + 9625.8M8[t] + 6215.4M9[t] + 7320.2M10[t] + 1254.40000000000M11[t] + e[t]

\begin{tabular}{lllllllll}
\hline
Multiple Linear Regression - Estimated Regression Equation \tabularnewline
wagens[t] =  +  17901.2 +  1938.59999999999M1[t] +  4269.99999999999M2[t] +  181.999999999999M3[t] -6277.40000000001M4[t] +  12066M5[t] +  9268.6M6[t] +  12510.4M7[t] +  9625.8M8[t] +  6215.4M9[t] +  7320.2M10[t] +  1254.40000000000M11[t]  + e[t] \tabularnewline
\hline
\end{tabular}
%Source: https://freestatistics.org/blog/index.php?pk=70729&T=1

[TABLE]
[ROW][C]Multiple Linear Regression - Estimated Regression Equation[/C][/ROW]
[ROW][C]wagens[t] =  +  17901.2 +  1938.59999999999M1[t] +  4269.99999999999M2[t] +  181.999999999999M3[t] -6277.40000000001M4[t] +  12066M5[t] +  9268.6M6[t] +  12510.4M7[t] +  9625.8M8[t] +  6215.4M9[t] +  7320.2M10[t] +  1254.40000000000M11[t]  + e[t][/C][/ROW]
[/TABLE]
Source: https://freestatistics.org/blog/index.php?pk=70729&T=1

Globally Unique Identifier (entire table): ba.freestatistics.org/blog/index.php?pk=70729&T=1

As an alternative you can also use a QR Code:  

The GUIDs for individual cells are displayed in the table below:

Multiple Linear Regression - Estimated Regression Equation
wagens[t] = + 17901.2 + 1938.59999999999M1[t] + 4269.99999999999M2[t] + 181.999999999999M3[t] -6277.40000000001M4[t] + 12066M5[t] + 9268.6M6[t] + 12510.4M7[t] + 9625.8M8[t] + 6215.4M9[t] + 7320.2M10[t] + 1254.40000000000M11[t] + e[t]


Multiple Linear Regression - Ordinary Least Squares
VariableParameterS.D.T-STATH0: parameter = 02-tail p-value1-tail p-value
(Intercept)17901.2903.1149319.821600
M11938.599999999991277.1973821.51790.135610.067805
M24269.999999999991277.1973823.34330.0016120.000806
M3181.9999999999991277.1973820.14250.8872820.443641
M4-6277.400000000011277.197382-4.9151.1e-055e-06
M5120661277.1973829.447200
M69268.61277.1973827.25700
M712510.41277.1973829.795200
M89625.81277.1973827.536700
M96215.41277.1973824.86641.3e-056e-06
M107320.21277.1973825.73151e-060
M111254.400000000001277.1973820.98220.330950.165475

\begin{tabular}{lllllllll}
\hline
Multiple Linear Regression - Ordinary Least Squares \tabularnewline
Variable & Parameter & S.D. & T-STATH0: parameter = 0 & 2-tail p-value & 1-tail p-value \tabularnewline
(Intercept) & 17901.2 & 903.11493 & 19.8216 & 0 & 0 \tabularnewline
M1 & 1938.59999999999 & 1277.197382 & 1.5179 & 0.13561 & 0.067805 \tabularnewline
M2 & 4269.99999999999 & 1277.197382 & 3.3433 & 0.001612 & 0.000806 \tabularnewline
M3 & 181.999999999999 & 1277.197382 & 0.1425 & 0.887282 & 0.443641 \tabularnewline
M4 & -6277.40000000001 & 1277.197382 & -4.915 & 1.1e-05 & 5e-06 \tabularnewline
M5 & 12066 & 1277.197382 & 9.4472 & 0 & 0 \tabularnewline
M6 & 9268.6 & 1277.197382 & 7.257 & 0 & 0 \tabularnewline
M7 & 12510.4 & 1277.197382 & 9.7952 & 0 & 0 \tabularnewline
M8 & 9625.8 & 1277.197382 & 7.5367 & 0 & 0 \tabularnewline
M9 & 6215.4 & 1277.197382 & 4.8664 & 1.3e-05 & 6e-06 \tabularnewline
M10 & 7320.2 & 1277.197382 & 5.7315 & 1e-06 & 0 \tabularnewline
M11 & 1254.40000000000 & 1277.197382 & 0.9822 & 0.33095 & 0.165475 \tabularnewline
\hline
\end{tabular}
%Source: https://freestatistics.org/blog/index.php?pk=70729&T=2

[TABLE]
[ROW][C]Multiple Linear Regression - Ordinary Least Squares[/C][/ROW]
[ROW][C]Variable[/C][C]Parameter[/C][C]S.D.[/C][C]T-STATH0: parameter = 0[/C][C]2-tail p-value[/C][C]1-tail p-value[/C][/ROW]
[ROW][C](Intercept)[/C][C]17901.2[/C][C]903.11493[/C][C]19.8216[/C][C]0[/C][C]0[/C][/ROW]
[ROW][C]M1[/C][C]1938.59999999999[/C][C]1277.197382[/C][C]1.5179[/C][C]0.13561[/C][C]0.067805[/C][/ROW]
[ROW][C]M2[/C][C]4269.99999999999[/C][C]1277.197382[/C][C]3.3433[/C][C]0.001612[/C][C]0.000806[/C][/ROW]
[ROW][C]M3[/C][C]181.999999999999[/C][C]1277.197382[/C][C]0.1425[/C][C]0.887282[/C][C]0.443641[/C][/ROW]
[ROW][C]M4[/C][C]-6277.40000000001[/C][C]1277.197382[/C][C]-4.915[/C][C]1.1e-05[/C][C]5e-06[/C][/ROW]
[ROW][C]M5[/C][C]12066[/C][C]1277.197382[/C][C]9.4472[/C][C]0[/C][C]0[/C][/ROW]
[ROW][C]M6[/C][C]9268.6[/C][C]1277.197382[/C][C]7.257[/C][C]0[/C][C]0[/C][/ROW]
[ROW][C]M7[/C][C]12510.4[/C][C]1277.197382[/C][C]9.7952[/C][C]0[/C][C]0[/C][/ROW]
[ROW][C]M8[/C][C]9625.8[/C][C]1277.197382[/C][C]7.5367[/C][C]0[/C][C]0[/C][/ROW]
[ROW][C]M9[/C][C]6215.4[/C][C]1277.197382[/C][C]4.8664[/C][C]1.3e-05[/C][C]6e-06[/C][/ROW]
[ROW][C]M10[/C][C]7320.2[/C][C]1277.197382[/C][C]5.7315[/C][C]1e-06[/C][C]0[/C][/ROW]
[ROW][C]M11[/C][C]1254.40000000000[/C][C]1277.197382[/C][C]0.9822[/C][C]0.33095[/C][C]0.165475[/C][/ROW]
[/TABLE]
Source: https://freestatistics.org/blog/index.php?pk=70729&T=2

Globally Unique Identifier (entire table): ba.freestatistics.org/blog/index.php?pk=70729&T=2

As an alternative you can also use a QR Code:  

The GUIDs for individual cells are displayed in the table below:

Multiple Linear Regression - Ordinary Least Squares
VariableParameterS.D.T-STATH0: parameter = 02-tail p-value1-tail p-value
(Intercept)17901.2903.1149319.821600
M11938.599999999991277.1973821.51790.135610.067805
M24269.999999999991277.1973823.34330.0016120.000806
M3181.9999999999991277.1973820.14250.8872820.443641
M4-6277.400000000011277.197382-4.9151.1e-055e-06
M5120661277.1973829.447200
M69268.61277.1973827.25700
M712510.41277.1973829.795200
M89625.81277.1973827.536700
M96215.41277.1973824.86641.3e-056e-06
M107320.21277.1973825.73151e-060
M111254.400000000001277.1973820.98220.330950.165475


Multiple Linear Regression - Regression Statistics
Multiple R0.948625984120677
R-squared0.899891257748924
Adjusted R-squared0.876949670983052
F-TEST (value)39.2253276520359
F-TEST (DF numerator)11
F-TEST (DF denominator)48
p-value0
Multiple Linear Regression - Residual Statistics
Residual Standard Deviation2019.42637482364
Sum Squared Residuals195747978.4

\begin{tabular}{lllllllll}
\hline
Multiple Linear Regression - Regression Statistics \tabularnewline
Multiple R & 0.948625984120677 \tabularnewline
R-squared & 0.899891257748924 \tabularnewline
Adjusted R-squared & 0.876949670983052 \tabularnewline
F-TEST (value) & 39.2253276520359 \tabularnewline
F-TEST (DF numerator) & 11 \tabularnewline
F-TEST (DF denominator) & 48 \tabularnewline
p-value & 0 \tabularnewline
Multiple Linear Regression - Residual Statistics \tabularnewline
Residual Standard Deviation & 2019.42637482364 \tabularnewline
Sum Squared Residuals & 195747978.4 \tabularnewline
\hline
\end{tabular}
%Source: https://freestatistics.org/blog/index.php?pk=70729&T=3

[TABLE]
[ROW][C]Multiple Linear Regression - Regression Statistics[/C][/ROW]
[ROW][C]Multiple R[/C][C]0.948625984120677[/C][/ROW]
[ROW][C]R-squared[/C][C]0.899891257748924[/C][/ROW]
[ROW][C]Adjusted R-squared[/C][C]0.876949670983052[/C][/ROW]
[ROW][C]F-TEST (value)[/C][C]39.2253276520359[/C][/ROW]
[ROW][C]F-TEST (DF numerator)[/C][C]11[/C][/ROW]
[ROW][C]F-TEST (DF denominator)[/C][C]48[/C][/ROW]
[ROW][C]p-value[/C][C]0[/C][/ROW]
[ROW][C]Multiple Linear Regression - Residual Statistics[/C][/ROW]
[ROW][C]Residual Standard Deviation[/C][C]2019.42637482364[/C][/ROW]
[ROW][C]Sum Squared Residuals[/C][C]195747978.4[/C][/ROW]
[/TABLE]
Source: https://freestatistics.org/blog/index.php?pk=70729&T=3

Globally Unique Identifier (entire table): ba.freestatistics.org/blog/index.php?pk=70729&T=3

As an alternative you can also use a QR Code:  

The GUIDs for individual cells are displayed in the table below:

Multiple Linear Regression - Regression Statistics
Multiple R0.948625984120677
R-squared0.899891257748924
Adjusted R-squared0.876949670983052
F-TEST (value)39.2253276520359
F-TEST (DF numerator)11
F-TEST (DF denominator)48
p-value0
Multiple Linear Regression - Residual Statistics
Residual Standard Deviation2019.42637482364
Sum Squared Residuals195747978.4


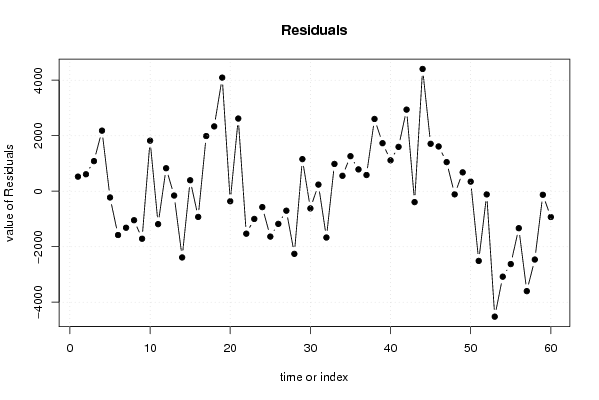
Multiple Linear Regression - Actuals, Interpolation, and Residuals
Time or IndexActualsInterpolationForecastResidualsPrediction Error
12036619839.8000000000526.199999999959
22278222171.2610.799999999997
31916918083.21085.80000000000
41380711623.82183.20000000000
52974329967.2-224.199999999978
62559127169.8-1578.80000000000
72909630411.6-1315.59999999999
82648227527-1045.00000000000
92240524116.6-1711.60000000000
102704425221.41822.60000000001
111797019155.6-1185.6
121873017901.2828.799999999998
131968419839.8-155.799999999990
141978522171.2-2386.2
151847918083.2395.8
161069811623.8-925.799999999998
173195629967.21988.80000000000
182950627169.82336.2
193450630411.64094.4
202716527527-362.000000000001
212673624116.62619.4
222369125221.4-1530.4
231815719155.6-998.6
241732817901.2-573.200000000002
251820519839.8-1634.79999999999
262099522171.2-1176.20000000000
271738218083.2-701.2
28936711623.8-2256.8
293112429967.21156.79999999999
302655127169.8-618.8
313065130411.6239.399999999998
322585927527-1668
332510024116.6983.4
342577825221.4556.6
352041819155.61262.4
361868817901.2786.799999999998
372042419839.8584.20000000001
382477622171.22604.8
391981418083.21730.8
401273811623.81114.20000000000
413156629967.21598.80000000000
423011127169.82941.2
433001930411.6-392.600000000002
4431934275274407
452582624116.61709.4
462683525221.41613.6
472020519155.61049.4
481778917901.2-112.200000000002
492052019839.8680.20000000001
502251822171.2346.800000000001
511557218083.2-2511.2
521150911623.8-114.799999999998
532544729967.2-4520.20000000001
542409027169.8-3079.8
552778630411.6-2625.6
562619527527-1332
572051624116.6-3600.6
582275925221.4-2462.4
591902819155.6-127.600000000000
601697117901.2-930.200000000001

\begin{tabular}{lllllllll}
\hline
Multiple Linear Regression - Actuals, Interpolation, and Residuals \tabularnewline
Time or Index & Actuals & InterpolationForecast & ResidualsPrediction Error \tabularnewline
1 & 20366 & 19839.8000000000 & 526.199999999959 \tabularnewline
2 & 22782 & 22171.2 & 610.799999999997 \tabularnewline
3 & 19169 & 18083.2 & 1085.80000000000 \tabularnewline
4 & 13807 & 11623.8 & 2183.20000000000 \tabularnewline
5 & 29743 & 29967.2 & -224.199999999978 \tabularnewline
6 & 25591 & 27169.8 & -1578.80000000000 \tabularnewline
7 & 29096 & 30411.6 & -1315.59999999999 \tabularnewline
8 & 26482 & 27527 & -1045.00000000000 \tabularnewline
9 & 22405 & 24116.6 & -1711.60000000000 \tabularnewline
10 & 27044 & 25221.4 & 1822.60000000001 \tabularnewline
11 & 17970 & 19155.6 & -1185.6 \tabularnewline
12 & 18730 & 17901.2 & 828.799999999998 \tabularnewline
13 & 19684 & 19839.8 & -155.799999999990 \tabularnewline
14 & 19785 & 22171.2 & -2386.2 \tabularnewline
15 & 18479 & 18083.2 & 395.8 \tabularnewline
16 & 10698 & 11623.8 & -925.799999999998 \tabularnewline
17 & 31956 & 29967.2 & 1988.80000000000 \tabularnewline
18 & 29506 & 27169.8 & 2336.2 \tabularnewline
19 & 34506 & 30411.6 & 4094.4 \tabularnewline
20 & 27165 & 27527 & -362.000000000001 \tabularnewline
21 & 26736 & 24116.6 & 2619.4 \tabularnewline
22 & 23691 & 25221.4 & -1530.4 \tabularnewline
23 & 18157 & 19155.6 & -998.6 \tabularnewline
24 & 17328 & 17901.2 & -573.200000000002 \tabularnewline
25 & 18205 & 19839.8 & -1634.79999999999 \tabularnewline
26 & 20995 & 22171.2 & -1176.20000000000 \tabularnewline
27 & 17382 & 18083.2 & -701.2 \tabularnewline
28 & 9367 & 11623.8 & -2256.8 \tabularnewline
29 & 31124 & 29967.2 & 1156.79999999999 \tabularnewline
30 & 26551 & 27169.8 & -618.8 \tabularnewline
31 & 30651 & 30411.6 & 239.399999999998 \tabularnewline
32 & 25859 & 27527 & -1668 \tabularnewline
33 & 25100 & 24116.6 & 983.4 \tabularnewline
34 & 25778 & 25221.4 & 556.6 \tabularnewline
35 & 20418 & 19155.6 & 1262.4 \tabularnewline
36 & 18688 & 17901.2 & 786.799999999998 \tabularnewline
37 & 20424 & 19839.8 & 584.20000000001 \tabularnewline
38 & 24776 & 22171.2 & 2604.8 \tabularnewline
39 & 19814 & 18083.2 & 1730.8 \tabularnewline
40 & 12738 & 11623.8 & 1114.20000000000 \tabularnewline
41 & 31566 & 29967.2 & 1598.80000000000 \tabularnewline
42 & 30111 & 27169.8 & 2941.2 \tabularnewline
43 & 30019 & 30411.6 & -392.600000000002 \tabularnewline
44 & 31934 & 27527 & 4407 \tabularnewline
45 & 25826 & 24116.6 & 1709.4 \tabularnewline
46 & 26835 & 25221.4 & 1613.6 \tabularnewline
47 & 20205 & 19155.6 & 1049.4 \tabularnewline
48 & 17789 & 17901.2 & -112.200000000002 \tabularnewline
49 & 20520 & 19839.8 & 680.20000000001 \tabularnewline
50 & 22518 & 22171.2 & 346.800000000001 \tabularnewline
51 & 15572 & 18083.2 & -2511.2 \tabularnewline
52 & 11509 & 11623.8 & -114.799999999998 \tabularnewline
53 & 25447 & 29967.2 & -4520.20000000001 \tabularnewline
54 & 24090 & 27169.8 & -3079.8 \tabularnewline
55 & 27786 & 30411.6 & -2625.6 \tabularnewline
56 & 26195 & 27527 & -1332 \tabularnewline
57 & 20516 & 24116.6 & -3600.6 \tabularnewline
58 & 22759 & 25221.4 & -2462.4 \tabularnewline
59 & 19028 & 19155.6 & -127.600000000000 \tabularnewline
60 & 16971 & 17901.2 & -930.200000000001 \tabularnewline
\hline
\end{tabular}
%Source: https://freestatistics.org/blog/index.php?pk=70729&T=4

[TABLE]
[ROW][C]Multiple Linear Regression - Actuals, Interpolation, and Residuals[/C][/ROW]
[ROW][C]Time or Index[/C][C]Actuals[/C][C]InterpolationForecast[/C][C]ResidualsPrediction Error[/C][/ROW]
[ROW][C]1[/C][C]20366[/C][C]19839.8000000000[/C][C]526.199999999959[/C][/ROW]
[ROW][C]2[/C][C]22782[/C][C]22171.2[/C][C]610.799999999997[/C][/ROW]
[ROW][C]3[/C][C]19169[/C][C]18083.2[/C][C]1085.80000000000[/C][/ROW]
[ROW][C]4[/C][C]13807[/C][C]11623.8[/C][C]2183.20000000000[/C][/ROW]
[ROW][C]5[/C][C]29743[/C][C]29967.2[/C][C]-224.199999999978[/C][/ROW]
[ROW][C]6[/C][C]25591[/C][C]27169.8[/C][C]-1578.80000000000[/C][/ROW]
[ROW][C]7[/C][C]29096[/C][C]30411.6[/C][C]-1315.59999999999[/C][/ROW]
[ROW][C]8[/C][C]26482[/C][C]27527[/C][C]-1045.00000000000[/C][/ROW]
[ROW][C]9[/C][C]22405[/C][C]24116.6[/C][C]-1711.60000000000[/C][/ROW]
[ROW][C]10[/C][C]27044[/C][C]25221.4[/C][C]1822.60000000001[/C][/ROW]
[ROW][C]11[/C][C]17970[/C][C]19155.6[/C][C]-1185.6[/C][/ROW]
[ROW][C]12[/C][C]18730[/C][C]17901.2[/C][C]828.799999999998[/C][/ROW]
[ROW][C]13[/C][C]19684[/C][C]19839.8[/C][C]-155.799999999990[/C][/ROW]
[ROW][C]14[/C][C]19785[/C][C]22171.2[/C][C]-2386.2[/C][/ROW]
[ROW][C]15[/C][C]18479[/C][C]18083.2[/C][C]395.8[/C][/ROW]
[ROW][C]16[/C][C]10698[/C][C]11623.8[/C][C]-925.799999999998[/C][/ROW]
[ROW][C]17[/C][C]31956[/C][C]29967.2[/C][C]1988.80000000000[/C][/ROW]
[ROW][C]18[/C][C]29506[/C][C]27169.8[/C][C]2336.2[/C][/ROW]
[ROW][C]19[/C][C]34506[/C][C]30411.6[/C][C]4094.4[/C][/ROW]
[ROW][C]20[/C][C]27165[/C][C]27527[/C][C]-362.000000000001[/C][/ROW]
[ROW][C]21[/C][C]26736[/C][C]24116.6[/C][C]2619.4[/C][/ROW]
[ROW][C]22[/C][C]23691[/C][C]25221.4[/C][C]-1530.4[/C][/ROW]
[ROW][C]23[/C][C]18157[/C][C]19155.6[/C][C]-998.6[/C][/ROW]
[ROW][C]24[/C][C]17328[/C][C]17901.2[/C][C]-573.200000000002[/C][/ROW]
[ROW][C]25[/C][C]18205[/C][C]19839.8[/C][C]-1634.79999999999[/C][/ROW]
[ROW][C]26[/C][C]20995[/C][C]22171.2[/C][C]-1176.20000000000[/C][/ROW]
[ROW][C]27[/C][C]17382[/C][C]18083.2[/C][C]-701.2[/C][/ROW]
[ROW][C]28[/C][C]9367[/C][C]11623.8[/C][C]-2256.8[/C][/ROW]
[ROW][C]29[/C][C]31124[/C][C]29967.2[/C][C]1156.79999999999[/C][/ROW]
[ROW][C]30[/C][C]26551[/C][C]27169.8[/C][C]-618.8[/C][/ROW]
[ROW][C]31[/C][C]30651[/C][C]30411.6[/C][C]239.399999999998[/C][/ROW]
[ROW][C]32[/C][C]25859[/C][C]27527[/C][C]-1668[/C][/ROW]
[ROW][C]33[/C][C]25100[/C][C]24116.6[/C][C]983.4[/C][/ROW]
[ROW][C]34[/C][C]25778[/C][C]25221.4[/C][C]556.6[/C][/ROW]
[ROW][C]35[/C][C]20418[/C][C]19155.6[/C][C]1262.4[/C][/ROW]
[ROW][C]36[/C][C]18688[/C][C]17901.2[/C][C]786.799999999998[/C][/ROW]
[ROW][C]37[/C][C]20424[/C][C]19839.8[/C][C]584.20000000001[/C][/ROW]
[ROW][C]38[/C][C]24776[/C][C]22171.2[/C][C]2604.8[/C][/ROW]
[ROW][C]39[/C][C]19814[/C][C]18083.2[/C][C]1730.8[/C][/ROW]
[ROW][C]40[/C][C]12738[/C][C]11623.8[/C][C]1114.20000000000[/C][/ROW]
[ROW][C]41[/C][C]31566[/C][C]29967.2[/C][C]1598.80000000000[/C][/ROW]
[ROW][C]42[/C][C]30111[/C][C]27169.8[/C][C]2941.2[/C][/ROW]
[ROW][C]43[/C][C]30019[/C][C]30411.6[/C][C]-392.600000000002[/C][/ROW]
[ROW][C]44[/C][C]31934[/C][C]27527[/C][C]4407[/C][/ROW]
[ROW][C]45[/C][C]25826[/C][C]24116.6[/C][C]1709.4[/C][/ROW]
[ROW][C]46[/C][C]26835[/C][C]25221.4[/C][C]1613.6[/C][/ROW]
[ROW][C]47[/C][C]20205[/C][C]19155.6[/C][C]1049.4[/C][/ROW]
[ROW][C]48[/C][C]17789[/C][C]17901.2[/C][C]-112.200000000002[/C][/ROW]
[ROW][C]49[/C][C]20520[/C][C]19839.8[/C][C]680.20000000001[/C][/ROW]
[ROW][C]50[/C][C]22518[/C][C]22171.2[/C][C]346.800000000001[/C][/ROW]
[ROW][C]51[/C][C]15572[/C][C]18083.2[/C][C]-2511.2[/C][/ROW]
[ROW][C]52[/C][C]11509[/C][C]11623.8[/C][C]-114.799999999998[/C][/ROW]
[ROW][C]53[/C][C]25447[/C][C]29967.2[/C][C]-4520.20000000001[/C][/ROW]
[ROW][C]54[/C][C]24090[/C][C]27169.8[/C][C]-3079.8[/C][/ROW]
[ROW][C]55[/C][C]27786[/C][C]30411.6[/C][C]-2625.6[/C][/ROW]
[ROW][C]56[/C][C]26195[/C][C]27527[/C][C]-1332[/C][/ROW]
[ROW][C]57[/C][C]20516[/C][C]24116.6[/C][C]-3600.6[/C][/ROW]
[ROW][C]58[/C][C]22759[/C][C]25221.4[/C][C]-2462.4[/C][/ROW]
[ROW][C]59[/C][C]19028[/C][C]19155.6[/C][C]-127.600000000000[/C][/ROW]
[ROW][C]60[/C][C]16971[/C][C]17901.2[/C][C]-930.200000000001[/C][/ROW]
[/TABLE]
Source: https://freestatistics.org/blog/index.php?pk=70729&T=4

Globally Unique Identifier (entire table): ba.freestatistics.org/blog/index.php?pk=70729&T=4

As an alternative you can also use a QR Code:  

The GUIDs for individual cells are displayed in the table below:

Multiple Linear Regression - Actuals, Interpolation, and Residuals
Time or IndexActualsInterpolationForecastResidualsPrediction Error
12036619839.8000000000526.199999999959
22278222171.2610.799999999997
31916918083.21085.80000000000
41380711623.82183.20000000000
52974329967.2-224.199999999978
62559127169.8-1578.80000000000
72909630411.6-1315.59999999999
82648227527-1045.00000000000
92240524116.6-1711.60000000000
102704425221.41822.60000000001
111797019155.6-1185.6
121873017901.2828.799999999998
131968419839.8-155.799999999990
141978522171.2-2386.2
151847918083.2395.8
161069811623.8-925.799999999998
173195629967.21988.80000000000
182950627169.82336.2
193450630411.64094.4
202716527527-362.000000000001
212673624116.62619.4
222369125221.4-1530.4
231815719155.6-998.6
241732817901.2-573.200000000002
251820519839.8-1634.79999999999
262099522171.2-1176.20000000000
271738218083.2-701.2
28936711623.8-2256.8
293112429967.21156.79999999999
302655127169.8-618.8
313065130411.6239.399999999998
322585927527-1668
332510024116.6983.4
342577825221.4556.6
352041819155.61262.4
361868817901.2786.799999999998
372042419839.8584.20000000001
382477622171.22604.8
391981418083.21730.8
401273811623.81114.20000000000
413156629967.21598.80000000000
423011127169.82941.2
433001930411.6-392.600000000002
4431934275274407
452582624116.61709.4
462683525221.41613.6
472020519155.61049.4
481778917901.2-112.200000000002
492052019839.8680.20000000001
502251822171.2346.800000000001
511557218083.2-2511.2
521150911623.8-114.799999999998
532544729967.2-4520.20000000001
542409027169.8-3079.8
552778630411.6-2625.6
562619527527-1332
572051624116.6-3600.6
582275925221.4-2462.4
591902819155.6-127.600000000000
601697117901.2-930.200000000001


Goldfeld-Quandt test for Heteroskedasticity
p-valuesAlternative Hypothesis
breakpoint indexgreater2-sidedless
150.199606871574720.399213743149440.80039312842528
160.2505054087274050.501010817454810.749494591272595
170.2120522207706650.4241044415413310.787947779229335
180.3109245311815920.6218490623631840.689075468818408
190.5915163775591790.8169672448816430.408483622440821
200.4788467921397420.9576935842794830.521153207860259
210.5661362888885020.8677274222229970.433863711111498
220.5538545436587280.8922909126825440.446145456341272
230.461104239652590.922208479305180.53889576034741
240.3745953164492490.7491906328984980.625404683550751
250.3301401505682880.6602803011365760.669859849431712
260.2703168789008400.5406337578016790.72968312109916
270.2091737121560840.4183474243121680.790826287843916
280.2207783868368060.4415567736736120.779221613163194
290.1773014509228630.3546029018457260.822698549077137
300.1266459904715070.2532919809430130.873354009528494
310.0942910132601350.188582026520270.905708986739865
320.0816869184694550.163373836938910.918313081530545
330.05756065252479660.1151213050495930.942439347475203
340.03588515412743770.07177030825487540.964114845872562
350.02769255048172450.0553851009634490.972307449518276
360.01669795477350120.03339590954700230.983302045226499
370.00932623803968290.01865247607936580.990673761960317
380.01163606119712320.02327212239424640.988363938802877
390.01174962409488820.02349924818977640.988250375905112
400.006758586801300760.01351717360260150.9932414131987
410.01400650799622780.02801301599245560.985993492003772
420.0480562294324170.0961124588648340.951943770567583
430.03331683067496370.06663366134992730.966683169325036
440.1742946701782380.3485893403564770.825705329821762
450.440069676405490.880139352810980.55993032359451

\begin{tabular}{lllllllll}
\hline
Goldfeld-Quandt test for Heteroskedasticity \tabularnewline
p-values & Alternative Hypothesis \tabularnewline
breakpoint index & greater & 2-sided & less \tabularnewline
15 & 0.19960687157472 & 0.39921374314944 & 0.80039312842528 \tabularnewline
16 & 0.250505408727405 & 0.50101081745481 & 0.749494591272595 \tabularnewline
17 & 0.212052220770665 & 0.424104441541331 & 0.787947779229335 \tabularnewline
18 & 0.310924531181592 & 0.621849062363184 & 0.689075468818408 \tabularnewline
19 & 0.591516377559179 & 0.816967244881643 & 0.408483622440821 \tabularnewline
20 & 0.478846792139742 & 0.957693584279483 & 0.521153207860259 \tabularnewline
21 & 0.566136288888502 & 0.867727422222997 & 0.433863711111498 \tabularnewline
22 & 0.553854543658728 & 0.892290912682544 & 0.446145456341272 \tabularnewline
23 & 0.46110423965259 & 0.92220847930518 & 0.53889576034741 \tabularnewline
24 & 0.374595316449249 & 0.749190632898498 & 0.625404683550751 \tabularnewline
25 & 0.330140150568288 & 0.660280301136576 & 0.669859849431712 \tabularnewline
26 & 0.270316878900840 & 0.540633757801679 & 0.72968312109916 \tabularnewline
27 & 0.209173712156084 & 0.418347424312168 & 0.790826287843916 \tabularnewline
28 & 0.220778386836806 & 0.441556773673612 & 0.779221613163194 \tabularnewline
29 & 0.177301450922863 & 0.354602901845726 & 0.822698549077137 \tabularnewline
30 & 0.126645990471507 & 0.253291980943013 & 0.873354009528494 \tabularnewline
31 & 0.094291013260135 & 0.18858202652027 & 0.905708986739865 \tabularnewline
32 & 0.081686918469455 & 0.16337383693891 & 0.918313081530545 \tabularnewline
33 & 0.0575606525247966 & 0.115121305049593 & 0.942439347475203 \tabularnewline
34 & 0.0358851541274377 & 0.0717703082548754 & 0.964114845872562 \tabularnewline
35 & 0.0276925504817245 & 0.055385100963449 & 0.972307449518276 \tabularnewline
36 & 0.0166979547735012 & 0.0333959095470023 & 0.983302045226499 \tabularnewline
37 & 0.0093262380396829 & 0.0186524760793658 & 0.990673761960317 \tabularnewline
38 & 0.0116360611971232 & 0.0232721223942464 & 0.988363938802877 \tabularnewline
39 & 0.0117496240948882 & 0.0234992481897764 & 0.988250375905112 \tabularnewline
40 & 0.00675858680130076 & 0.0135171736026015 & 0.9932414131987 \tabularnewline
41 & 0.0140065079962278 & 0.0280130159924556 & 0.985993492003772 \tabularnewline
42 & 0.048056229432417 & 0.096112458864834 & 0.951943770567583 \tabularnewline
43 & 0.0333168306749637 & 0.0666336613499273 & 0.966683169325036 \tabularnewline
44 & 0.174294670178238 & 0.348589340356477 & 0.825705329821762 \tabularnewline
45 & 0.44006967640549 & 0.88013935281098 & 0.55993032359451 \tabularnewline
\hline
\end{tabular}
%Source: https://freestatistics.org/blog/index.php?pk=70729&T=5

[TABLE]
[ROW][C]Goldfeld-Quandt test for Heteroskedasticity[/C][/ROW]
[ROW][C]p-values[/C][C]Alternative Hypothesis[/C][/ROW]
[ROW][C]breakpoint index[/C][C]greater[/C][C]2-sided[/C][C]less[/C][/ROW]
[ROW][C]15[/C][C]0.19960687157472[/C][C]0.39921374314944[/C][C]0.80039312842528[/C][/ROW]
[ROW][C]16[/C][C]0.250505408727405[/C][C]0.50101081745481[/C][C]0.749494591272595[/C][/ROW]
[ROW][C]17[/C][C]0.212052220770665[/C][C]0.424104441541331[/C][C]0.787947779229335[/C][/ROW]
[ROW][C]18[/C][C]0.310924531181592[/C][C]0.621849062363184[/C][C]0.689075468818408[/C][/ROW]
[ROW][C]19[/C][C]0.591516377559179[/C][C]0.816967244881643[/C][C]0.408483622440821[/C][/ROW]
[ROW][C]20[/C][C]0.478846792139742[/C][C]0.957693584279483[/C][C]0.521153207860259[/C][/ROW]
[ROW][C]21[/C][C]0.566136288888502[/C][C]0.867727422222997[/C][C]0.433863711111498[/C][/ROW]
[ROW][C]22[/C][C]0.553854543658728[/C][C]0.892290912682544[/C][C]0.446145456341272[/C][/ROW]
[ROW][C]23[/C][C]0.46110423965259[/C][C]0.92220847930518[/C][C]0.53889576034741[/C][/ROW]
[ROW][C]24[/C][C]0.374595316449249[/C][C]0.749190632898498[/C][C]0.625404683550751[/C][/ROW]
[ROW][C]25[/C][C]0.330140150568288[/C][C]0.660280301136576[/C][C]0.669859849431712[/C][/ROW]
[ROW][C]26[/C][C]0.270316878900840[/C][C]0.540633757801679[/C][C]0.72968312109916[/C][/ROW]
[ROW][C]27[/C][C]0.209173712156084[/C][C]0.418347424312168[/C][C]0.790826287843916[/C][/ROW]
[ROW][C]28[/C][C]0.220778386836806[/C][C]0.441556773673612[/C][C]0.779221613163194[/C][/ROW]
[ROW][C]29[/C][C]0.177301450922863[/C][C]0.354602901845726[/C][C]0.822698549077137[/C][/ROW]
[ROW][C]30[/C][C]0.126645990471507[/C][C]0.253291980943013[/C][C]0.873354009528494[/C][/ROW]
[ROW][C]31[/C][C]0.094291013260135[/C][C]0.18858202652027[/C][C]0.905708986739865[/C][/ROW]
[ROW][C]32[/C][C]0.081686918469455[/C][C]0.16337383693891[/C][C]0.918313081530545[/C][/ROW]
[ROW][C]33[/C][C]0.0575606525247966[/C][C]0.115121305049593[/C][C]0.942439347475203[/C][/ROW]
[ROW][C]34[/C][C]0.0358851541274377[/C][C]0.0717703082548754[/C][C]0.964114845872562[/C][/ROW]
[ROW][C]35[/C][C]0.0276925504817245[/C][C]0.055385100963449[/C][C]0.972307449518276[/C][/ROW]
[ROW][C]36[/C][C]0.0166979547735012[/C][C]0.0333959095470023[/C][C]0.983302045226499[/C][/ROW]
[ROW][C]37[/C][C]0.0093262380396829[/C][C]0.0186524760793658[/C][C]0.990673761960317[/C][/ROW]
[ROW][C]38[/C][C]0.0116360611971232[/C][C]0.0232721223942464[/C][C]0.988363938802877[/C][/ROW]
[ROW][C]39[/C][C]0.0117496240948882[/C][C]0.0234992481897764[/C][C]0.988250375905112[/C][/ROW]
[ROW][C]40[/C][C]0.00675858680130076[/C][C]0.0135171736026015[/C][C]0.9932414131987[/C][/ROW]
[ROW][C]41[/C][C]0.0140065079962278[/C][C]0.0280130159924556[/C][C]0.985993492003772[/C][/ROW]
[ROW][C]42[/C][C]0.048056229432417[/C][C]0.096112458864834[/C][C]0.951943770567583[/C][/ROW]
[ROW][C]43[/C][C]0.0333168306749637[/C][C]0.0666336613499273[/C][C]0.966683169325036[/C][/ROW]
[ROW][C]44[/C][C]0.174294670178238[/C][C]0.348589340356477[/C][C]0.825705329821762[/C][/ROW]
[ROW][C]45[/C][C]0.44006967640549[/C][C]0.88013935281098[/C][C]0.55993032359451[/C][/ROW]
[/TABLE]
Source: https://freestatistics.org/blog/index.php?pk=70729&T=5

Globally Unique Identifier (entire table): ba.freestatistics.org/blog/index.php?pk=70729&T=5

As an alternative you can also use a QR Code:  

The GUIDs for individual cells are displayed in the table below:

Goldfeld-Quandt test for Heteroskedasticity
p-valuesAlternative Hypothesis
breakpoint indexgreater2-sidedless
150.199606871574720.399213743149440.80039312842528
160.2505054087274050.501010817454810.749494591272595
170.2120522207706650.4241044415413310.787947779229335
180.3109245311815920.6218490623631840.689075468818408
190.5915163775591790.8169672448816430.408483622440821
200.4788467921397420.9576935842794830.521153207860259
210.5661362888885020.8677274222229970.433863711111498
220.5538545436587280.8922909126825440.446145456341272
230.461104239652590.922208479305180.53889576034741
240.3745953164492490.7491906328984980.625404683550751
250.3301401505682880.6602803011365760.669859849431712
260.2703168789008400.5406337578016790.72968312109916
270.2091737121560840.4183474243121680.790826287843916
280.2207783868368060.4415567736736120.779221613163194
290.1773014509228630.3546029018457260.822698549077137
300.1266459904715070.2532919809430130.873354009528494
310.0942910132601350.188582026520270.905708986739865
320.0816869184694550.163373836938910.918313081530545
330.05756065252479660.1151213050495930.942439347475203
340.03588515412743770.07177030825487540.964114845872562
350.02769255048172450.0553851009634490.972307449518276
360.01669795477350120.03339590954700230.983302045226499
370.00932623803968290.01865247607936580.990673761960317
380.01163606119712320.02327212239424640.988363938802877
390.01174962409488820.02349924818977640.988250375905112
400.006758586801300760.01351717360260150.9932414131987
410.01400650799622780.02801301599245560.985993492003772
420.0480562294324170.0961124588648340.951943770567583
430.03331683067496370.06663366134992730.966683169325036
440.1742946701782380.3485893403564770.825705329821762
450.440069676405490.880139352810980.55993032359451


Meta Analysis of Goldfeld-Quandt test for Heteroskedasticity
Description# significant tests% significant testsOK/NOK
1% type I error level00OK
5% type I error level60.193548387096774NOK
10% type I error level100.32258064516129NOK

\begin{tabular}{lllllllll}
\hline
Meta Analysis of Goldfeld-Quandt test for Heteroskedasticity \tabularnewline
Description & # significant tests & % significant tests & OK/NOK \tabularnewline
1% type I error level & 0 & 0 & OK \tabularnewline
5% type I error level & 6 & 0.193548387096774 & NOK \tabularnewline
10% type I error level & 10 & 0.32258064516129 & NOK \tabularnewline
\hline
\end{tabular}
%Source: https://freestatistics.org/blog/index.php?pk=70729&T=6

[TABLE]
[ROW][C]Meta Analysis of Goldfeld-Quandt test for Heteroskedasticity[/C][/ROW]
[ROW][C]Description[/C][C]# significant tests[/C][C]% significant tests[/C][C]OK/NOK[/C][/ROW]
[ROW][C]1% type I error level[/C][C]0[/C][C]0[/C][C]OK[/C][/ROW]
[ROW][C]5% type I error level[/C][C]6[/C][C]0.193548387096774[/C][C]NOK[/C][/ROW]
[ROW][C]10% type I error level[/C][C]10[/C][C]0.32258064516129[/C][C]NOK[/C][/ROW]
[/TABLE]
Source: https://freestatistics.org/blog/index.php?pk=70729&T=6

Globally Unique Identifier (entire table): ba.freestatistics.org/blog/index.php?pk=70729&T=6

As an alternative you can also use a QR Code:  

The GUIDs for individual cells are displayed in the table below:

Meta Analysis of Goldfeld-Quandt test for Heteroskedasticity
Description# significant tests% significant testsOK/NOK
1% type I error level00OK
5% type I error level60.193548387096774NOK
10% type I error level100.32258064516129NOK


Parameters (Session):
par1 = 1 ; par2 = Include Monthly Dummies ; par3 = No Linear Trend ;
Parameters (R input):
par1 = 1 ; par2 = Include Monthly Dummies ; par3 = No Linear Trend ;
R code (references can be found in the software module):
library(lattice)
library(lmtest)
n25 <- 25 #minimum number of obs. for Goldfeld-Quandt test
par1 <- as.numeric(par1)
x <- t(y)
k <- length(x[1,])
n <- length(x[,1])
x1 <- cbind(x[,par1], x[,1:k!=par1])
mycolnames <- c(colnames(x)[par1], colnames(x)[1:k!=par1])
colnames(x1) <- mycolnames #colnames(x)[par1]
x <- x1
if (par3 == 'First Differences'){
x2 <- array(0, dim=c(n-1,k), dimnames=list(1:(n-1), paste('(1-B)',colnames(x),sep='')))
for (i in 1:n-1) {
for (j in 1:k) {
x2[i,j] <- x[i+1,j] - x[i,j]
}
}
x <- x2
}
if (par2 == 'Include Monthly Dummies'){
x2 <- array(0, dim=c(n,11), dimnames=list(1:n, paste('M', seq(1:11), sep ='')))
for (i in 1:11){
x2[seq(i,n,12),i] <- 1
}
x <- cbind(x, x2)
}
if (par2 == 'Include Quarterly Dummies'){
x2 <- array(0, dim=c(n,3), dimnames=list(1:n, paste('Q', seq(1:3), sep ='')))
for (i in 1:3){
x2[seq(i,n,4),i] <- 1
}
x <- cbind(x, x2)
}
k <- length(x[1,])
if (par3 == 'Linear Trend'){
x <- cbind(x, c(1:n))
colnames(x)[k+1] <- 't'
}
x
k <- length(x[1,])
df <- as.data.frame(x)
(mylm <- lm(df))
(mysum <- summary(mylm))
if (n > n25) {
kp3 <- k + 3
nmkm3 <- n - k - 3
gqarr <- array(NA, dim=c(nmkm3-kp3+1,3))
numgqtests <- 0
numsignificant1 <- 0
numsignificant5 <- 0
numsignificant10 <- 0
for (mypoint in kp3:nmkm3) {
j <- 0
numgqtests <- numgqtests + 1
for (myalt in c('greater', 'two.sided', 'less')) {
j <- j + 1
gqarr[mypoint-kp3+1,j] <- gqtest(mylm, point=mypoint, alternative=myalt)$p.value
}
if (gqarr[mypoint-kp3+1,2] < 0.01) numsignificant1 <- numsignificant1 + 1
if (gqarr[mypoint-kp3+1,2] < 0.05) numsignificant5 <- numsignificant5 + 1
if (gqarr[mypoint-kp3+1,2] < 0.10) numsignificant10 <- numsignificant10 + 1
}
gqarr
}
bitmap(file='test0.png')
plot(x[,1], type='l', main='Actuals and Interpolation', ylab='value of Actuals and Interpolation (dots)', xlab='time or index')
points(x[,1]-mysum$resid)
grid()
dev.off()
bitmap(file='test1.png')
plot(mysum$resid, type='b', pch=19, main='Residuals', ylab='value of Residuals', xlab='time or index')
grid()
dev.off()
bitmap(file='test2.png')
hist(mysum$resid, main='Residual Histogram', xlab='values of Residuals')
grid()
dev.off()
bitmap(file='test3.png')
densityplot(~mysum$resid,col='black',main='Residual Density Plot', xlab='values of Residuals')
dev.off()
bitmap(file='test4.png')
qqnorm(mysum$resid, main='Residual Normal Q-Q Plot')
qqline(mysum$resid)
grid()
dev.off()
(myerror <- as.ts(mysum$resid))
bitmap(file='test5.png')
dum <- cbind(lag(myerror,k=1),myerror)
dum
dum1 <- dum[2:length(myerror),]
dum1
z <- as.data.frame(dum1)
z
plot(z,main=paste('Residual Lag plot, lowess, and regression line'), ylab='values of Residuals', xlab='lagged values of Residuals')
lines(lowess(z))
abline(lm(z))
grid()
dev.off()
bitmap(file='test6.png')
acf(mysum$resid, lag.max=length(mysum$resid)/2, main='Residual Autocorrelation Function')
grid()
dev.off()
bitmap(file='test7.png')
pacf(mysum$resid, lag.max=length(mysum$resid)/2, main='Residual Partial Autocorrelation Function')
grid()
dev.off()
bitmap(file='test8.png')
opar <- par(mfrow = c(2,2), oma = c(0, 0, 1.1, 0))
plot(mylm, las = 1, sub='Residual Diagnostics')
par(opar)
dev.off()
if (n > n25) {
bitmap(file='test9.png')
plot(kp3:nmkm3,gqarr[,2], main='Goldfeld-Quandt test',ylab='2-sided p-value',xlab='breakpoint')
grid()
dev.off()
}
load(file='createtable')
a<-table.start()
a<-table.row.start(a)
a<-table.element(a, 'Multiple Linear Regression - Estimated Regression Equation', 1, TRUE)
a<-table.row.end(a)
myeq <- colnames(x)[1]
myeq <- paste(myeq, '[t] = ', sep='')
for (i in 1:k){
if (mysum$coefficients[i,1] > 0) myeq <- paste(myeq, '+', '')
myeq <- paste(myeq, mysum$coefficients[i,1], sep=' ')
if (rownames(mysum$coefficients)[i] != '(Intercept)') {
myeq <- paste(myeq, rownames(mysum$coefficients)[i], sep='')
if (rownames(mysum$coefficients)[i] != 't') myeq <- paste(myeq, '[t]', sep='')
}
}
myeq <- paste(myeq, ' + e[t]')
a<-table.row.start(a)
a<-table.element(a, myeq)
a<-table.row.end(a)
a<-table.end(a)
table.save(a,file='mytable1.tab')
a<-table.start()
a<-table.row.start(a)
a<-table.element(a,hyperlink('ols1.htm','Multiple Linear Regression - Ordinary Least Squares',''), 6, TRUE)
a<-table.row.end(a)
a<-table.row.start(a)
a<-table.element(a,'Variable',header=TRUE)
a<-table.element(a,'Parameter',header=TRUE)
a<-table.element(a,'S.D.',header=TRUE)
a<-table.element(a,'T-STAT
H0: parameter = 0',header=TRUE)
a<-table.element(a,'2-tail p-value',header=TRUE)
a<-table.element(a,'1-tail p-value',header=TRUE)
a<-table.row.end(a)
for (i in 1:k){
a<-table.row.start(a)
a<-table.element(a,rownames(mysum$coefficients)[i],header=TRUE)
a<-table.element(a,mysum$coefficients[i,1])
a<-table.element(a, round(mysum$coefficients[i,2],6))
a<-table.element(a, round(mysum$coefficients[i,3],4))
a<-table.element(a, round(mysum$coefficients[i,4],6))
a<-table.element(a, round(mysum$coefficients[i,4]/2,6))
a<-table.row.end(a)
}
a<-table.end(a)
table.save(a,file='mytable2.tab')
a<-table.start()
a<-table.row.start(a)
a<-table.element(a, 'Multiple Linear Regression - Regression Statistics', 2, TRUE)
a<-table.row.end(a)
a<-table.row.start(a)
a<-table.element(a, 'Multiple R',1,TRUE)
a<-table.element(a, sqrt(mysum$r.squared))
a<-table.row.end(a)
a<-table.row.start(a)
a<-table.element(a, 'R-squared',1,TRUE)
a<-table.element(a, mysum$r.squared)
a<-table.row.end(a)
a<-table.row.start(a)
a<-table.element(a, 'Adjusted R-squared',1,TRUE)
a<-table.element(a, mysum$adj.r.squared)
a<-table.row.end(a)
a<-table.row.start(a)
a<-table.element(a, 'F-TEST (value)',1,TRUE)
a<-table.element(a, mysum$fstatistic[1])
a<-table.row.end(a)
a<-table.row.start(a)
a<-table.element(a, 'F-TEST (DF numerator)',1,TRUE)
a<-table.element(a, mysum$fstatistic[2])
a<-table.row.end(a)
a<-table.row.start(a)
a<-table.element(a, 'F-TEST (DF denominator)',1,TRUE)
a<-table.element(a, mysum$fstatistic[3])
a<-table.row.end(a)
a<-table.row.start(a)
a<-table.element(a, 'p-value',1,TRUE)
a<-table.element(a, 1-pf(mysum$fstatistic[1],mysum$fstatistic[2],mysum$fstatistic[3]))
a<-table.row.end(a)
a<-table.row.start(a)
a<-table.element(a, 'Multiple Linear Regression - Residual Statistics', 2, TRUE)
a<-table.row.end(a)
a<-table.row.start(a)
a<-table.element(a, 'Residual Standard Deviation',1,TRUE)
a<-table.element(a, mysum$sigma)
a<-table.row.end(a)
a<-table.row.start(a)
a<-table.element(a, 'Sum Squared Residuals',1,TRUE)
a<-table.element(a, sum(myerror*myerror))
a<-table.row.end(a)
a<-table.end(a)
table.save(a,file='mytable3.tab')
a<-table.start()
a<-table.row.start(a)
a<-table.element(a, 'Multiple Linear Regression - Actuals, Interpolation, and Residuals', 4, TRUE)
a<-table.row.end(a)
a<-table.row.start(a)
a<-table.element(a, 'Time or Index', 1, TRUE)
a<-table.element(a, 'Actuals', 1, TRUE)
a<-table.element(a, 'Interpolation
Forecast', 1, TRUE)
a<-table.element(a, 'Residuals
Prediction Error', 1, TRUE)
a<-table.row.end(a)
for (i in 1:n) {
a<-table.row.start(a)
a<-table.element(a,i, 1, TRUE)
a<-table.element(a,x[i])
a<-table.element(a,x[i]-mysum$resid[i])
a<-table.element(a,mysum$resid[i])
a<-table.row.end(a)
}
a<-table.end(a)
table.save(a,file='mytable4.tab')
if (n > n25) {
a<-table.start()
a<-table.row.start(a)
a<-table.element(a,'Goldfeld-Quandt test for Heteroskedasticity',4,TRUE)
a<-table.row.end(a)
a<-table.row.start(a)
a<-table.element(a,'p-values',header=TRUE)
a<-table.element(a,'Alternative Hypothesis',3,header=TRUE)
a<-table.row.end(a)
a<-table.row.start(a)
a<-table.element(a,'breakpoint index',header=TRUE)
a<-table.element(a,'greater',header=TRUE)
a<-table.element(a,'2-sided',header=TRUE)
a<-table.element(a,'less',header=TRUE)
a<-table.row.end(a)
for (mypoint in kp3:nmkm3) {
a<-table.row.start(a)
a<-table.element(a,mypoint,header=TRUE)
a<-table.element(a,gqarr[mypoint-kp3+1,1])
a<-table.element(a,gqarr[mypoint-kp3+1,2])
a<-table.element(a,gqarr[mypoint-kp3+1,3])
a<-table.row.end(a)
}
a<-table.end(a)
table.save(a,file='mytable5.tab')
a<-table.start()
a<-table.row.start(a)
a<-table.element(a,'Meta Analysis of Goldfeld-Quandt test for Heteroskedasticity',4,TRUE)
a<-table.row.end(a)
a<-table.row.start(a)
a<-table.element(a,'Description',header=TRUE)
a<-table.element(a,'# significant tests',header=TRUE)
a<-table.element(a,'% significant tests',header=TRUE)
a<-table.element(a,'OK/NOK',header=TRUE)
a<-table.row.end(a)
a<-table.row.start(a)
a<-table.element(a,'1% type I error level',header=TRUE)
a<-table.element(a,numsignificant1)
a<-table.element(a,numsignificant1/numgqtests)
if (numsignificant1/numgqtests < 0.01) dum <- 'OK' else dum <- 'NOK'
a<-table.element(a,dum)
a<-table.row.end(a)
a<-table.row.start(a)
a<-table.element(a,'5% type I error level',header=TRUE)
a<-table.element(a,numsignificant5)
a<-table.element(a,numsignificant5/numgqtests)
if (numsignificant5/numgqtests < 0.05) dum <- 'OK' else dum <- 'NOK'
a<-table.element(a,dum)
a<-table.row.end(a)
a<-table.row.start(a)
a<-table.element(a,'10% type I error level',header=TRUE)
a<-table.element(a,numsignificant10)
a<-table.element(a,numsignificant10/numgqtests)
if (numsignificant10/numgqtests < 0.1) dum <- 'OK' else dum <- 'NOK'
a<-table.element(a,dum)
a<-table.row.end(a)
a<-table.end(a)
table.save(a,file='mytable6.tab')
}