| Multiple Linear Regression - Estimated Regression Equation |
| Y[t] = + 2.31498095419434 + 0.213396160967166X[t] + 1.40972702884716Y1[t] -0.654418798366198Y2[t] -0.282977229990250M1[t] -0.266105111881319M2[t] -0.260737180764732M3[t] -0.307298095078962M4[t] -0.161628891531660M5[t] + 0.439218859498125M6[t] -0.450229842503455M7[t] -0.293534565143451M8[t] -0.293447343788018M9[t] -0.205758116291212M10[t] -0.0167625315974305M11[t] -0.0100239357202803t + e[t] |
| Multiple Linear Regression - Ordinary Least Squares | |||||
| Variable | Parameter | S.D. | T-STAT H0: parameter = 0 | 2-tail p-value | 1-tail p-value |
| (Intercept) | 2.31498095419434 | 0.668448 | 3.4632 | 0.001286 | 0.000643 |
| X | 0.213396160967166 | 0.112491 | 1.897 | 0.065064 | 0.032532 |
| Y1 | 1.40972702884716 | 0.125498 | 11.2331 | 0 | 0 |
| Y2 | -0.654418798366198 | 0.131587 | -4.9733 | 1.3e-05 | 6e-06 |
| M1 | -0.282977229990250 | 0.12875 | -2.1979 | 0.033808 | 0.016904 |
| M2 | -0.266105111881319 | 0.131076 | -2.0302 | 0.049027 | 0.024514 |
| M3 | -0.260737180764732 | 0.134806 | -1.9342 | 0.060189 | 0.030094 |
| M4 | -0.307298095078962 | 0.135857 | -2.2619 | 0.029207 | 0.014603 |
| M5 | -0.161628891531660 | 0.136675 | -1.1826 | 0.243957 | 0.121979 |
| M6 | 0.439218859498125 | 0.130478 | 3.3662 | 0.001693 | 0.000847 |
| M7 | -0.450229842503455 | 0.140175 | -3.2119 | 0.002604 | 0.001302 |
| M8 | -0.293534565143451 | 0.132759 | -2.211 | 0.032813 | 0.016406 |
| M9 | -0.293447343788018 | 0.141087 | -2.0799 | 0.043987 | 0.021993 |
| M10 | -0.205758116291212 | 0.141655 | -1.4525 | 0.154153 | 0.077076 |
| M11 | -0.0167625315974305 | 0.137847 | -0.1216 | 0.903823 | 0.451911 |
| t | -0.0100239357202803 | 0.004123 | -2.4315 | 0.01961 | 0.009805 |
| Multiple Linear Regression - Regression Statistics | |
| Multiple R | 0.96975621217004 |
| R-squared | 0.940427111042382 |
| Adjusted R-squared | 0.918087277683275 |
| F-TEST (value) | 42.096424620778 |
| F-TEST (DF numerator) | 15 |
| F-TEST (DF denominator) | 40 |
| p-value | 0 |
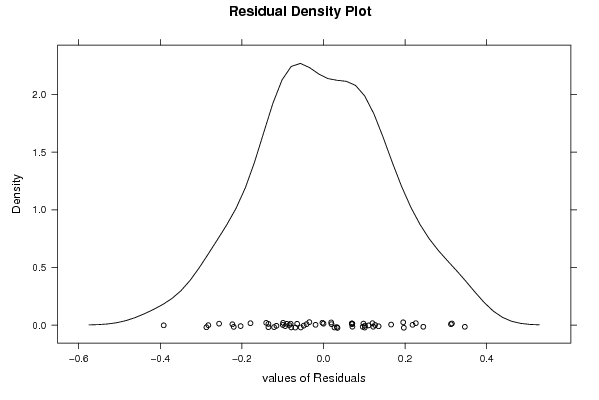
| Multiple Linear Regression - Residual Statistics | |
| Residual Standard Deviation | 0.189042547101552 |
| Sum Squared Residuals | 1.42948338458570 |
| Multiple Linear Regression - Actuals, Interpolation, and Residuals | |||
| Time or Index | Actuals | Interpolation Forecast | Residuals Prediction Error |
| 1 | 8.6 | 8.57298350724525 | 0.0270164927547522 |
| 2 | 8.5 | 8.58992063284537 | -0.089920632845368 |
| 3 | 8.2 | 8.37885004552034 | -0.17885004552034 |
| 4 | 8.1 | 7.9647889666683 | 0.135211033331702 |
| 5 | 7.9 | 8.15578717112047 | -0.255787171120464 |
| 6 | 8.6 | 8.53010746049716 | 0.0698925395028428 |
| 7 | 8.7 | 8.74832750264155 | -0.0483275026415501 |
| 8 | 8.7 | 8.57787838830965 | 0.122121611690351 |
| 9 | 8.5 | 8.50249979410818 | -0.00249979410818188 |
| 10 | 8.4 | 8.29821968011528 | 0.101780319884724 |
| 11 | 8.5 | 8.4671023858773 | 0.0328976141226986 |
| 12 | 8.7 | 8.68025556447579 | 0.0197444355242121 |
| 13 | 8.7 | 8.60375792469807 | 0.0962420753019308 |
| 14 | 8.6 | 8.47972234741348 | 0.120277652586520 |
| 15 | 8.5 | 8.33409363992507 | 0.165906360074929 |
| 16 | 8.3 | 8.20197796684246 | 0.0980220331575366 |
| 17 | 8 | 8.12111970873667 | -0.121119708736675 |
| 18 | 8.2 | 8.41990917506527 | -0.219909175065269 |
| 19 | 8.1 | 7.9987075826227 | 0.101292417377299 |
| 20 | 8.1 | 7.87352246170447 | 0.226477538295532 |
| 21 | 8 | 7.92902762717624 | 0.0709723728237596 |
| 22 | 7.9 | 7.86572021606805 | 0.0342797839319496 |
| 23 | 7.9 | 7.96916104199346 | -0.0691610419934553 |
| 24 | 8 | 8.04134151770723 | -0.0413415177072254 |
| 25 | 8 | 7.88931305488141 | 0.110686945118589 |
| 26 | 7.9 | 7.83071935743344 | 0.0692806425665585 |
| 27 | 8 | 7.68509064994503 | 0.314909350054967 |
| 28 | 7.7 | 7.83492038263186 | -0.134920382631857 |
| 29 | 7.2 | 7.48220566196811 | -0.282205661968112 |
| 30 | 7.5 | 7.56449160236389 | -0.0644916023638944 |
| 31 | 7.3 | 7.41514647247928 | -0.115146472479282 |
| 32 | 7 | 7.08354676883971 | -0.0835467688397126 |
| 33 | 7 | 6.78157570549396 | 0.218424294506043 |
| 34 | 7 | 7.05556663678034 | -0.0555666367803428 |
| 35 | 7.2 | 7.23453828575384 | -0.0345382857538436 |
| 36 | 7.3 | 7.52322228740043 | -0.223222287400427 |
| 37 | 7.1 | 7.24031006490137 | -0.140310064901373 |
| 38 | 6.8 | 6.89977096168397 | -0.0997709616839707 |
| 39 | 6.4 | 6.60308060809937 | -0.203080608099369 |
| 40 | 6.1 | 6.17893058603585 | -0.0789305860358536 |
| 41 | 6.5 | 6.1534252645552 | 0.346574735444795 |
| 42 | 7.7 | 7.50446553091343 | 0.195534469086566 |
| 43 | 7.9 | 8.03489780846169 | -0.13489780846169 |
| 44 | 7.5 | 7.89160815879857 | -0.391608158798573 |
| 45 | 6.9 | 7.18689687322162 | -0.286896873221621 |
| 46 | 6.6 | 6.68049346703633 | -0.0804934670363303 |
| 47 | 6.9 | 6.8291982863754 | 0.0708017136246003 |
| 48 | 7.7 | 7.45518063041656 | 0.24481936958344 |
| 49 | 8 | 8.0936354482739 | -0.0936354482738995 |
| 50 | 8 | 7.99986670062374 | 0.000133299376260403 |
| 51 | 7.7 | 7.79888505651019 | -0.0988850565101869 |
| 52 | 7.3 | 7.31938209782153 | -0.0193820978215279 |
| 53 | 7.4 | 7.08746219361954 | 0.312537806380456 |
| 54 | 8.1 | 8.08102623116024 | 0.0189737688397549 |
| 55 | 8.3 | 8.10292063379478 | 0.197079366205223 |
| 56 | 8.2 | 8.0734442223476 | 0.126555777652404 |
| Goldfeld-Quandt test for Heteroskedasticity | |||
| p-values | Alternative Hypothesis | ||
| breakpoint index | greater | 2-sided | less |
| 19 | 0.48840438535538 | 0.97680877071076 | 0.51159561464462 |
| 20 | 0.358416718574836 | 0.716833437149672 | 0.641583281425164 |
| 21 | 0.221790342686721 | 0.443580685373442 | 0.778209657313279 |
| 22 | 0.140791008053726 | 0.281582016107452 | 0.859208991946274 |
| 23 | 0.0847214645095539 | 0.169442929019108 | 0.915278535490446 |
| 24 | 0.0448659510587191 | 0.0897319021174381 | 0.95513404894128 |
| 25 | 0.0278706760674612 | 0.0557413521349223 | 0.97212932393254 |
| 26 | 0.0153577752851903 | 0.0307155505703806 | 0.98464222471481 |
| 27 | 0.110413905589405 | 0.220827811178810 | 0.889586094410595 |
| 28 | 0.158886631056787 | 0.317773262113574 | 0.841113368943213 |
| 29 | 0.148416605478291 | 0.296833210956582 | 0.851583394521709 |
| 30 | 0.10176642180543 | 0.20353284361086 | 0.89823357819457 |
| 31 | 0.0881543189514336 | 0.176308637902867 | 0.911845681048566 |
| 32 | 0.136238082764914 | 0.272476165529829 | 0.863761917235086 |
| 33 | 0.571864180000288 | 0.856271639999424 | 0.428135819999712 |
| 34 | 0.542511889786503 | 0.914976220426995 | 0.457488110213497 |
| 35 | 0.600259556002104 | 0.799480887995792 | 0.399740443997896 |
| 36 | 0.508370844863831 | 0.983258310272339 | 0.491629155136169 |
| 37 | 0.486514085355074 | 0.973028170710149 | 0.513485914644926 |
| Meta Analysis of Goldfeld-Quandt test for Heteroskedasticity | |||
| Description | # significant tests | % significant tests | OK/NOK |
| 1% type I error level | 0 | 0 | OK |
| 5% type I error level | 1 | 0.0526315789473684 | NOK |
| 10% type I error level | 3 | 0.157894736842105 | NOK |