| Multiple Linear Regression - Estimated Regression Equation |
| Y[t] = + 7.89361702127659 -0.30900163666121X[t] + e[t] |
| Multiple Linear Regression - Ordinary Least Squares | |||||
| Variable | Parameter | S.D. | T-STAT H0: parameter = 0 | 2-tail p-value | 1-tail p-value |
| (Intercept) | 7.89361702127659 | 0.095198 | 82.9176 | 0 | 0 |
| X | -0.30900163666121 | 0.204519 | -1.5109 | 0.136251 | 0.068125 |
| Multiple Linear Regression - Regression Statistics | |
| Multiple R | 0.194594607049005 |
| R-squared | 0.0378670610925569 |
| Adjusted R-squared | 0.0212785621458769 |
| F-TEST (value) | 2.28272981264139 |
| F-TEST (DF numerator) | 1 |
| F-TEST (DF denominator) | 58 |
| p-value | 0.136250865363998 |
| Multiple Linear Regression - Residual Statistics | |
| Residual Standard Deviation | 0.65264723775831 |
| Sum Squared Residuals | 24.705008183306 |
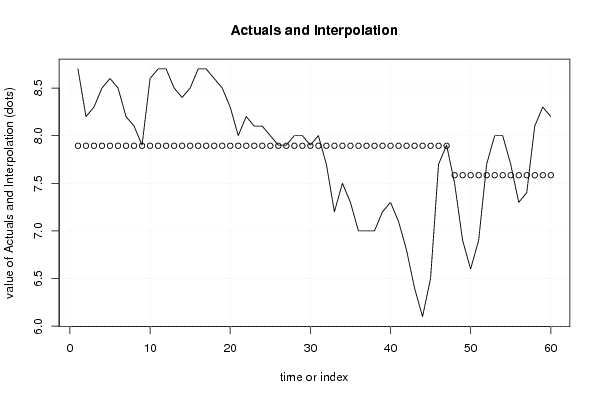
| Multiple Linear Regression - Actuals, Interpolation, and Residuals | |||
| Time or Index | Actuals | Interpolation Forecast | Residuals Prediction Error |
| 1 | 8.7 | 7.89361702127663 | 0.806382978723372 |
| 2 | 8.2 | 7.8936170212766 | 0.306382978723404 |
| 3 | 8.3 | 7.8936170212766 | 0.406382978723406 |
| 4 | 8.5 | 7.8936170212766 | 0.606382978723405 |
| 5 | 8.6 | 7.8936170212766 | 0.706382978723405 |
| 6 | 8.5 | 7.8936170212766 | 0.606382978723405 |
| 7 | 8.2 | 7.8936170212766 | 0.306382978723404 |
| 8 | 8.1 | 7.8936170212766 | 0.206382978723405 |
| 9 | 7.9 | 7.8936170212766 | 0.00638297872340536 |
| 10 | 8.6 | 7.8936170212766 | 0.706382978723405 |
| 11 | 8.7 | 7.8936170212766 | 0.806382978723404 |
| 12 | 8.7 | 7.8936170212766 | 0.806382978723404 |
| 13 | 8.5 | 7.8936170212766 | 0.606382978723405 |
| 14 | 8.4 | 7.8936170212766 | 0.506382978723405 |
| 15 | 8.5 | 7.8936170212766 | 0.606382978723405 |
| 16 | 8.7 | 7.8936170212766 | 0.806382978723404 |
| 17 | 8.7 | 7.8936170212766 | 0.806382978723404 |
| 18 | 8.6 | 7.8936170212766 | 0.706382978723405 |
| 19 | 8.5 | 7.8936170212766 | 0.606382978723405 |
| 20 | 8.3 | 7.8936170212766 | 0.406382978723406 |
| 21 | 8 | 7.8936170212766 | 0.106382978723405 |
| 22 | 8.2 | 7.8936170212766 | 0.306382978723404 |
| 23 | 8.1 | 7.8936170212766 | 0.206382978723405 |
| 24 | 8.1 | 7.8936170212766 | 0.206382978723405 |
| 25 | 8 | 7.8936170212766 | 0.106382978723405 |
| 26 | 7.9 | 7.8936170212766 | 0.00638297872340536 |
| 27 | 7.9 | 7.8936170212766 | 0.00638297872340536 |
| 28 | 8 | 7.8936170212766 | 0.106382978723405 |
| 29 | 8 | 7.8936170212766 | 0.106382978723405 |
| 30 | 7.9 | 7.8936170212766 | 0.00638297872340536 |
| 31 | 8 | 7.8936170212766 | 0.106382978723405 |
| 32 | 7.7 | 7.8936170212766 | -0.193617021276595 |
| 33 | 7.2 | 7.8936170212766 | -0.693617021276595 |
| 34 | 7.5 | 7.8936170212766 | -0.393617021276595 |
| 35 | 7.3 | 7.8936170212766 | -0.593617021276595 |
| 36 | 7 | 7.8936170212766 | -0.893617021276595 |
| 37 | 7 | 7.8936170212766 | -0.893617021276595 |
| 38 | 7 | 7.8936170212766 | -0.893617021276595 |
| 39 | 7.2 | 7.8936170212766 | -0.693617021276595 |
| 40 | 7.3 | 7.8936170212766 | -0.593617021276595 |
| 41 | 7.1 | 7.8936170212766 | -0.793617021276595 |
| 42 | 6.8 | 7.8936170212766 | -1.09361702127660 |
| 43 | 6.4 | 7.8936170212766 | -1.49361702127659 |
| 44 | 6.1 | 7.8936170212766 | -1.79361702127660 |
| 45 | 6.5 | 7.8936170212766 | -1.39361702127660 |
| 46 | 7.7 | 7.8936170212766 | -0.193617021276595 |
| 47 | 7.9 | 7.8936170212766 | 0.00638297872340536 |
| 48 | 7.5 | 7.58461538461538 | -0.0846153846153846 |
| 49 | 6.9 | 7.58461538461538 | -0.684615384615384 |
| 50 | 6.6 | 7.58461538461538 | -0.984615384615385 |
| 51 | 6.9 | 7.58461538461538 | -0.684615384615384 |
| 52 | 7.7 | 7.58461538461538 | 0.115384615384616 |
| 53 | 8 | 7.58461538461538 | 0.415384615384615 |
| 54 | 8 | 7.58461538461538 | 0.415384615384615 |
| 55 | 7.7 | 7.58461538461538 | 0.115384615384616 |
| 56 | 7.3 | 7.58461538461538 | -0.284615384615385 |
| 57 | 7.4 | 7.58461538461538 | -0.184615384615384 |
| 58 | 8.1 | 7.58461538461538 | 0.515384615384615 |
| 59 | 8.3 | 7.58461538461538 | 0.715384615384616 |
| 60 | 8.2 | 7.58461538461538 | 0.615384615384615 |
| Goldfeld-Quandt test for Heteroskedasticity | |||
| p-values | Alternative Hypothesis | ||
| breakpoint index | greater | 2-sided | less |
| 5 | 0.0604069771815258 | 0.120813954363052 | 0.939593022818474 |
| 6 | 0.0184153621821790 | 0.0368307243643579 | 0.98158463781782 |
| 7 | 0.00994694385080125 | 0.0198938877016025 | 0.990053056149199 |
| 8 | 0.00714658988706241 | 0.0142931797741248 | 0.992853410112938 |
| 9 | 0.0101985165921587 | 0.0203970331843174 | 0.989801483407841 |
| 10 | 0.00607143779421417 | 0.0121428755884283 | 0.993928562205786 |
| 11 | 0.0048307993168462 | 0.0096615986336924 | 0.995169200683154 |
| 12 | 0.00364750809711909 | 0.00729501619423817 | 0.99635249190288 |
| 13 | 0.00172196571482142 | 0.00344393142964283 | 0.998278034285179 |
| 14 | 0.000753540452384136 | 0.00150708090476827 | 0.999246459547616 |
| 15 | 0.00035662550584395 | 0.0007132510116879 | 0.999643374494156 |
| 16 | 0.000308642501082950 | 0.0006172850021659 | 0.999691357498917 |
| 17 | 0.000279482497471548 | 0.000558964994943096 | 0.999720517502528 |
| 18 | 0.000195544017788789 | 0.000391088035577577 | 0.999804455982211 |
| 19 | 0.0001216861544708 | 0.0002433723089416 | 0.99987831384553 |
| 20 | 8.1737000640426e-05 | 0.000163474001280852 | 0.99991826299936 |
| 21 | 0.000148128490660192 | 0.000296256981320383 | 0.99985187150934 |
| 22 | 0.000122312283780117 | 0.000244624567560233 | 0.99987768771622 |
| 23 | 0.000130117736089722 | 0.000260235472179444 | 0.99986988226391 |
| 24 | 0.000138137219910572 | 0.000276274439821144 | 0.99986186278009 |
| 25 | 0.000190113698213513 | 0.000380227396427027 | 0.999809886301786 |
| 26 | 0.000330891286105963 | 0.000661782572211925 | 0.999669108713894 |
| 27 | 0.000512068026539832 | 0.00102413605307966 | 0.99948793197346 |
| 28 | 0.000634008371378192 | 0.00126801674275638 | 0.999365991628622 |
| 29 | 0.000832908007175589 | 0.00166581601435118 | 0.999167091992824 |
| 30 | 0.00129950609107248 | 0.00259901218214496 | 0.998700493908927 |
| 31 | 0.00204517493327214 | 0.00409034986654428 | 0.997954825066728 |
| 32 | 0.00456429883337936 | 0.00912859766675872 | 0.99543570116662 |
| 33 | 0.0261144495719463 | 0.0522288991438925 | 0.973885550428054 |
| 34 | 0.0427094964807266 | 0.0854189929614532 | 0.957290503519273 |
| 35 | 0.0750283967085957 | 0.150056793417191 | 0.924971603291404 |
| 36 | 0.151905945824629 | 0.303811891649257 | 0.848094054175371 |
| 37 | 0.223648911801439 | 0.447297823602878 | 0.776351088198561 |
| 38 | 0.278587784532989 | 0.557175569065978 | 0.721412215467011 |
| 39 | 0.287519421524254 | 0.575038843048507 | 0.712480578475746 |
| 40 | 0.283883136915932 | 0.567766273831865 | 0.716116863084068 |
| 41 | 0.287042997106682 | 0.574085994213365 | 0.712957002893318 |
| 42 | 0.319151884457682 | 0.638303768915364 | 0.680848115542318 |
| 43 | 0.446896755102598 | 0.893793510205197 | 0.553103244897402 |
| 44 | 0.724766147499698 | 0.550467705000603 | 0.275233852500302 |
| 45 | 0.871149735077875 | 0.257700529844251 | 0.128850264922125 |
| 46 | 0.816385850969396 | 0.367228298061208 | 0.183614149030604 |
| 47 | 0.742463462530122 | 0.515073074939756 | 0.257536537469878 |
| 48 | 0.65454059043016 | 0.690918819139679 | 0.345459409569839 |
| 49 | 0.66944832985788 | 0.66110334028424 | 0.33055167014212 |
| 50 | 0.848806668409362 | 0.302386663181275 | 0.151193331590637 |
| 51 | 0.942017493773273 | 0.115965012453454 | 0.057982506226727 |
| 52 | 0.899544089802775 | 0.200911820394450 | 0.100455910197225 |
| 53 | 0.831114125624116 | 0.337771748751767 | 0.168885874375884 |
| 54 | 0.725742266585111 | 0.548515466829777 | 0.274257733414889 |
| 55 | 0.56857827224771 | 0.86284345550458 | 0.43142172775229 |
| Meta Analysis of Goldfeld-Quandt test for Heteroskedasticity | |||
| Description | # significant tests | % significant tests | OK/NOK |
| 1% type I error level | 22 | 0.431372549019608 | NOK |
| 5% type I error level | 27 | 0.529411764705882 | NOK |
| 10% type I error level | 29 | 0.568627450980392 | NOK |