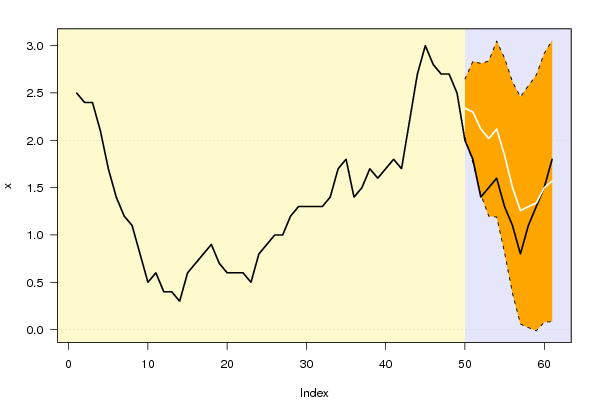
| Univariate ARIMA Extrapolation Forecast | ||||||||
| time | Y[t] | F[t] | 95% LB | 95% UB | p-value (H0: Y[t] = F[t]) | P(F[t]>Y[t-1]) | P(F[t]>Y[t-s]) | P(F[t]>Y[49]) |
| 37 | 1.5 | - | - | - | - | - | - | - |
| 38 | 1.7 | - | - | - | - | - | - | - |
| 39 | 1.6 | - | - | - | - | - | - | - |
| 40 | 1.7 | - | - | - | - | - | - | - |
| 41 | 1.8 | - | - | - | - | - | - | - |
| 42 | 1.7 | - | - | - | - | - | - | - |
| 43 | 2.2 | - | - | - | - | - | - | - |
| 44 | 2.7 | - | - | - | - | - | - | - |
| 45 | 3 | - | - | - | - | - | - | - |
| 46 | 2.8 | - | - | - | - | - | - | - |
| 47 | 2.7 | - | - | - | - | - | - | - |
| 48 | 2.7 | - | - | - | - | - | - | - |
| 49 | 2.5 | - | - | - | - | - | - | - |
| 50 | 2 | 2.3389 | 2.0304 | 2.6473 | 0.0157 | 0.1529 | 1 | 0.1529 |
| 51 | 1.8 | 2.2989 | 1.7629 | 2.8349 | 0.0341 | 0.8628 | 0.9947 | 0.231 |
| 52 | 1.4 | 2.1189 | 1.4264 | 2.8113 | 0.0209 | 0.8166 | 0.8821 | 0.1403 |
| 53 | 1.5 | 2.0189 | 1.1994 | 2.8383 | 0.1073 | 0.9306 | 0.6997 | 0.1249 |
| 54 | 1.6 | 2.1189 | 1.1895 | 3.0482 | 0.1369 | 0.9041 | 0.8115 | 0.2107 |
| 55 | 1.3 | 1.8389 | 0.8113 | 2.8664 | 0.152 | 0.6757 | 0.2454 | 0.1036 |
| 56 | 1.1 | 1.4989 | 0.3817 | 2.616 | 0.242 | 0.6364 | 0.0175 | 0.0395 |
| 57 | 0.8 | 1.2589 | 0.0588 | 2.4589 | 0.2268 | 0.6024 | 0.0022 | 0.0213 |
| 58 | 1.1 | 1.2989 | 0.0213 | 2.5764 | 0.3802 | 0.778 | 0.0106 | 0.0327 |
| 59 | 1.3 | 1.3389 | -0.0119 | 2.6896 | 0.4775 | 0.6356 | 0.0241 | 0.046 |
| 60 | 1.5 | 1.4989 | 0.0788 | 2.9189 | 0.4994 | 0.6081 | 0.0487 | 0.0835 |
| 61 | 1.8 | 1.57 | 0.0848 | 3.0553 | 0.3808 | 0.5368 | 0.1099 | 0.1099 |
| Univariate ARIMA Extrapolation Forecast Performance | ||||||
| time | % S.E. | PE | MAPE | Sq.E | MSE | RMSE |
| 50 | 0.0673 | -0.1449 | 0 | 0.1148 | 0 | 0 |
| 51 | 0.119 | -0.217 | 0.1809 | 0.2489 | 0.1818 | 0.4264 |
| 52 | 0.1667 | -0.3393 | 0.2337 | 0.5167 | 0.2935 | 0.5417 |
| 53 | 0.2071 | -0.257 | 0.2395 | 0.2692 | 0.2874 | 0.5361 |
| 54 | 0.2238 | -0.2449 | 0.2406 | 0.2692 | 0.2838 | 0.5327 |
| 55 | 0.2851 | -0.293 | 0.2493 | 0.2904 | 0.2849 | 0.5337 |
| 56 | 0.3803 | -0.2661 | 0.2517 | 0.1591 | 0.2669 | 0.5166 |
| 57 | 0.4864 | -0.3645 | 0.2658 | 0.2105 | 0.2599 | 0.5098 |
| 58 | 0.5019 | -0.1531 | 0.2533 | 0.0395 | 0.2354 | 0.4852 |
| 59 | 0.5147 | -0.029 | 0.2309 | 0.0015 | 0.212 | 0.4604 |
| 60 | 0.4834 | 8e-04 | 0.21 | 0 | 0.1927 | 0.439 |
| 61 | 0.4827 | 0.1465 | 0.2047 | 0.0529 | 0.1811 | 0.4255 |