Free Statistics

of Irreproducible Research!

Author's title

Author*The author of this computation has been verified*
R Software Modulerwasp_edauni.wasp
Title produced by softwareUnivariate Explorative Data Analysis
Date of computationWed, 23 Dec 2009 05:27:59 -0700
Cite this page as followsStatistical Computations at FreeStatistics.org, Office for Research Development and Education, URL https://freestatistics.org/blog/index.php?v=date/2009/Dec/23/t1261571333hzwflgg76rtxede.htm/, Retrieved Mon, 29 Apr 2024 10:37:03 +0000
Statistical Computations at FreeStatistics.org, Office for Research Development and Education, URL https://freestatistics.org/blog/index.php?pk=70519, Retrieved Mon, 29 Apr 2024 10:37:03 +0000
QR Codes:

Original text written by user:
IsPrivate?No (this computation is public)
User-defined keywordspaper, EDA, inflatie
Estimated Impact150
Family? (F = Feedback message, R = changed R code, M = changed R Module, P = changed Parameters, D = changed Data)
-     [(Partial) Autocorrelation Function] [] [2009-12-22 10:45:15] [0750c128064677e728c9436fc3f45ae7]
- RMPD  [Standard Deviation-Mean Plot] [] [2009-12-23 11:52:37] [0750c128064677e728c9436fc3f45ae7]
- RMPD      [Univariate Explorative Data Analysis] [] [2009-12-23 12:27:59] [30f5b608e5a1bbbae86b1702c0071566] [Current]
Feedback Forum

Post a new message
Dataseries X:
0.00104880818960712 
0.0416160237419096 
-0.0338499782241214 
0.0353477892933573 
0.087601565487602 
0.0565373386741089 
0.0120357360156818 
0.109211462484433 
-0.0467548292693616 
-0.0465986074252235 
-0.0478086219839781 
-0.0101776267295282 
-0.0043444235187697 
0.0115505520830002 
0.0294726346431616 
-0.0207464694183992 
-0.108742331006367 
-0.0120541869010857 
-0.0977511153454226 
0.0104209411511253 
-0.0182809554748909 
-0.0146226109233279 
0.0809771178310232 
0.104096768554553 
-0.11004943586931 
0.0177235034682988 
0.148210643003007 
0.0159858215388215 
-0.080339589560197 
0.0189713879536482 
-0.195098794528279 
0.271426377338088 
-0.0447053363491143 
-0.00449205682122399 
-0.0121206813775077 
0.0971613701360345 
-0.0114377411716324 
0.00464166912282404 
-0.0454225447763135 
0.107954973702707 
0.0595510227798072 
0.0543451738129008 
0.082213129590084 
0.0571745201054981 
0.0879669789090777 
0.08422144556691 
0.0555620924821564 
-0.0108013119613106 
-0.0098776288544526 
0.0743397524570958 
-0.0540211156612181 
-0.163141470530824 
-0.00914630787384997 
-0.00232652637852616 
-0.000923044690914167 
-0.0678801079101023 
-0.0715163050846508 
-0.111662424475099 
-0.0533783220931399 
-0.00129906864325586 
-0.0304997722677595 


Summary of computational transaction
Raw Inputview raw input (R code)
Raw Outputview raw output of R engine
Computing time7 seconds
R Server'Gwilym Jenkins' @ 72.249.127.135

\begin{tabular}{lllllllll}
\hline
Summary of computational transaction \tabularnewline
Raw Input & view raw input (R code)  \tabularnewline
Raw Output & view raw output of R engine  \tabularnewline
Computing time & 7 seconds \tabularnewline
R Server & 'Gwilym Jenkins' @ 72.249.127.135 \tabularnewline
\hline
\end{tabular}
%Source: https://freestatistics.org/blog/index.php?pk=70519&T=0

[TABLE]
[ROW][C]Summary of computational transaction[/C][/ROW]
[ROW][C]Raw Input[/C][C]view raw input (R code) [/C][/ROW]
[ROW][C]Raw Output[/C][C]view raw output of R engine [/C][/ROW]
[ROW][C]Computing time[/C][C]7 seconds[/C][/ROW]
[ROW][C]R Server[/C][C]'Gwilym Jenkins' @ 72.249.127.135[/C][/ROW]
[/TABLE]
Source: https://freestatistics.org/blog/index.php?pk=70519&T=0

Globally Unique Identifier (entire table): ba.freestatistics.org/blog/index.php?pk=70519&T=0

As an alternative you can also use a QR Code:  

The GUIDs for individual cells are displayed in the table below:

Summary of computational transaction
Raw Inputview raw input (R code)
Raw Outputview raw output of R engine
Computing time7 seconds
R Server'Gwilym Jenkins' @ 72.249.127.135


Descriptive Statistics
# observations61
minimum-0.195098794528279
Q1-0.0447053363491143
median-0.00232652637852616
mean0.00435238126257976
Q30.0555620924821564
maximum0.271426377338088

\begin{tabular}{lllllllll}
\hline
Descriptive Statistics \tabularnewline
# observations & 61 \tabularnewline
minimum & -0.195098794528279 \tabularnewline
Q1 & -0.0447053363491143 \tabularnewline
median & -0.00232652637852616 \tabularnewline
mean & 0.00435238126257976 \tabularnewline
Q3 & 0.0555620924821564 \tabularnewline
maximum & 0.271426377338088 \tabularnewline
\hline
\end{tabular}
%Source: https://freestatistics.org/blog/index.php?pk=70519&T=1

[TABLE]
[ROW][C]Descriptive Statistics[/C][/ROW]
[ROW][C]# observations[/C][C]61[/C][/ROW]
[ROW][C]minimum[/C][C]-0.195098794528279[/C][/ROW]
[ROW][C]Q1[/C][C]-0.0447053363491143[/C][/ROW]
[ROW][C]median[/C][C]-0.00232652637852616[/C][/ROW]
[ROW][C]mean[/C][C]0.00435238126257976[/C][/ROW]
[ROW][C]Q3[/C][C]0.0555620924821564[/C][/ROW]
[ROW][C]maximum[/C][C]0.271426377338088[/C][/ROW]
[/TABLE]
Source: https://freestatistics.org/blog/index.php?pk=70519&T=1

Globally Unique Identifier (entire table): ba.freestatistics.org/blog/index.php?pk=70519&T=1

As an alternative you can also use a QR Code:  

The GUIDs for individual cells are displayed in the table below:

Descriptive Statistics
# observations61
minimum-0.195098794528279
Q1-0.0447053363491143
median-0.00232652637852616
mean0.00435238126257976
Q30.0555620924821564
maximum0.271426377338088


Parameters (Session):
par1 = FALSE ; par2 = -0.5 ; par3 = 1 ; par4 = 0 ; par5 = 12 ; par6 = 3 ; par7 = 1 ; par8 = 2 ; par9 = 1 ;
Parameters (R input):
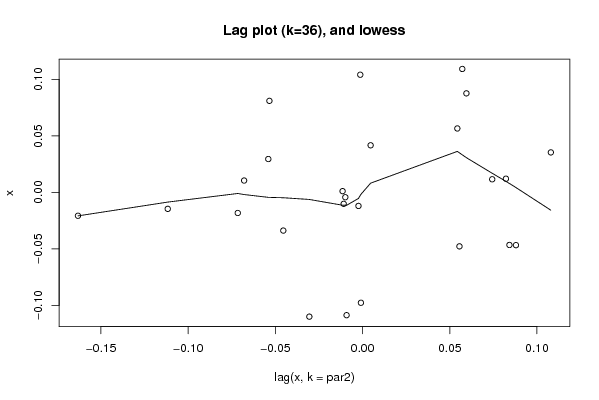
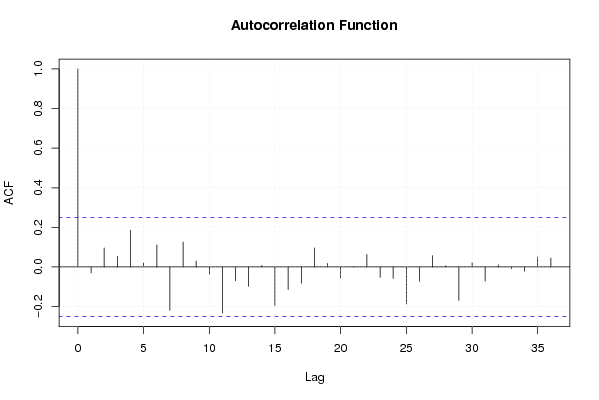
par1 = 0 ; par2 = 36 ;
R code (references can be found in the software module):
par1 <- as.numeric(par1)
par2 <- as.numeric(par2)
x <- as.ts(x)
library(lattice)
bitmap(file='pic1.png')
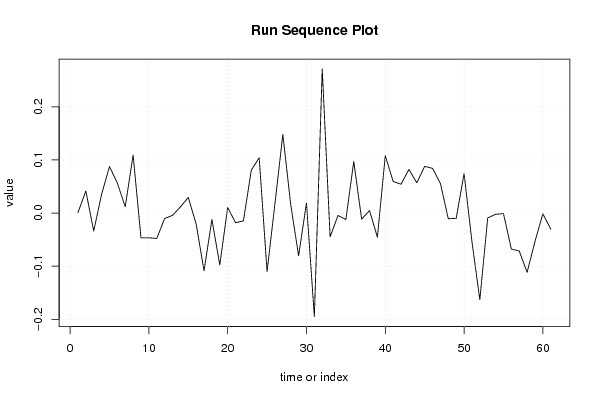
plot(x,type='l',main='Run Sequence Plot',xlab='time or index',ylab='value')
grid()
dev.off()
bitmap(file='pic2.png')
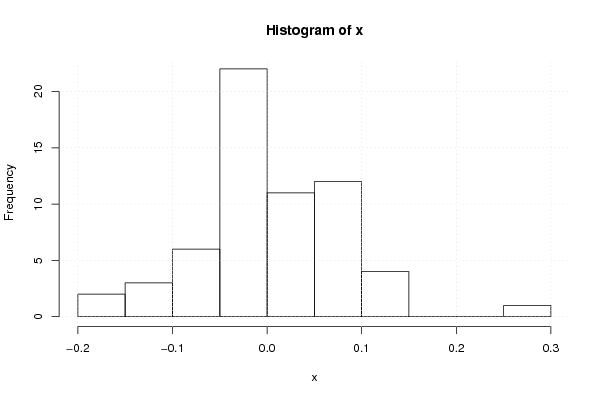
hist(x)
grid()
dev.off()
bitmap(file='pic3.png')
if (par1 > 0)
{
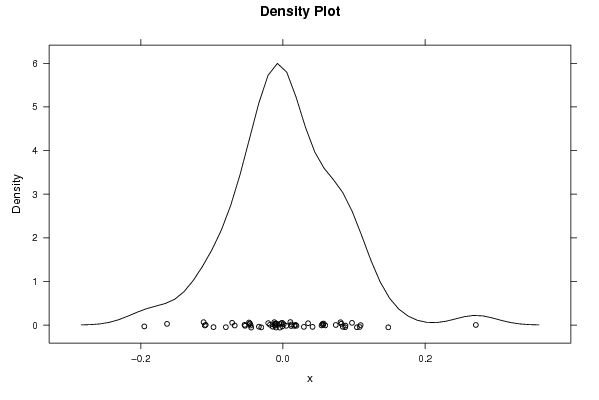
densityplot(~x,col='black',main=paste('Density Plot bw = ',par1),bw=par1)
} else {
densityplot(~x,col='black',main='Density Plot')
}
dev.off()
bitmap(file='pic4.png')
qqnorm(x)
qqline(x)
grid()
dev.off()
if (par2 > 0)
{
bitmap(file='lagplot1.png')
dum <- cbind(lag(x,k=1),x)
dum
dum1 <- dum[2:length(x),]
dum1
z <- as.data.frame(dum1)
z
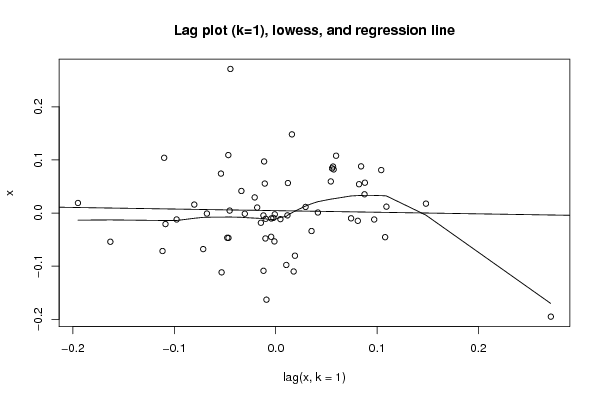
plot(z,main='Lag plot (k=1), lowess, and regression line')
lines(lowess(z))
abline(lm(z))
dev.off()
if (par2 > 1) {
bitmap(file='lagplotpar2.png')
dum <- cbind(lag(x,k=par2),x)
dum
dum1 <- dum[(par2+1):length(x),]
dum1
z <- as.data.frame(dum1)
z
mylagtitle <- 'Lag plot (k='
mylagtitle <- paste(mylagtitle,par2,sep='')
mylagtitle <- paste(mylagtitle,'), and lowess',sep='')
plot(z,main=mylagtitle)
lines(lowess(z))
dev.off()
}
bitmap(file='pic5.png')
acf(x,lag.max=par2,main='Autocorrelation Function')
grid()
dev.off()
}
summary(x)
load(file='createtable')
a<-table.start()
a<-table.row.start(a)
a<-table.element(a,'Descriptive Statistics',2,TRUE)
a<-table.row.end(a)
a<-table.row.start(a)
a<-table.element(a,'# observations',header=TRUE)
a<-table.element(a,length(x))
a<-table.row.end(a)
a<-table.row.start(a)
a<-table.element(a,'minimum',header=TRUE)
a<-table.element(a,min(x))
a<-table.row.end(a)
a<-table.row.start(a)
a<-table.element(a,'Q1',header=TRUE)
a<-table.element(a,quantile(x,0.25))
a<-table.row.end(a)
a<-table.row.start(a)
a<-table.element(a,'median',header=TRUE)
a<-table.element(a,median(x))
a<-table.row.end(a)
a<-table.row.start(a)
a<-table.element(a,'mean',header=TRUE)
a<-table.element(a,mean(x))
a<-table.row.end(a)
a<-table.row.start(a)
a<-table.element(a,'Q3',header=TRUE)
a<-table.element(a,quantile(x,0.75))
a<-table.row.end(a)
a<-table.row.start(a)
a<-table.element(a,'maximum',header=TRUE)
a<-table.element(a,max(x))
a<-table.row.end(a)
a<-table.end(a)
table.save(a,file='mytable.tab')