Free Statistics

of Irreproducible Research!

Author's title

Author*The author of this computation has been verified*
R Software Modulerwasp_smp.wasp
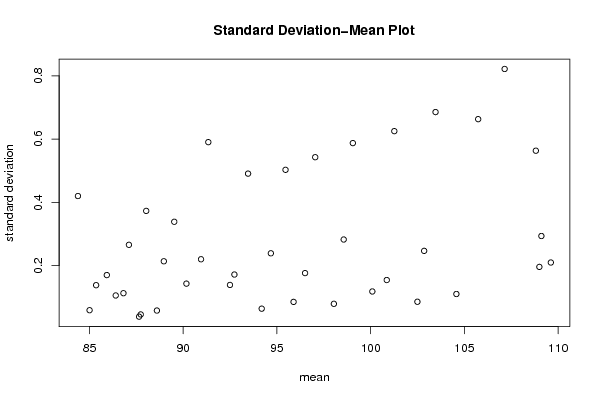
Title produced by softwareStandard Deviation-Mean Plot
Date of computationWed, 23 Dec 2009 04:23:21 -0700
Cite this page as followsStatistical Computations at FreeStatistics.org, Office for Research Development and Education, URL https://freestatistics.org/blog/index.php?v=date/2009/Dec/23/t1261567529un4yn6gvtmbv7el.htm/, Retrieved Mon, 29 Apr 2024 09:16:43 +0000
Statistical Computations at FreeStatistics.org, Office for Research Development and Education, URL https://freestatistics.org/blog/index.php?pk=70500, Retrieved Mon, 29 Apr 2024 09:16:43 +0000
QR Codes:

Original text written by user:
IsPrivate?No (this computation is public)
User-defined keywords
Estimated Impact159
Family? (F = Feedback message, R = changed R code, M = changed R Module, P = changed Parameters, D = changed Data)
-     [Variance Reduction Matrix] [VRM] [2009-12-23 10:57:13] [5e6d255681a7853beaa91b62357037a7]
- RMP     [Standard Deviation-Mean Plot] [SMP s=4] [2009-12-23 11:23:21] [b08f24ccf7d7e0757793cda532be96b3] [Current]
Feedback Forum

Post a new message
Dataseries X:
83.87
84.23
84.61
84.82
85.04
85.06
84.93
84.98
85.23
85.30
85.33
85.55
85.70
85.88
86.04
86.07
86.31
86.38
86.35
86.55
86.70
86.74
86.85
86.95
86.80
87.01
87.17
87.43
87.66
87.68
87.59
87.65
87.72
87.70
87.71
87.80
87.62
87.84
88.17
88.47
88.58
88.57
88.55
88.68
88.79
88.85
88.95
89.27
89.09
89.42
89.72
89.85
89.96
90.25
90.20
90.27
90.78
90.79
90.98
91.25
90.75
91.01
91.50
92.09
92.56
92.66
92.38
92.38
92.66
92.69
92.59
92.98
92.98
93.15
93.65
94.06
94.24
94.24
94.11
94.16
94.43
94.67
94.60
95.00
94.84
95.26
95.81
95.92
95.85
95.90
95.80
96.00
96.34
96.43
96.48
96.75
96.51
96.69
97.28
97.69
98.08
98.09
97.92
98.06
98.23
98.57
98.53
98.92
98.42
98.73
99.32
99.73
100.00
100.08
100.02
100.26
100.71
100.95
100.75
101.03
100.64
100.93
101.41
102.07
102.42
102.53
102.43
102.60
102.65
102.74
102.82
103.21
102.75
103.09
103.71
104.30
104.58
104.71
104.44
104.57
104.95
105.49
106.03
106.48
106.25
106.70
107.60
108.05
108.72
109.17
109.08
109.04
109.34
109.37
108.96
108.77
108.11
108.67
109.05
109.43
109.62
109.85
109.34
109.65
109.69
109.91
110.09


Summary of computational transaction
Raw Inputview raw input (R code)
Raw Outputview raw output of R engine
Computing time3 seconds
R Server'Gwilym Jenkins' @ 72.249.127.135

\begin{tabular}{lllllllll}
\hline
Summary of computational transaction \tabularnewline
Raw Input & view raw input (R code)  \tabularnewline
Raw Output & view raw output of R engine  \tabularnewline
Computing time & 3 seconds \tabularnewline
R Server & 'Gwilym Jenkins' @ 72.249.127.135 \tabularnewline
\hline
\end{tabular}
%Source: https://freestatistics.org/blog/index.php?pk=70500&T=0

[TABLE]
[ROW][C]Summary of computational transaction[/C][/ROW]
[ROW][C]Raw Input[/C][C]view raw input (R code) [/C][/ROW]
[ROW][C]Raw Output[/C][C]view raw output of R engine [/C][/ROW]
[ROW][C]Computing time[/C][C]3 seconds[/C][/ROW]
[ROW][C]R Server[/C][C]'Gwilym Jenkins' @ 72.249.127.135[/C][/ROW]
[/TABLE]
Source: https://freestatistics.org/blog/index.php?pk=70500&T=0

Globally Unique Identifier (entire table): ba.freestatistics.org/blog/index.php?pk=70500&T=0

As an alternative you can also use a QR Code:  

The GUIDs for individual cells are displayed in the table below:

Summary of computational transaction
Raw Inputview raw input (R code)
Raw Outputview raw output of R engine
Computing time3 seconds
R Server'Gwilym Jenkins' @ 72.249.127.135


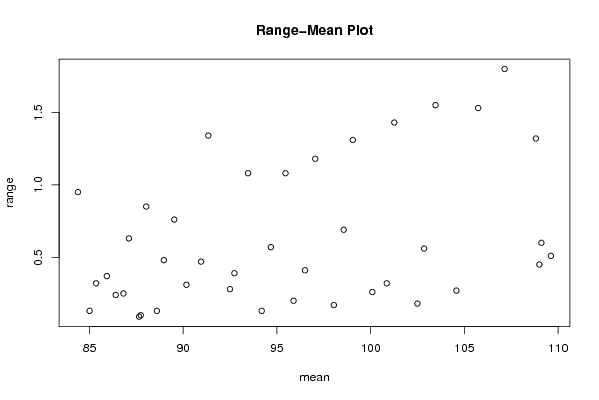
Standard Deviation-Mean Plot
SectionMeanStandard DeviationRange
184.38250.4199503938959090.949999999999989
285.00250.05909032633745160.129999999999995
385.35250.1381725973797490.319999999999993
485.92250.1701714821388500.36999999999999
586.39750.1056330125166050.239999999999995
686.810.1128420725320720.25
787.10250.2657536453183700.63000000000001
887.6450.03872983346207440.0900000000000034
987.73250.04573474244670650.0999999999999943
1088.0250.3729611239794280.849999999999994
1188.5950.05802298395176920.130000000000010
1288.9650.2137755832643170.47999999999999
1389.520.3385262175962110.759999999999991
1490.170.1430617582258350.310000000000002
1590.950.2201514630127770.469999999999999
1691.33750.590218885951081.34000000000000
1792.4950.1389244398945000.280000000000001
1892.730.1718526500620050.390000000000001
1993.460.4907816894166551.08000000000000
2094.18750.06396613687464960.129999999999995
2194.6750.2389560629069690.569999999999993
2295.45750.5028170641495761.08000000000000
2395.88750.08539125638299870.200000000000003
2496.50.1764464035715450.409999999999997
2597.04250.5426708640296291.17999999999999
2698.03750.07932002689527180.170000000000002
2798.56250.2825331838917320.689999999999998
2899.050.587253494384381.31000000000000
29100.090.1183215956619960.260000000000005
30100.860.1544884030167560.320000000000007
31101.26250.6249999999999951.42999999999999
32102.4950.08582928793055380.179999999999993
33102.8550.2466441431158090.559999999999988
34103.46250.6853405479516471.55000000000000
35104.5750.1103026140518270.269999999999996
36105.73750.6628913938195321.53
37107.150.8215838362577471.80000000000000
38109.00250.1960229578391280.450000000000003
39109.110.2935983651180690.600000000000009
40108.8150.5631755203013261.32000000000001
41109.6150.2098412098071590.509999999999991

\begin{tabular}{lllllllll}
\hline
Standard Deviation-Mean Plot \tabularnewline
Section & Mean & Standard Deviation & Range \tabularnewline
1 & 84.3825 & 0.419950393895909 & 0.949999999999989 \tabularnewline
2 & 85.0025 & 0.0590903263374516 & 0.129999999999995 \tabularnewline
3 & 85.3525 & 0.138172597379749 & 0.319999999999993 \tabularnewline
4 & 85.9225 & 0.170171482138850 & 0.36999999999999 \tabularnewline
5 & 86.3975 & 0.105633012516605 & 0.239999999999995 \tabularnewline
6 & 86.81 & 0.112842072532072 & 0.25 \tabularnewline
7 & 87.1025 & 0.265753645318370 & 0.63000000000001 \tabularnewline
8 & 87.645 & 0.0387298334620744 & 0.0900000000000034 \tabularnewline
9 & 87.7325 & 0.0457347424467065 & 0.0999999999999943 \tabularnewline
10 & 88.025 & 0.372961123979428 & 0.849999999999994 \tabularnewline
11 & 88.595 & 0.0580229839517692 & 0.130000000000010 \tabularnewline
12 & 88.965 & 0.213775583264317 & 0.47999999999999 \tabularnewline
13 & 89.52 & 0.338526217596211 & 0.759999999999991 \tabularnewline
14 & 90.17 & 0.143061758225835 & 0.310000000000002 \tabularnewline
15 & 90.95 & 0.220151463012777 & 0.469999999999999 \tabularnewline
16 & 91.3375 & 0.59021888595108 & 1.34000000000000 \tabularnewline
17 & 92.495 & 0.138924439894500 & 0.280000000000001 \tabularnewline
18 & 92.73 & 0.171852650062005 & 0.390000000000001 \tabularnewline
19 & 93.46 & 0.490781689416655 & 1.08000000000000 \tabularnewline
20 & 94.1875 & 0.0639661368746496 & 0.129999999999995 \tabularnewline
21 & 94.675 & 0.238956062906969 & 0.569999999999993 \tabularnewline
22 & 95.4575 & 0.502817064149576 & 1.08000000000000 \tabularnewline
23 & 95.8875 & 0.0853912563829987 & 0.200000000000003 \tabularnewline
24 & 96.5 & 0.176446403571545 & 0.409999999999997 \tabularnewline
25 & 97.0425 & 0.542670864029629 & 1.17999999999999 \tabularnewline
26 & 98.0375 & 0.0793200268952718 & 0.170000000000002 \tabularnewline
27 & 98.5625 & 0.282533183891732 & 0.689999999999998 \tabularnewline
28 & 99.05 & 0.58725349438438 & 1.31000000000000 \tabularnewline
29 & 100.09 & 0.118321595661996 & 0.260000000000005 \tabularnewline
30 & 100.86 & 0.154488403016756 & 0.320000000000007 \tabularnewline
31 & 101.2625 & 0.624999999999995 & 1.42999999999999 \tabularnewline
32 & 102.495 & 0.0858292879305538 & 0.179999999999993 \tabularnewline
33 & 102.855 & 0.246644143115809 & 0.559999999999988 \tabularnewline
34 & 103.4625 & 0.685340547951647 & 1.55000000000000 \tabularnewline
35 & 104.575 & 0.110302614051827 & 0.269999999999996 \tabularnewline
36 & 105.7375 & 0.662891393819532 & 1.53 \tabularnewline
37 & 107.15 & 0.821583836257747 & 1.80000000000000 \tabularnewline
38 & 109.0025 & 0.196022957839128 & 0.450000000000003 \tabularnewline
39 & 109.11 & 0.293598365118069 & 0.600000000000009 \tabularnewline
40 & 108.815 & 0.563175520301326 & 1.32000000000001 \tabularnewline
41 & 109.615 & 0.209841209807159 & 0.509999999999991 \tabularnewline
\hline
\end{tabular}
%Source: https://freestatistics.org/blog/index.php?pk=70500&T=1

[TABLE]
[ROW][C]Standard Deviation-Mean Plot[/C][/ROW]
[ROW][C]Section[/C][C]Mean[/C][C]Standard Deviation[/C][C]Range[/C][/ROW]
[ROW][C]1[/C][C]84.3825[/C][C]0.419950393895909[/C][C]0.949999999999989[/C][/ROW]
[ROW][C]2[/C][C]85.0025[/C][C]0.0590903263374516[/C][C]0.129999999999995[/C][/ROW]
[ROW][C]3[/C][C]85.3525[/C][C]0.138172597379749[/C][C]0.319999999999993[/C][/ROW]
[ROW][C]4[/C][C]85.9225[/C][C]0.170171482138850[/C][C]0.36999999999999[/C][/ROW]
[ROW][C]5[/C][C]86.3975[/C][C]0.105633012516605[/C][C]0.239999999999995[/C][/ROW]
[ROW][C]6[/C][C]86.81[/C][C]0.112842072532072[/C][C]0.25[/C][/ROW]
[ROW][C]7[/C][C]87.1025[/C][C]0.265753645318370[/C][C]0.63000000000001[/C][/ROW]
[ROW][C]8[/C][C]87.645[/C][C]0.0387298334620744[/C][C]0.0900000000000034[/C][/ROW]
[ROW][C]9[/C][C]87.7325[/C][C]0.0457347424467065[/C][C]0.0999999999999943[/C][/ROW]
[ROW][C]10[/C][C]88.025[/C][C]0.372961123979428[/C][C]0.849999999999994[/C][/ROW]
[ROW][C]11[/C][C]88.595[/C][C]0.0580229839517692[/C][C]0.130000000000010[/C][/ROW]
[ROW][C]12[/C][C]88.965[/C][C]0.213775583264317[/C][C]0.47999999999999[/C][/ROW]
[ROW][C]13[/C][C]89.52[/C][C]0.338526217596211[/C][C]0.759999999999991[/C][/ROW]
[ROW][C]14[/C][C]90.17[/C][C]0.143061758225835[/C][C]0.310000000000002[/C][/ROW]
[ROW][C]15[/C][C]90.95[/C][C]0.220151463012777[/C][C]0.469999999999999[/C][/ROW]
[ROW][C]16[/C][C]91.3375[/C][C]0.59021888595108[/C][C]1.34000000000000[/C][/ROW]
[ROW][C]17[/C][C]92.495[/C][C]0.138924439894500[/C][C]0.280000000000001[/C][/ROW]
[ROW][C]18[/C][C]92.73[/C][C]0.171852650062005[/C][C]0.390000000000001[/C][/ROW]
[ROW][C]19[/C][C]93.46[/C][C]0.490781689416655[/C][C]1.08000000000000[/C][/ROW]
[ROW][C]20[/C][C]94.1875[/C][C]0.0639661368746496[/C][C]0.129999999999995[/C][/ROW]
[ROW][C]21[/C][C]94.675[/C][C]0.238956062906969[/C][C]0.569999999999993[/C][/ROW]
[ROW][C]22[/C][C]95.4575[/C][C]0.502817064149576[/C][C]1.08000000000000[/C][/ROW]
[ROW][C]23[/C][C]95.8875[/C][C]0.0853912563829987[/C][C]0.200000000000003[/C][/ROW]
[ROW][C]24[/C][C]96.5[/C][C]0.176446403571545[/C][C]0.409999999999997[/C][/ROW]
[ROW][C]25[/C][C]97.0425[/C][C]0.542670864029629[/C][C]1.17999999999999[/C][/ROW]
[ROW][C]26[/C][C]98.0375[/C][C]0.0793200268952718[/C][C]0.170000000000002[/C][/ROW]
[ROW][C]27[/C][C]98.5625[/C][C]0.282533183891732[/C][C]0.689999999999998[/C][/ROW]
[ROW][C]28[/C][C]99.05[/C][C]0.58725349438438[/C][C]1.31000000000000[/C][/ROW]
[ROW][C]29[/C][C]100.09[/C][C]0.118321595661996[/C][C]0.260000000000005[/C][/ROW]
[ROW][C]30[/C][C]100.86[/C][C]0.154488403016756[/C][C]0.320000000000007[/C][/ROW]
[ROW][C]31[/C][C]101.2625[/C][C]0.624999999999995[/C][C]1.42999999999999[/C][/ROW]
[ROW][C]32[/C][C]102.495[/C][C]0.0858292879305538[/C][C]0.179999999999993[/C][/ROW]
[ROW][C]33[/C][C]102.855[/C][C]0.246644143115809[/C][C]0.559999999999988[/C][/ROW]
[ROW][C]34[/C][C]103.4625[/C][C]0.685340547951647[/C][C]1.55000000000000[/C][/ROW]
[ROW][C]35[/C][C]104.575[/C][C]0.110302614051827[/C][C]0.269999999999996[/C][/ROW]
[ROW][C]36[/C][C]105.7375[/C][C]0.662891393819532[/C][C]1.53[/C][/ROW]
[ROW][C]37[/C][C]107.15[/C][C]0.821583836257747[/C][C]1.80000000000000[/C][/ROW]
[ROW][C]38[/C][C]109.0025[/C][C]0.196022957839128[/C][C]0.450000000000003[/C][/ROW]
[ROW][C]39[/C][C]109.11[/C][C]0.293598365118069[/C][C]0.600000000000009[/C][/ROW]
[ROW][C]40[/C][C]108.815[/C][C]0.563175520301326[/C][C]1.32000000000001[/C][/ROW]
[ROW][C]41[/C][C]109.615[/C][C]0.209841209807159[/C][C]0.509999999999991[/C][/ROW]
[/TABLE]
Source: https://freestatistics.org/blog/index.php?pk=70500&T=1

Globally Unique Identifier (entire table): ba.freestatistics.org/blog/index.php?pk=70500&T=1

As an alternative you can also use a QR Code:  

The GUIDs for individual cells are displayed in the table below:

Standard Deviation-Mean Plot
SectionMeanStandard DeviationRange
184.38250.4199503938959090.949999999999989
285.00250.05909032633745160.129999999999995
385.35250.1381725973797490.319999999999993
485.92250.1701714821388500.36999999999999
586.39750.1056330125166050.239999999999995
686.810.1128420725320720.25
787.10250.2657536453183700.63000000000001
887.6450.03872983346207440.0900000000000034
987.73250.04573474244670650.0999999999999943
1088.0250.3729611239794280.849999999999994
1188.5950.05802298395176920.130000000000010
1288.9650.2137755832643170.47999999999999
1389.520.3385262175962110.759999999999991
1490.170.1430617582258350.310000000000002
1590.950.2201514630127770.469999999999999
1691.33750.590218885951081.34000000000000
1792.4950.1389244398945000.280000000000001
1892.730.1718526500620050.390000000000001
1993.460.4907816894166551.08000000000000
2094.18750.06396613687464960.129999999999995
2194.6750.2389560629069690.569999999999993
2295.45750.5028170641495761.08000000000000
2395.88750.08539125638299870.200000000000003
2496.50.1764464035715450.409999999999997
2597.04250.5426708640296291.17999999999999
2698.03750.07932002689527180.170000000000002
2798.56250.2825331838917320.689999999999998
2899.050.587253494384381.31000000000000
29100.090.1183215956619960.260000000000005
30100.860.1544884030167560.320000000000007
31101.26250.6249999999999951.42999999999999
32102.4950.08582928793055380.179999999999993
33102.8550.2466441431158090.559999999999988
34103.46250.6853405479516471.55000000000000
35104.5750.1103026140518270.269999999999996
36105.73750.6628913938195321.53
37107.150.8215838362577471.80000000000000
38109.00250.1960229578391280.450000000000003
39109.110.2935983651180690.600000000000009
40108.8150.5631755203013261.32000000000001
41109.6150.2098412098071590.509999999999991


Regression: S.E.(k) = alpha + beta * Mean(k)
alpha-0.712602397891834
beta0.0103761011438288
S.D.0.00406920741544725
T-STAT2.54990716483011
p-value0.0148177709545112

\begin{tabular}{lllllllll}
\hline
Regression: S.E.(k) = alpha + beta * Mean(k) \tabularnewline
alpha & -0.712602397891834 \tabularnewline
beta & 0.0103761011438288 \tabularnewline
S.D. & 0.00406920741544725 \tabularnewline
T-STAT & 2.54990716483011 \tabularnewline
p-value & 0.0148177709545112 \tabularnewline
\hline
\end{tabular}
%Source: https://freestatistics.org/blog/index.php?pk=70500&T=2

[TABLE]
[ROW][C]Regression: S.E.(k) = alpha + beta * Mean(k)[/C][/ROW]
[ROW][C]alpha[/C][C]-0.712602397891834[/C][/ROW]
[ROW][C]beta[/C][C]0.0103761011438288[/C][/ROW]
[ROW][C]S.D.[/C][C]0.00406920741544725[/C][/ROW]
[ROW][C]T-STAT[/C][C]2.54990716483011[/C][/ROW]
[ROW][C]p-value[/C][C]0.0148177709545112[/C][/ROW]
[/TABLE]
Source: https://freestatistics.org/blog/index.php?pk=70500&T=2

Globally Unique Identifier (entire table): ba.freestatistics.org/blog/index.php?pk=70500&T=2

As an alternative you can also use a QR Code:  

The GUIDs for individual cells are displayed in the table below:

Regression: S.E.(k) = alpha + beta * Mean(k)
alpha-0.712602397891834
beta0.0103761011438288
S.D.0.00406920741544725
T-STAT2.54990716483011
p-value0.0148177709545112


Regression: ln S.E.(k) = alpha + beta * ln Mean(k)
alpha-19.0581659628586
beta3.83513868217663
S.D.1.52698413406944
T-STAT2.51157729580066
p-value0.0162701948539795
Lambda-2.83513868217663

\begin{tabular}{lllllllll}
\hline
Regression: ln S.E.(k) = alpha + beta * ln Mean(k) \tabularnewline
alpha & -19.0581659628586 \tabularnewline
beta & 3.83513868217663 \tabularnewline
S.D. & 1.52698413406944 \tabularnewline
T-STAT & 2.51157729580066 \tabularnewline
p-value & 0.0162701948539795 \tabularnewline
Lambda & -2.83513868217663 \tabularnewline
\hline
\end{tabular}
%Source: https://freestatistics.org/blog/index.php?pk=70500&T=3

[TABLE]
[ROW][C]Regression: ln S.E.(k) = alpha + beta * ln Mean(k)[/C][/ROW]
[ROW][C]alpha[/C][C]-19.0581659628586[/C][/ROW]
[ROW][C]beta[/C][C]3.83513868217663[/C][/ROW]
[ROW][C]S.D.[/C][C]1.52698413406944[/C][/ROW]
[ROW][C]T-STAT[/C][C]2.51157729580066[/C][/ROW]
[ROW][C]p-value[/C][C]0.0162701948539795[/C][/ROW]
[ROW][C]Lambda[/C][C]-2.83513868217663[/C][/ROW]
[/TABLE]
Source: https://freestatistics.org/blog/index.php?pk=70500&T=3

Globally Unique Identifier (entire table): ba.freestatistics.org/blog/index.php?pk=70500&T=3

As an alternative you can also use a QR Code:  

The GUIDs for individual cells are displayed in the table below:

Regression: ln S.E.(k) = alpha + beta * ln Mean(k)
alpha-19.0581659628586
beta3.83513868217663
S.D.1.52698413406944
T-STAT2.51157729580066
p-value0.0162701948539795
Lambda-2.83513868217663


Parameters (Session):
par1 = 4 ;
Parameters (R input):
par1 = 4 ;
R code (references can be found in the software module):
par1 <- as.numeric(par1)
(n <- length(x))
(np <- floor(n / par1))
arr <- array(NA,dim=c(par1,np))
j <- 0
k <- 1
for (i in 1:(np*par1))
{
j = j + 1
arr[j,k] <- x[i]
if (j == par1) {
j = 0
k=k+1
}
}
arr
arr.mean <- array(NA,dim=np)
arr.sd <- array(NA,dim=np)
arr.range <- array(NA,dim=np)
for (j in 1:np)
{
arr.mean[j] <- mean(arr[,j],na.rm=TRUE)
arr.sd[j] <- sd(arr[,j],na.rm=TRUE)
arr.range[j] <- max(arr[,j],na.rm=TRUE) - min(arr[,j],na.rm=TRUE)
}
arr.mean
arr.sd
arr.range
(lm1 <- lm(arr.sd~arr.mean))
(lnlm1 <- lm(log(arr.sd)~log(arr.mean)))
(lm2 <- lm(arr.range~arr.mean))
bitmap(file='test1.png')
plot(arr.mean,arr.sd,main='Standard Deviation-Mean Plot',xlab='mean',ylab='standard deviation')
dev.off()
bitmap(file='test2.png')
plot(arr.mean,arr.range,main='Range-Mean Plot',xlab='mean',ylab='range')
dev.off()
load(file='createtable')
a<-table.start()
a<-table.row.start(a)
a<-table.element(a,'Standard Deviation-Mean Plot',4,TRUE)
a<-table.row.end(a)
a<-table.row.start(a)
a<-table.element(a,'Section',header=TRUE)
a<-table.element(a,'Mean',header=TRUE)
a<-table.element(a,'Standard Deviation',header=TRUE)
a<-table.element(a,'Range',header=TRUE)
a<-table.row.end(a)
for (j in 1:np) {
a<-table.row.start(a)
a<-table.element(a,j,header=TRUE)
a<-table.element(a,arr.mean[j])
a<-table.element(a,arr.sd[j] )
a<-table.element(a,arr.range[j] )
a<-table.row.end(a)
}
a<-table.end(a)
table.save(a,file='mytable.tab')
a<-table.start()
a<-table.row.start(a)
a<-table.element(a,'Regression: S.E.(k) = alpha + beta * Mean(k)',2,TRUE)
a<-table.row.end(a)
a<-table.row.start(a)
a<-table.element(a,'alpha',header=TRUE)
a<-table.element(a,lm1$coefficients[[1]])
a<-table.row.end(a)
a<-table.row.start(a)
a<-table.element(a,'beta',header=TRUE)
a<-table.element(a,lm1$coefficients[[2]])
a<-table.row.end(a)
a<-table.row.start(a)
a<-table.element(a,'S.D.',header=TRUE)
a<-table.element(a,summary(lm1)$coefficients[2,2])
a<-table.row.end(a)
a<-table.row.start(a)
a<-table.element(a,'T-STAT',header=TRUE)
a<-table.element(a,summary(lm1)$coefficients[2,3])
a<-table.row.end(a)
a<-table.row.start(a)
a<-table.element(a,'p-value',header=TRUE)
a<-table.element(a,summary(lm1)$coefficients[2,4])
a<-table.row.end(a)
a<-table.end(a)
table.save(a,file='mytable1.tab')
a<-table.start()
a<-table.row.start(a)
a<-table.element(a,'Regression: ln S.E.(k) = alpha + beta * ln Mean(k)',2,TRUE)
a<-table.row.end(a)
a<-table.row.start(a)
a<-table.element(a,'alpha',header=TRUE)
a<-table.element(a,lnlm1$coefficients[[1]])
a<-table.row.end(a)
a<-table.row.start(a)
a<-table.element(a,'beta',header=TRUE)
a<-table.element(a,lnlm1$coefficients[[2]])
a<-table.row.end(a)
a<-table.row.start(a)
a<-table.element(a,'S.D.',header=TRUE)
a<-table.element(a,summary(lnlm1)$coefficients[2,2])
a<-table.row.end(a)
a<-table.row.start(a)
a<-table.element(a,'T-STAT',header=TRUE)
a<-table.element(a,summary(lnlm1)$coefficients[2,3])
a<-table.row.end(a)
a<-table.row.start(a)
a<-table.element(a,'p-value',header=TRUE)
a<-table.element(a,summary(lnlm1)$coefficients[2,4])
a<-table.row.end(a)
a<-table.row.start(a)
a<-table.element(a,'Lambda',header=TRUE)
a<-table.element(a,1-lnlm1$coefficients[[2]])
a<-table.row.end(a)
a<-table.end(a)
table.save(a,file='mytable2.tab')