Free Statistics

of Irreproducible Research!

Author's title

Author*The author of this computation has been verified*
R Software Modulerwasp_autocorrelation.wasp
Title produced by software(Partial) Autocorrelation Function
Date of computationMon, 21 Dec 2009 09:53:21 -0700
Cite this page as followsStatistical Computations at FreeStatistics.org, Office for Research Development and Education, URL https://freestatistics.org/blog/index.php?v=date/2009/Dec/21/t1261414554jd297buyxl2buii.htm/, Retrieved Sun, 05 May 2024 08:59:30 +0000
Statistical Computations at FreeStatistics.org, Office for Research Development and Education, URL https://freestatistics.org/blog/index.php?pk=70344, Retrieved Sun, 05 May 2024 08:59:30 +0000
QR Codes:

Original text written by user:
IsPrivate?No (this computation is public)
User-defined keywords
Estimated Impact167
Family? (F = Feedback message, R = changed R code, M = changed R Module, P = changed Parameters, D = changed Data)
-     [Standard Deviation-Mean Plot] [Standard deviatio...] [2008-12-11 16:40:34] [12d343c4448a5f9e527bb31caeac580b]
-  M D  [Standard Deviation-Mean Plot] [Standard Deviatio...] [2009-12-18 19:32:26] [976efdaed7598845c859b86bc2e467ce]
- RMPD    [(Partial) Autocorrelation Function] [Autocorrelatie fu...] [2009-12-21 15:27:36] [ae69f4b008b5eaa8ebe185637a6eee4e]
-   P         [(Partial) Autocorrelation Function] [Autocorrelatie en...] [2009-12-21 16:53:21] [5313d555d4efcc917d0ed22935ab5cb0] [Current]
-   P           [(Partial) Autocorrelation Function] [Autocorrelatie fu...] [2009-12-21 17:00:29] [ae69f4b008b5eaa8ebe185637a6eee4e]
Feedback Forum

Post a new message
Dataseries X:
467
460
448
443
436
431
484
510
513
503
471
471
476
475
470
461
455
456
517
525
523
519
509
512
519
517
510
509
501
507
569
580
578
565
547
555
562
561
555
544
537
543
594
611
613
611
594
595
591
589
584
573
567
569
621
629
628
612
595
597


Summary of computational transaction
Raw Inputview raw input (R code)
Raw Outputview raw output of R engine
Computing time1 seconds
R Server'Gwilym Jenkins' @ 72.249.127.135

\begin{tabular}{lllllllll}
\hline
Summary of computational transaction \tabularnewline
Raw Input & view raw input (R code)  \tabularnewline
Raw Output & view raw output of R engine  \tabularnewline
Computing time & 1 seconds \tabularnewline
R Server & 'Gwilym Jenkins' @ 72.249.127.135 \tabularnewline
\hline
\end{tabular}
%Source: https://freestatistics.org/blog/index.php?pk=70344&T=0

[TABLE]
[ROW][C]Summary of computational transaction[/C][/ROW]
[ROW][C]Raw Input[/C][C]view raw input (R code) [/C][/ROW]
[ROW][C]Raw Output[/C][C]view raw output of R engine [/C][/ROW]
[ROW][C]Computing time[/C][C]1 seconds[/C][/ROW]
[ROW][C]R Server[/C][C]'Gwilym Jenkins' @ 72.249.127.135[/C][/ROW]
[/TABLE]
Source: https://freestatistics.org/blog/index.php?pk=70344&T=0

Globally Unique Identifier (entire table): ba.freestatistics.org/blog/index.php?pk=70344&T=0

As an alternative you can also use a QR Code:  

The GUIDs for individual cells are displayed in the table below:

Summary of computational transaction
Raw Inputview raw input (R code)
Raw Outputview raw output of R engine
Computing time1 seconds
R Server'Gwilym Jenkins' @ 72.249.127.135


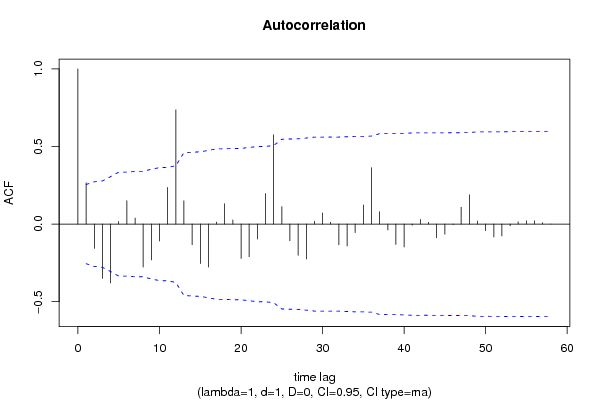
Autocorrelation Function
Time lag kACF(k)T-STATP-value
10.2660372.04350.02274
2-0.157003-1.2060.116323
3-0.350555-2.69270.004606
4-0.378808-2.90970.002548
50.0173720.13340.44715
60.150571.15650.126059
70.0391120.30040.382456
8-0.27721-2.12930.018707
9-0.231324-1.77680.040375
10-0.109569-0.84160.2017
110.236561.81710.037144
120.7366865.65860
130.1502811.15430.126509
14-0.132324-1.01640.156794
15-0.254543-1.95520.027652
16-0.277032-2.12790.018766
170.0133270.10240.459406
180.1319171.01330.157534
190.0270220.20760.418144
20-0.221696-1.70290.046927
21-0.209852-1.61190.05616
22-0.096401-0.74050.230977
230.1972241.51490.067568
240.5757544.42252.1e-05
250.1121120.86120.196321
26-0.107312-0.82430.20655
27-0.20094-1.54340.064035
28-0.224663-1.72570.044821
290.0187670.14420.442935
300.0723090.55540.290355
310.0125030.0960.461907
32-0.13358-1.02610.154528
33-0.140366-1.07820.142672
34-0.054256-0.41670.339188
350.1236030.94940.173141
360.3632852.79040.003539
370.0800380.61480.27053
38-0.037387-0.28720.387493
39-0.131269-1.00830.158716
40-0.147398-1.13220.131068
41-0.006887-0.05290.478996
420.0298030.22890.409861
430.0113490.08720.465415
44-0.088197-0.67750.250384
45-0.064766-0.49750.31035
46-0.003186-0.02450.490279
470.1092010.83880.202487
480.1887211.44960.076234
490.0196240.15070.440349
50-0.042529-0.32670.372537
51-0.0828-0.6360.263618
52-0.076658-0.58880.279114
53-0.010862-0.08340.466894
540.014750.11330.455091
550.0209510.16090.436349
560.0216130.1660.434359
570.0087880.06750.473205
589.2e-057e-040.499721
59NANANA
60NANANA

\begin{tabular}{lllllllll}
\hline
Autocorrelation Function \tabularnewline
Time lag k & ACF(k) & T-STAT & P-value \tabularnewline
1 & 0.266037 & 2.0435 & 0.02274 \tabularnewline
2 & -0.157003 & -1.206 & 0.116323 \tabularnewline
3 & -0.350555 & -2.6927 & 0.004606 \tabularnewline
4 & -0.378808 & -2.9097 & 0.002548 \tabularnewline
5 & 0.017372 & 0.1334 & 0.44715 \tabularnewline
6 & 0.15057 & 1.1565 & 0.126059 \tabularnewline
7 & 0.039112 & 0.3004 & 0.382456 \tabularnewline
8 & -0.27721 & -2.1293 & 0.018707 \tabularnewline
9 & -0.231324 & -1.7768 & 0.040375 \tabularnewline
10 & -0.109569 & -0.8416 & 0.2017 \tabularnewline
11 & 0.23656 & 1.8171 & 0.037144 \tabularnewline
12 & 0.736686 & 5.6586 & 0 \tabularnewline
13 & 0.150281 & 1.1543 & 0.126509 \tabularnewline
14 & -0.132324 & -1.0164 & 0.156794 \tabularnewline
15 & -0.254543 & -1.9552 & 0.027652 \tabularnewline
16 & -0.277032 & -2.1279 & 0.018766 \tabularnewline
17 & 0.013327 & 0.1024 & 0.459406 \tabularnewline
18 & 0.131917 & 1.0133 & 0.157534 \tabularnewline
19 & 0.027022 & 0.2076 & 0.418144 \tabularnewline
20 & -0.221696 & -1.7029 & 0.046927 \tabularnewline
21 & -0.209852 & -1.6119 & 0.05616 \tabularnewline
22 & -0.096401 & -0.7405 & 0.230977 \tabularnewline
23 & 0.197224 & 1.5149 & 0.067568 \tabularnewline
24 & 0.575754 & 4.4225 & 2.1e-05 \tabularnewline
25 & 0.112112 & 0.8612 & 0.196321 \tabularnewline
26 & -0.107312 & -0.8243 & 0.20655 \tabularnewline
27 & -0.20094 & -1.5434 & 0.064035 \tabularnewline
28 & -0.224663 & -1.7257 & 0.044821 \tabularnewline
29 & 0.018767 & 0.1442 & 0.442935 \tabularnewline
30 & 0.072309 & 0.5554 & 0.290355 \tabularnewline
31 & 0.012503 & 0.096 & 0.461907 \tabularnewline
32 & -0.13358 & -1.0261 & 0.154528 \tabularnewline
33 & -0.140366 & -1.0782 & 0.142672 \tabularnewline
34 & -0.054256 & -0.4167 & 0.339188 \tabularnewline
35 & 0.123603 & 0.9494 & 0.173141 \tabularnewline
36 & 0.363285 & 2.7904 & 0.003539 \tabularnewline
37 & 0.080038 & 0.6148 & 0.27053 \tabularnewline
38 & -0.037387 & -0.2872 & 0.387493 \tabularnewline
39 & -0.131269 & -1.0083 & 0.158716 \tabularnewline
40 & -0.147398 & -1.1322 & 0.131068 \tabularnewline
41 & -0.006887 & -0.0529 & 0.478996 \tabularnewline
42 & 0.029803 & 0.2289 & 0.409861 \tabularnewline
43 & 0.011349 & 0.0872 & 0.465415 \tabularnewline
44 & -0.088197 & -0.6775 & 0.250384 \tabularnewline
45 & -0.064766 & -0.4975 & 0.31035 \tabularnewline
46 & -0.003186 & -0.0245 & 0.490279 \tabularnewline
47 & 0.109201 & 0.8388 & 0.202487 \tabularnewline
48 & 0.188721 & 1.4496 & 0.076234 \tabularnewline
49 & 0.019624 & 0.1507 & 0.440349 \tabularnewline
50 & -0.042529 & -0.3267 & 0.372537 \tabularnewline
51 & -0.0828 & -0.636 & 0.263618 \tabularnewline
52 & -0.076658 & -0.5888 & 0.279114 \tabularnewline
53 & -0.010862 & -0.0834 & 0.466894 \tabularnewline
54 & 0.01475 & 0.1133 & 0.455091 \tabularnewline
55 & 0.020951 & 0.1609 & 0.436349 \tabularnewline
56 & 0.021613 & 0.166 & 0.434359 \tabularnewline
57 & 0.008788 & 0.0675 & 0.473205 \tabularnewline
58 & 9.2e-05 & 7e-04 & 0.499721 \tabularnewline
59 & NA & NA & NA \tabularnewline
60 & NA & NA & NA \tabularnewline
\hline
\end{tabular}
%Source: https://freestatistics.org/blog/index.php?pk=70344&T=1

[TABLE]
[ROW][C]Autocorrelation Function[/C][/ROW]
[ROW][C]Time lag k[/C][C]ACF(k)[/C][C]T-STAT[/C][C]P-value[/C][/ROW]
[ROW][C]1[/C][C]0.266037[/C][C]2.0435[/C][C]0.02274[/C][/ROW]
[ROW][C]2[/C][C]-0.157003[/C][C]-1.206[/C][C]0.116323[/C][/ROW]
[ROW][C]3[/C][C]-0.350555[/C][C]-2.6927[/C][C]0.004606[/C][/ROW]
[ROW][C]4[/C][C]-0.378808[/C][C]-2.9097[/C][C]0.002548[/C][/ROW]
[ROW][C]5[/C][C]0.017372[/C][C]0.1334[/C][C]0.44715[/C][/ROW]
[ROW][C]6[/C][C]0.15057[/C][C]1.1565[/C][C]0.126059[/C][/ROW]
[ROW][C]7[/C][C]0.039112[/C][C]0.3004[/C][C]0.382456[/C][/ROW]
[ROW][C]8[/C][C]-0.27721[/C][C]-2.1293[/C][C]0.018707[/C][/ROW]
[ROW][C]9[/C][C]-0.231324[/C][C]-1.7768[/C][C]0.040375[/C][/ROW]
[ROW][C]10[/C][C]-0.109569[/C][C]-0.8416[/C][C]0.2017[/C][/ROW]
[ROW][C]11[/C][C]0.23656[/C][C]1.8171[/C][C]0.037144[/C][/ROW]
[ROW][C]12[/C][C]0.736686[/C][C]5.6586[/C][C]0[/C][/ROW]
[ROW][C]13[/C][C]0.150281[/C][C]1.1543[/C][C]0.126509[/C][/ROW]
[ROW][C]14[/C][C]-0.132324[/C][C]-1.0164[/C][C]0.156794[/C][/ROW]
[ROW][C]15[/C][C]-0.254543[/C][C]-1.9552[/C][C]0.027652[/C][/ROW]
[ROW][C]16[/C][C]-0.277032[/C][C]-2.1279[/C][C]0.018766[/C][/ROW]
[ROW][C]17[/C][C]0.013327[/C][C]0.1024[/C][C]0.459406[/C][/ROW]
[ROW][C]18[/C][C]0.131917[/C][C]1.0133[/C][C]0.157534[/C][/ROW]
[ROW][C]19[/C][C]0.027022[/C][C]0.2076[/C][C]0.418144[/C][/ROW]
[ROW][C]20[/C][C]-0.221696[/C][C]-1.7029[/C][C]0.046927[/C][/ROW]
[ROW][C]21[/C][C]-0.209852[/C][C]-1.6119[/C][C]0.05616[/C][/ROW]
[ROW][C]22[/C][C]-0.096401[/C][C]-0.7405[/C][C]0.230977[/C][/ROW]
[ROW][C]23[/C][C]0.197224[/C][C]1.5149[/C][C]0.067568[/C][/ROW]
[ROW][C]24[/C][C]0.575754[/C][C]4.4225[/C][C]2.1e-05[/C][/ROW]
[ROW][C]25[/C][C]0.112112[/C][C]0.8612[/C][C]0.196321[/C][/ROW]
[ROW][C]26[/C][C]-0.107312[/C][C]-0.8243[/C][C]0.20655[/C][/ROW]
[ROW][C]27[/C][C]-0.20094[/C][C]-1.5434[/C][C]0.064035[/C][/ROW]
[ROW][C]28[/C][C]-0.224663[/C][C]-1.7257[/C][C]0.044821[/C][/ROW]
[ROW][C]29[/C][C]0.018767[/C][C]0.1442[/C][C]0.442935[/C][/ROW]
[ROW][C]30[/C][C]0.072309[/C][C]0.5554[/C][C]0.290355[/C][/ROW]
[ROW][C]31[/C][C]0.012503[/C][C]0.096[/C][C]0.461907[/C][/ROW]
[ROW][C]32[/C][C]-0.13358[/C][C]-1.0261[/C][C]0.154528[/C][/ROW]
[ROW][C]33[/C][C]-0.140366[/C][C]-1.0782[/C][C]0.142672[/C][/ROW]
[ROW][C]34[/C][C]-0.054256[/C][C]-0.4167[/C][C]0.339188[/C][/ROW]
[ROW][C]35[/C][C]0.123603[/C][C]0.9494[/C][C]0.173141[/C][/ROW]
[ROW][C]36[/C][C]0.363285[/C][C]2.7904[/C][C]0.003539[/C][/ROW]
[ROW][C]37[/C][C]0.080038[/C][C]0.6148[/C][C]0.27053[/C][/ROW]
[ROW][C]38[/C][C]-0.037387[/C][C]-0.2872[/C][C]0.387493[/C][/ROW]
[ROW][C]39[/C][C]-0.131269[/C][C]-1.0083[/C][C]0.158716[/C][/ROW]
[ROW][C]40[/C][C]-0.147398[/C][C]-1.1322[/C][C]0.131068[/C][/ROW]
[ROW][C]41[/C][C]-0.006887[/C][C]-0.0529[/C][C]0.478996[/C][/ROW]
[ROW][C]42[/C][C]0.029803[/C][C]0.2289[/C][C]0.409861[/C][/ROW]
[ROW][C]43[/C][C]0.011349[/C][C]0.0872[/C][C]0.465415[/C][/ROW]
[ROW][C]44[/C][C]-0.088197[/C][C]-0.6775[/C][C]0.250384[/C][/ROW]
[ROW][C]45[/C][C]-0.064766[/C][C]-0.4975[/C][C]0.31035[/C][/ROW]
[ROW][C]46[/C][C]-0.003186[/C][C]-0.0245[/C][C]0.490279[/C][/ROW]
[ROW][C]47[/C][C]0.109201[/C][C]0.8388[/C][C]0.202487[/C][/ROW]
[ROW][C]48[/C][C]0.188721[/C][C]1.4496[/C][C]0.076234[/C][/ROW]
[ROW][C]49[/C][C]0.019624[/C][C]0.1507[/C][C]0.440349[/C][/ROW]
[ROW][C]50[/C][C]-0.042529[/C][C]-0.3267[/C][C]0.372537[/C][/ROW]
[ROW][C]51[/C][C]-0.0828[/C][C]-0.636[/C][C]0.263618[/C][/ROW]
[ROW][C]52[/C][C]-0.076658[/C][C]-0.5888[/C][C]0.279114[/C][/ROW]
[ROW][C]53[/C][C]-0.010862[/C][C]-0.0834[/C][C]0.466894[/C][/ROW]
[ROW][C]54[/C][C]0.01475[/C][C]0.1133[/C][C]0.455091[/C][/ROW]
[ROW][C]55[/C][C]0.020951[/C][C]0.1609[/C][C]0.436349[/C][/ROW]
[ROW][C]56[/C][C]0.021613[/C][C]0.166[/C][C]0.434359[/C][/ROW]
[ROW][C]57[/C][C]0.008788[/C][C]0.0675[/C][C]0.473205[/C][/ROW]
[ROW][C]58[/C][C]9.2e-05[/C][C]7e-04[/C][C]0.499721[/C][/ROW]
[ROW][C]59[/C][C]NA[/C][C]NA[/C][C]NA[/C][/ROW]
[ROW][C]60[/C][C]NA[/C][C]NA[/C][C]NA[/C][/ROW]
[/TABLE]
Source: https://freestatistics.org/blog/index.php?pk=70344&T=1

Globally Unique Identifier (entire table): ba.freestatistics.org/blog/index.php?pk=70344&T=1

As an alternative you can also use a QR Code:  

The GUIDs for individual cells are displayed in the table below:

Autocorrelation Function
Time lag kACF(k)T-STATP-value
10.2660372.04350.02274
2-0.157003-1.2060.116323
3-0.350555-2.69270.004606
4-0.378808-2.90970.002548
50.0173720.13340.44715
60.150571.15650.126059
70.0391120.30040.382456
8-0.27721-2.12930.018707
9-0.231324-1.77680.040375
10-0.109569-0.84160.2017
110.236561.81710.037144
120.7366865.65860
130.1502811.15430.126509
14-0.132324-1.01640.156794
15-0.254543-1.95520.027652
16-0.277032-2.12790.018766
170.0133270.10240.459406
180.1319171.01330.157534
190.0270220.20760.418144
20-0.221696-1.70290.046927
21-0.209852-1.61190.05616
22-0.096401-0.74050.230977
230.1972241.51490.067568
240.5757544.42252.1e-05
250.1121120.86120.196321
26-0.107312-0.82430.20655
27-0.20094-1.54340.064035
28-0.224663-1.72570.044821
290.0187670.14420.442935
300.0723090.55540.290355
310.0125030.0960.461907
32-0.13358-1.02610.154528
33-0.140366-1.07820.142672
34-0.054256-0.41670.339188
350.1236030.94940.173141
360.3632852.79040.003539
370.0800380.61480.27053
38-0.037387-0.28720.387493
39-0.131269-1.00830.158716
40-0.147398-1.13220.131068
41-0.006887-0.05290.478996
420.0298030.22890.409861
430.0113490.08720.465415
44-0.088197-0.67750.250384
45-0.064766-0.49750.31035
46-0.003186-0.02450.490279
470.1092010.83880.202487
480.1887211.44960.076234
490.0196240.15070.440349
50-0.042529-0.32670.372537
51-0.0828-0.6360.263618
52-0.076658-0.58880.279114
53-0.010862-0.08340.466894
540.014750.11330.455091
550.0209510.16090.436349
560.0216130.1660.434359
570.0087880.06750.473205
589.2e-057e-040.499721
59NANANA
60NANANA


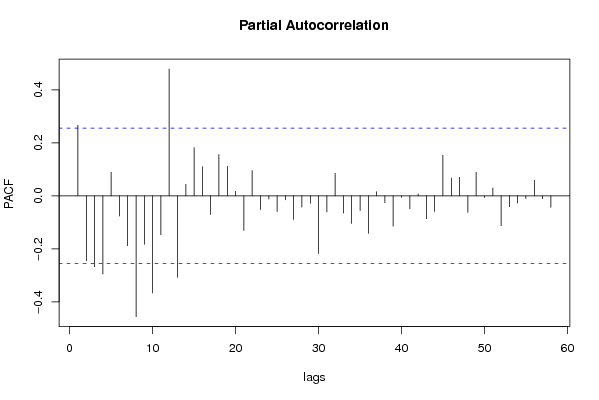
Partial Autocorrelation Function
Time lag kPACF(k)T-STATP-value
10.2660372.04350.02274
2-0.245128-1.88290.032326
3-0.26716-2.05210.022303
4-0.294877-2.2650.0136
50.0890060.68370.24843
6-0.076281-0.58590.280081
7-0.18804-1.44440.076964
8-0.455947-3.50220.000443
9-0.18281-1.40420.082752
10-0.3664-2.81440.003316
11-0.146984-1.1290.131733
120.4788583.67820.000255
13-0.30736-2.36090.010778
140.0434410.33370.369903
150.1816531.39530.084077
160.1099470.84450.200895
17-0.070394-0.54070.295373
180.1557371.19620.118194
190.1116060.85730.197384
200.0170130.13070.448237
21-0.130397-1.00160.160313
220.0955670.73410.232907
23-0.051751-0.39750.346213
24-0.012073-0.09270.463216
25-0.059235-0.4550.325392
26-0.015208-0.11680.4537
27-0.08918-0.6850.248013
28-0.042224-0.32430.373417
29-0.028028-0.21530.415144
30-0.217889-1.67360.049748
31-0.061405-0.47170.319456
320.0848840.6520.258465
33-0.065002-0.49930.309715
34-0.104248-0.80070.213246
35-0.055724-0.4280.335096
36-0.142066-1.09120.139805
370.0157860.12130.451952
38-0.025889-0.19890.421528
39-0.11476-0.88150.190815
40-0.00593-0.04550.481913
41-0.048975-0.37620.354064
420.0070810.05440.478405
43-0.086309-0.6630.254972
44-0.058784-0.45150.326633
450.1529171.17460.122441
460.0669770.51450.304425
470.0697870.5360.296971
48-0.062266-0.47830.317111
490.0887770.68190.248982
50-0.006364-0.04890.480588
510.0293340.22530.411256
52-0.112887-0.86710.1947
53-0.040924-0.31430.377185
54-0.026996-0.20740.41822
55-0.010212-0.07840.468873
560.0590380.45350.325934
57-0.01131-0.08690.465532
58-0.043393-0.33330.370042
59NANANA
60NANANA

\begin{tabular}{lllllllll}
\hline
Partial Autocorrelation Function \tabularnewline
Time lag k & PACF(k) & T-STAT & P-value \tabularnewline
1 & 0.266037 & 2.0435 & 0.02274 \tabularnewline
2 & -0.245128 & -1.8829 & 0.032326 \tabularnewline
3 & -0.26716 & -2.0521 & 0.022303 \tabularnewline
4 & -0.294877 & -2.265 & 0.0136 \tabularnewline
5 & 0.089006 & 0.6837 & 0.24843 \tabularnewline
6 & -0.076281 & -0.5859 & 0.280081 \tabularnewline
7 & -0.18804 & -1.4444 & 0.076964 \tabularnewline
8 & -0.455947 & -3.5022 & 0.000443 \tabularnewline
9 & -0.18281 & -1.4042 & 0.082752 \tabularnewline
10 & -0.3664 & -2.8144 & 0.003316 \tabularnewline
11 & -0.146984 & -1.129 & 0.131733 \tabularnewline
12 & 0.478858 & 3.6782 & 0.000255 \tabularnewline
13 & -0.30736 & -2.3609 & 0.010778 \tabularnewline
14 & 0.043441 & 0.3337 & 0.369903 \tabularnewline
15 & 0.181653 & 1.3953 & 0.084077 \tabularnewline
16 & 0.109947 & 0.8445 & 0.200895 \tabularnewline
17 & -0.070394 & -0.5407 & 0.295373 \tabularnewline
18 & 0.155737 & 1.1962 & 0.118194 \tabularnewline
19 & 0.111606 & 0.8573 & 0.197384 \tabularnewline
20 & 0.017013 & 0.1307 & 0.448237 \tabularnewline
21 & -0.130397 & -1.0016 & 0.160313 \tabularnewline
22 & 0.095567 & 0.7341 & 0.232907 \tabularnewline
23 & -0.051751 & -0.3975 & 0.346213 \tabularnewline
24 & -0.012073 & -0.0927 & 0.463216 \tabularnewline
25 & -0.059235 & -0.455 & 0.325392 \tabularnewline
26 & -0.015208 & -0.1168 & 0.4537 \tabularnewline
27 & -0.08918 & -0.685 & 0.248013 \tabularnewline
28 & -0.042224 & -0.3243 & 0.373417 \tabularnewline
29 & -0.028028 & -0.2153 & 0.415144 \tabularnewline
30 & -0.217889 & -1.6736 & 0.049748 \tabularnewline
31 & -0.061405 & -0.4717 & 0.319456 \tabularnewline
32 & 0.084884 & 0.652 & 0.258465 \tabularnewline
33 & -0.065002 & -0.4993 & 0.309715 \tabularnewline
34 & -0.104248 & -0.8007 & 0.213246 \tabularnewline
35 & -0.055724 & -0.428 & 0.335096 \tabularnewline
36 & -0.142066 & -1.0912 & 0.139805 \tabularnewline
37 & 0.015786 & 0.1213 & 0.451952 \tabularnewline
38 & -0.025889 & -0.1989 & 0.421528 \tabularnewline
39 & -0.11476 & -0.8815 & 0.190815 \tabularnewline
40 & -0.00593 & -0.0455 & 0.481913 \tabularnewline
41 & -0.048975 & -0.3762 & 0.354064 \tabularnewline
42 & 0.007081 & 0.0544 & 0.478405 \tabularnewline
43 & -0.086309 & -0.663 & 0.254972 \tabularnewline
44 & -0.058784 & -0.4515 & 0.326633 \tabularnewline
45 & 0.152917 & 1.1746 & 0.122441 \tabularnewline
46 & 0.066977 & 0.5145 & 0.304425 \tabularnewline
47 & 0.069787 & 0.536 & 0.296971 \tabularnewline
48 & -0.062266 & -0.4783 & 0.317111 \tabularnewline
49 & 0.088777 & 0.6819 & 0.248982 \tabularnewline
50 & -0.006364 & -0.0489 & 0.480588 \tabularnewline
51 & 0.029334 & 0.2253 & 0.411256 \tabularnewline
52 & -0.112887 & -0.8671 & 0.1947 \tabularnewline
53 & -0.040924 & -0.3143 & 0.377185 \tabularnewline
54 & -0.026996 & -0.2074 & 0.41822 \tabularnewline
55 & -0.010212 & -0.0784 & 0.468873 \tabularnewline
56 & 0.059038 & 0.4535 & 0.325934 \tabularnewline
57 & -0.01131 & -0.0869 & 0.465532 \tabularnewline
58 & -0.043393 & -0.3333 & 0.370042 \tabularnewline
59 & NA & NA & NA \tabularnewline
60 & NA & NA & NA \tabularnewline
\hline
\end{tabular}
%Source: https://freestatistics.org/blog/index.php?pk=70344&T=2

[TABLE]
[ROW][C]Partial Autocorrelation Function[/C][/ROW]
[ROW][C]Time lag k[/C][C]PACF(k)[/C][C]T-STAT[/C][C]P-value[/C][/ROW]
[ROW][C]1[/C][C]0.266037[/C][C]2.0435[/C][C]0.02274[/C][/ROW]
[ROW][C]2[/C][C]-0.245128[/C][C]-1.8829[/C][C]0.032326[/C][/ROW]
[ROW][C]3[/C][C]-0.26716[/C][C]-2.0521[/C][C]0.022303[/C][/ROW]
[ROW][C]4[/C][C]-0.294877[/C][C]-2.265[/C][C]0.0136[/C][/ROW]
[ROW][C]5[/C][C]0.089006[/C][C]0.6837[/C][C]0.24843[/C][/ROW]
[ROW][C]6[/C][C]-0.076281[/C][C]-0.5859[/C][C]0.280081[/C][/ROW]
[ROW][C]7[/C][C]-0.18804[/C][C]-1.4444[/C][C]0.076964[/C][/ROW]
[ROW][C]8[/C][C]-0.455947[/C][C]-3.5022[/C][C]0.000443[/C][/ROW]
[ROW][C]9[/C][C]-0.18281[/C][C]-1.4042[/C][C]0.082752[/C][/ROW]
[ROW][C]10[/C][C]-0.3664[/C][C]-2.8144[/C][C]0.003316[/C][/ROW]
[ROW][C]11[/C][C]-0.146984[/C][C]-1.129[/C][C]0.131733[/C][/ROW]
[ROW][C]12[/C][C]0.478858[/C][C]3.6782[/C][C]0.000255[/C][/ROW]
[ROW][C]13[/C][C]-0.30736[/C][C]-2.3609[/C][C]0.010778[/C][/ROW]
[ROW][C]14[/C][C]0.043441[/C][C]0.3337[/C][C]0.369903[/C][/ROW]
[ROW][C]15[/C][C]0.181653[/C][C]1.3953[/C][C]0.084077[/C][/ROW]
[ROW][C]16[/C][C]0.109947[/C][C]0.8445[/C][C]0.200895[/C][/ROW]
[ROW][C]17[/C][C]-0.070394[/C][C]-0.5407[/C][C]0.295373[/C][/ROW]
[ROW][C]18[/C][C]0.155737[/C][C]1.1962[/C][C]0.118194[/C][/ROW]
[ROW][C]19[/C][C]0.111606[/C][C]0.8573[/C][C]0.197384[/C][/ROW]
[ROW][C]20[/C][C]0.017013[/C][C]0.1307[/C][C]0.448237[/C][/ROW]
[ROW][C]21[/C][C]-0.130397[/C][C]-1.0016[/C][C]0.160313[/C][/ROW]
[ROW][C]22[/C][C]0.095567[/C][C]0.7341[/C][C]0.232907[/C][/ROW]
[ROW][C]23[/C][C]-0.051751[/C][C]-0.3975[/C][C]0.346213[/C][/ROW]
[ROW][C]24[/C][C]-0.012073[/C][C]-0.0927[/C][C]0.463216[/C][/ROW]
[ROW][C]25[/C][C]-0.059235[/C][C]-0.455[/C][C]0.325392[/C][/ROW]
[ROW][C]26[/C][C]-0.015208[/C][C]-0.1168[/C][C]0.4537[/C][/ROW]
[ROW][C]27[/C][C]-0.08918[/C][C]-0.685[/C][C]0.248013[/C][/ROW]
[ROW][C]28[/C][C]-0.042224[/C][C]-0.3243[/C][C]0.373417[/C][/ROW]
[ROW][C]29[/C][C]-0.028028[/C][C]-0.2153[/C][C]0.415144[/C][/ROW]
[ROW][C]30[/C][C]-0.217889[/C][C]-1.6736[/C][C]0.049748[/C][/ROW]
[ROW][C]31[/C][C]-0.061405[/C][C]-0.4717[/C][C]0.319456[/C][/ROW]
[ROW][C]32[/C][C]0.084884[/C][C]0.652[/C][C]0.258465[/C][/ROW]
[ROW][C]33[/C][C]-0.065002[/C][C]-0.4993[/C][C]0.309715[/C][/ROW]
[ROW][C]34[/C][C]-0.104248[/C][C]-0.8007[/C][C]0.213246[/C][/ROW]
[ROW][C]35[/C][C]-0.055724[/C][C]-0.428[/C][C]0.335096[/C][/ROW]
[ROW][C]36[/C][C]-0.142066[/C][C]-1.0912[/C][C]0.139805[/C][/ROW]
[ROW][C]37[/C][C]0.015786[/C][C]0.1213[/C][C]0.451952[/C][/ROW]
[ROW][C]38[/C][C]-0.025889[/C][C]-0.1989[/C][C]0.421528[/C][/ROW]
[ROW][C]39[/C][C]-0.11476[/C][C]-0.8815[/C][C]0.190815[/C][/ROW]
[ROW][C]40[/C][C]-0.00593[/C][C]-0.0455[/C][C]0.481913[/C][/ROW]
[ROW][C]41[/C][C]-0.048975[/C][C]-0.3762[/C][C]0.354064[/C][/ROW]
[ROW][C]42[/C][C]0.007081[/C][C]0.0544[/C][C]0.478405[/C][/ROW]
[ROW][C]43[/C][C]-0.086309[/C][C]-0.663[/C][C]0.254972[/C][/ROW]
[ROW][C]44[/C][C]-0.058784[/C][C]-0.4515[/C][C]0.326633[/C][/ROW]
[ROW][C]45[/C][C]0.152917[/C][C]1.1746[/C][C]0.122441[/C][/ROW]
[ROW][C]46[/C][C]0.066977[/C][C]0.5145[/C][C]0.304425[/C][/ROW]
[ROW][C]47[/C][C]0.069787[/C][C]0.536[/C][C]0.296971[/C][/ROW]
[ROW][C]48[/C][C]-0.062266[/C][C]-0.4783[/C][C]0.317111[/C][/ROW]
[ROW][C]49[/C][C]0.088777[/C][C]0.6819[/C][C]0.248982[/C][/ROW]
[ROW][C]50[/C][C]-0.006364[/C][C]-0.0489[/C][C]0.480588[/C][/ROW]
[ROW][C]51[/C][C]0.029334[/C][C]0.2253[/C][C]0.411256[/C][/ROW]
[ROW][C]52[/C][C]-0.112887[/C][C]-0.8671[/C][C]0.1947[/C][/ROW]
[ROW][C]53[/C][C]-0.040924[/C][C]-0.3143[/C][C]0.377185[/C][/ROW]
[ROW][C]54[/C][C]-0.026996[/C][C]-0.2074[/C][C]0.41822[/C][/ROW]
[ROW][C]55[/C][C]-0.010212[/C][C]-0.0784[/C][C]0.468873[/C][/ROW]
[ROW][C]56[/C][C]0.059038[/C][C]0.4535[/C][C]0.325934[/C][/ROW]
[ROW][C]57[/C][C]-0.01131[/C][C]-0.0869[/C][C]0.465532[/C][/ROW]
[ROW][C]58[/C][C]-0.043393[/C][C]-0.3333[/C][C]0.370042[/C][/ROW]
[ROW][C]59[/C][C]NA[/C][C]NA[/C][C]NA[/C][/ROW]
[ROW][C]60[/C][C]NA[/C][C]NA[/C][C]NA[/C][/ROW]
[/TABLE]
Source: https://freestatistics.org/blog/index.php?pk=70344&T=2

Globally Unique Identifier (entire table): ba.freestatistics.org/blog/index.php?pk=70344&T=2

As an alternative you can also use a QR Code:  

The GUIDs for individual cells are displayed in the table below:

Partial Autocorrelation Function
Time lag kPACF(k)T-STATP-value
10.2660372.04350.02274
2-0.245128-1.88290.032326
3-0.26716-2.05210.022303
4-0.294877-2.2650.0136
50.0890060.68370.24843
6-0.076281-0.58590.280081
7-0.18804-1.44440.076964
8-0.455947-3.50220.000443
9-0.18281-1.40420.082752
10-0.3664-2.81440.003316
11-0.146984-1.1290.131733
120.4788583.67820.000255
13-0.30736-2.36090.010778
140.0434410.33370.369903
150.1816531.39530.084077
160.1099470.84450.200895
17-0.070394-0.54070.295373
180.1557371.19620.118194
190.1116060.85730.197384
200.0170130.13070.448237
21-0.130397-1.00160.160313
220.0955670.73410.232907
23-0.051751-0.39750.346213
24-0.012073-0.09270.463216
25-0.059235-0.4550.325392
26-0.015208-0.11680.4537
27-0.08918-0.6850.248013
28-0.042224-0.32430.373417
29-0.028028-0.21530.415144
30-0.217889-1.67360.049748
31-0.061405-0.47170.319456
320.0848840.6520.258465
33-0.065002-0.49930.309715
34-0.104248-0.80070.213246
35-0.055724-0.4280.335096
36-0.142066-1.09120.139805
370.0157860.12130.451952
38-0.025889-0.19890.421528
39-0.11476-0.88150.190815
40-0.00593-0.04550.481913
41-0.048975-0.37620.354064
420.0070810.05440.478405
43-0.086309-0.6630.254972
44-0.058784-0.45150.326633
450.1529171.17460.122441
460.0669770.51450.304425
470.0697870.5360.296971
48-0.062266-0.47830.317111
490.0887770.68190.248982
50-0.006364-0.04890.480588
510.0293340.22530.411256
52-0.112887-0.86710.1947
53-0.040924-0.31430.377185
54-0.026996-0.20740.41822
55-0.010212-0.07840.468873
560.0590380.45350.325934
57-0.01131-0.08690.465532
58-0.043393-0.33330.370042
59NANANA
60NANANA


Parameters (Session):
par1 = 60 ; par2 = 1 ; par3 = 1 ; par4 = 0 ; par5 = 12 ; par6 = MA ; par7 = 0.95 ;
Parameters (R input):
par1 = 60 ; par2 = 1 ; par3 = 1 ; par4 = 0 ; par5 = 12 ; par6 = MA ; par7 = 0.95 ;
R code (references can be found in the software module):
if (par1 == 'Default') {
par1 = 10*log10(length(x))
} else {
par1 <- as.numeric(par1)
}
par2 <- as.numeric(par2)
par3 <- as.numeric(par3)
par4 <- as.numeric(par4)
par5 <- as.numeric(par5)
if (par6 == 'White Noise') par6 <- 'white' else par6 <- 'ma'
par7 <- as.numeric(par7)
if (par2 == 0) {
x <- log(x)
} else {
x <- (x ^ par2 - 1) / par2
}
if (par3 > 0) x <- diff(x,lag=1,difference=par3)
if (par4 > 0) x <- diff(x,lag=par5,difference=par4)
bitmap(file='pic1.png')
racf <- acf(x, par1, main='Autocorrelation', xlab='time lag', ylab='ACF', ci.type=par6, ci=par7, sub=paste('(lambda=',par2,', d=',par3,', D=',par4,', CI=', par7, ', CI type=',par6,')',sep=''))
dev.off()
bitmap(file='pic2.png')
rpacf <- pacf(x,par1,main='Partial Autocorrelation',xlab='lags',ylab='PACF')
dev.off()
(myacf <- c(racf$acf))
(mypacf <- c(rpacf$acf))
lengthx <- length(x)
sqrtn <- sqrt(lengthx)
load(file='createtable')
a<-table.start()
a<-table.row.start(a)
a<-table.element(a,'Autocorrelation Function',4,TRUE)
a<-table.row.end(a)
a<-table.row.start(a)
a<-table.element(a,'Time lag k',header=TRUE)
a<-table.element(a,hyperlink('basics.htm','ACF(k)','click here for more information about the Autocorrelation Function'),header=TRUE)
a<-table.element(a,'T-STAT',header=TRUE)
a<-table.element(a,'P-value',header=TRUE)
a<-table.row.end(a)
for (i in 2:(par1+1)) {
a<-table.row.start(a)
a<-table.element(a,i-1,header=TRUE)
a<-table.element(a,round(myacf[i],6))
mytstat <- myacf[i]*sqrtn
a<-table.element(a,round(mytstat,4))
a<-table.element(a,round(1-pt(abs(mytstat),lengthx),6))
a<-table.row.end(a)
}
a<-table.end(a)
table.save(a,file='mytable.tab')
a<-table.start()
a<-table.row.start(a)
a<-table.element(a,'Partial Autocorrelation Function',4,TRUE)
a<-table.row.end(a)
a<-table.row.start(a)
a<-table.element(a,'Time lag k',header=TRUE)
a<-table.element(a,hyperlink('basics.htm','PACF(k)','click here for more information about the Partial Autocorrelation Function'),header=TRUE)
a<-table.element(a,'T-STAT',header=TRUE)
a<-table.element(a,'P-value',header=TRUE)
a<-table.row.end(a)
for (i in 1:par1) {
a<-table.row.start(a)
a<-table.element(a,i,header=TRUE)
a<-table.element(a,round(mypacf[i],6))
mytstat <- mypacf[i]*sqrtn
a<-table.element(a,round(mytstat,4))
a<-table.element(a,round(1-pt(abs(mytstat),lengthx),6))
a<-table.row.end(a)
}
a<-table.end(a)
table.save(a,file='mytable1.tab')