Free Statistics

of Irreproducible Research!

Author's title

Author*The author of this computation has been verified*
R Software Modulerwasp_arimabackwardselection.wasp
Title produced by softwareARIMA Backward Selection
Date of computationMon, 21 Dec 2009 08:29:53 -0700
Cite this page as followsStatistical Computations at FreeStatistics.org, Office for Research Development and Education, URL https://freestatistics.org/blog/index.php?v=date/2009/Dec/21/t1261409440im2u534129ub50z.htm/, Retrieved Sun, 05 May 2024 09:47:03 +0000
Statistical Computations at FreeStatistics.org, Office for Research Development and Education, URL https://freestatistics.org/blog/index.php?pk=70273, Retrieved Sun, 05 May 2024 09:47:03 +0000
QR Codes:

Original text written by user:
IsPrivate?No (this computation is public)
User-defined keywords
Estimated Impact167
Family? (F = Feedback message, R = changed R code, M = changed R Module, P = changed Parameters, D = changed Data)
-     [Univariate Data Series] [data set] [2008-12-01 19:54:57] [b98453cac15ba1066b407e146608df68]
- RMP   [ARIMA Backward Selection] [] [2009-11-27 14:53:14] [b98453cac15ba1066b407e146608df68]
-   PD    [ARIMA Backward Selection] [] [2009-12-18 16:49:13] [ea26ab7ea3bba830cfeb08d06278d52c]
-   PD        [ARIMA Backward Selection] [] [2009-12-21 15:29:53] [4f2ce09ae9ed345cd87786097de0b173] [Current]
Feedback Forum

Post a new message
Dataseries X:
3030.29
2803.47
2767.63
2882.6
2863.36
2897.06
3012.61
3142.95
3032.93
3045.78
3110.52
3013.24
2987.1
2995.55
2833.18
2848.96
2794.83
2845.26
2915.02
2892.63
2604.42
2641.65
2659.81
2638.53
2720.25
2745.88
2735.7
2811.7
2799.43
2555.28
2304.98
2214.95
2065.81
1940.49
2042
1995.37
1946.81
1765.9
1635.25
1833.42
1910.43
1959.67
1969.6
2061.41
2093.48
2120.88
2174.56
2196.72
2350.44
2440.25
2408.64
2472.81
2407.6
2454.62
2448.05
2497.84
2645.64
2756.76
2849.27
2921.44
2981.85
3080.58
3106.22
3119.31
3061.26
3097.31
3161.69
3257.16
3277.01
3295.32
3363.99
3494.17
3667.03
3813.06
3917.96
3895.51
3801.06
3570.12
3701.61
3862.27
3970.1
4138.52
4199.75
4290.89
4443.91
4502.64
4356.98
4591.27
4696.96
4621.4
4562.84
4202.52
4296.49
4435.23
4105.18
4116.68
3844.49
3720.98
3674.4
3857.62
3801.06
3504.37
3032.6
3047.03
2962.34
2197.82
2014.45
1862.83
1905.41
1810.99
1670.07
1864.44
2052.02
2029.6
2070.83
2293.41
2443.27
2513.17
2466.92


Summary of computational transaction
Raw Inputview raw input (R code)
Raw Outputview raw output of R engine
Computing time8 seconds
R Server'Gwilym Jenkins' @ 72.249.127.135

\begin{tabular}{lllllllll}
\hline
Summary of computational transaction \tabularnewline
Raw Input & view raw input (R code)  \tabularnewline
Raw Output & view raw output of R engine  \tabularnewline
Computing time & 8 seconds \tabularnewline
R Server & 'Gwilym Jenkins' @ 72.249.127.135 \tabularnewline
\hline
\end{tabular}
%Source: https://freestatistics.org/blog/index.php?pk=70273&T=0

[TABLE]
[ROW][C]Summary of computational transaction[/C][/ROW]
[ROW][C]Raw Input[/C][C]view raw input (R code) [/C][/ROW]
[ROW][C]Raw Output[/C][C]view raw output of R engine [/C][/ROW]
[ROW][C]Computing time[/C][C]8 seconds[/C][/ROW]
[ROW][C]R Server[/C][C]'Gwilym Jenkins' @ 72.249.127.135[/C][/ROW]
[/TABLE]
Source: https://freestatistics.org/blog/index.php?pk=70273&T=0

Globally Unique Identifier (entire table): ba.freestatistics.org/blog/index.php?pk=70273&T=0

As an alternative you can also use a QR Code:  

The GUIDs for individual cells are displayed in the table below:

Summary of computational transaction
Raw Inputview raw input (R code)
Raw Outputview raw output of R engine
Computing time8 seconds
R Server'Gwilym Jenkins' @ 72.249.127.135


ARIMA Parameter Estimation and Backward Selection
Iterationar1ar2ar3ma1sar1sar2sma1
Estimates ( 1 )0.6855-0.19690.224-0.4187-0.3174-0.0560.3118
(p-val)(0.0137 )(0.1306 )(0.0194 )(0.1308 )(0.7681 )(0.6383 )(0.7719 )
Estimates ( 2 )0.6827-0.19660.2254-0.4173-0.0069-0.05160
(p-val)(0.0135 )(0.1297 )(0.0186 )(0.1296 )(0.943 )(0.6652 )(NA )
Estimates ( 3 )0.6827-0.19570.2243-0.41760-0.05150
(p-val)(0.0138 )(0.1301 )(0.0178 )(0.1304 )(NA )(0.6661 )(NA )
Estimates ( 4 )0.6793-0.18920.2218-0.4104000
(p-val)(0.0147 )(0.1428 )(0.0192 )(0.1385 )(NA )(NA )(NA )
Estimates ( 5 )0.199500.19390.0869000
(p-val)(0.6032 )(NA )(0.0308 )(0.8419 )(NA )(NA )(NA )
Estimates ( 6 )0.272100.19180000
(p-val)(0.0022 )(NA )(0.0295 )(NA )(NA )(NA )(NA )
Estimates ( 7 )NANANANANANANA
(p-val)(NA )(NA )(NA )(NA )(NA )(NA )(NA )
Estimates ( 8 )NANANANANANANA
(p-val)(NA )(NA )(NA )(NA )(NA )(NA )(NA )
Estimates ( 9 )NANANANANANANA
(p-val)(NA )(NA )(NA )(NA )(NA )(NA )(NA )
Estimates ( 10 )NANANANANANANA
(p-val)(NA )(NA )(NA )(NA )(NA )(NA )(NA )
Estimates ( 11 )NANANANANANANA
(p-val)(NA )(NA )(NA )(NA )(NA )(NA )(NA )
Estimates ( 12 )NANANANANANANA
(p-val)(NA )(NA )(NA )(NA )(NA )(NA )(NA )
Estimates ( 13 )NANANANANANANA
(p-val)(NA )(NA )(NA )(NA )(NA )(NA )(NA )

\begin{tabular}{lllllllll}
\hline
ARIMA Parameter Estimation and Backward Selection \tabularnewline
Iteration & ar1 & ar2 & ar3 & ma1 & sar1 & sar2 & sma1 \tabularnewline
Estimates ( 1 ) & 0.6855 & -0.1969 & 0.224 & -0.4187 & -0.3174 & -0.056 & 0.3118 \tabularnewline
(p-val) & (0.0137 ) & (0.1306 ) & (0.0194 ) & (0.1308 ) & (0.7681 ) & (0.6383 ) & (0.7719 ) \tabularnewline
Estimates ( 2 ) & 0.6827 & -0.1966 & 0.2254 & -0.4173 & -0.0069 & -0.0516 & 0 \tabularnewline
(p-val) & (0.0135 ) & (0.1297 ) & (0.0186 ) & (0.1296 ) & (0.943 ) & (0.6652 ) & (NA ) \tabularnewline
Estimates ( 3 ) & 0.6827 & -0.1957 & 0.2243 & -0.4176 & 0 & -0.0515 & 0 \tabularnewline
(p-val) & (0.0138 ) & (0.1301 ) & (0.0178 ) & (0.1304 ) & (NA ) & (0.6661 ) & (NA ) \tabularnewline
Estimates ( 4 ) & 0.6793 & -0.1892 & 0.2218 & -0.4104 & 0 & 0 & 0 \tabularnewline
(p-val) & (0.0147 ) & (0.1428 ) & (0.0192 ) & (0.1385 ) & (NA ) & (NA ) & (NA ) \tabularnewline
Estimates ( 5 ) & 0.1995 & 0 & 0.1939 & 0.0869 & 0 & 0 & 0 \tabularnewline
(p-val) & (0.6032 ) & (NA ) & (0.0308 ) & (0.8419 ) & (NA ) & (NA ) & (NA ) \tabularnewline
Estimates ( 6 ) & 0.2721 & 0 & 0.1918 & 0 & 0 & 0 & 0 \tabularnewline
(p-val) & (0.0022 ) & (NA ) & (0.0295 ) & (NA ) & (NA ) & (NA ) & (NA ) \tabularnewline
Estimates ( 7 ) & NA & NA & NA & NA & NA & NA & NA \tabularnewline
(p-val) & (NA ) & (NA ) & (NA ) & (NA ) & (NA ) & (NA ) & (NA ) \tabularnewline
Estimates ( 8 ) & NA & NA & NA & NA & NA & NA & NA \tabularnewline
(p-val) & (NA ) & (NA ) & (NA ) & (NA ) & (NA ) & (NA ) & (NA ) \tabularnewline
Estimates ( 9 ) & NA & NA & NA & NA & NA & NA & NA \tabularnewline
(p-val) & (NA ) & (NA ) & (NA ) & (NA ) & (NA ) & (NA ) & (NA ) \tabularnewline
Estimates ( 10 ) & NA & NA & NA & NA & NA & NA & NA \tabularnewline
(p-val) & (NA ) & (NA ) & (NA ) & (NA ) & (NA ) & (NA ) & (NA ) \tabularnewline
Estimates ( 11 ) & NA & NA & NA & NA & NA & NA & NA \tabularnewline
(p-val) & (NA ) & (NA ) & (NA ) & (NA ) & (NA ) & (NA ) & (NA ) \tabularnewline
Estimates ( 12 ) & NA & NA & NA & NA & NA & NA & NA \tabularnewline
(p-val) & (NA ) & (NA ) & (NA ) & (NA ) & (NA ) & (NA ) & (NA ) \tabularnewline
Estimates ( 13 ) & NA & NA & NA & NA & NA & NA & NA \tabularnewline
(p-val) & (NA ) & (NA ) & (NA ) & (NA ) & (NA ) & (NA ) & (NA ) \tabularnewline
\hline
\end{tabular}
%Source: https://freestatistics.org/blog/index.php?pk=70273&T=1

[TABLE]
[ROW][C]ARIMA Parameter Estimation and Backward Selection[/C][/ROW]
[ROW][C]Iteration[/C][C]ar1[/C][C]ar2[/C][C]ar3[/C][C]ma1[/C][C]sar1[/C][C]sar2[/C][C]sma1[/C][/ROW]
[ROW][C]Estimates ( 1 )[/C][C]0.6855[/C][C]-0.1969[/C][C]0.224[/C][C]-0.4187[/C][C]-0.3174[/C][C]-0.056[/C][C]0.3118[/C][/ROW]
[ROW][C](p-val)[/C][C](0.0137 )[/C][C](0.1306 )[/C][C](0.0194 )[/C][C](0.1308 )[/C][C](0.7681 )[/C][C](0.6383 )[/C][C](0.7719 )[/C][/ROW]
[ROW][C]Estimates ( 2 )[/C][C]0.6827[/C][C]-0.1966[/C][C]0.2254[/C][C]-0.4173[/C][C]-0.0069[/C][C]-0.0516[/C][C]0[/C][/ROW]
[ROW][C](p-val)[/C][C](0.0135 )[/C][C](0.1297 )[/C][C](0.0186 )[/C][C](0.1296 )[/C][C](0.943 )[/C][C](0.6652 )[/C][C](NA )[/C][/ROW]
[ROW][C]Estimates ( 3 )[/C][C]0.6827[/C][C]-0.1957[/C][C]0.2243[/C][C]-0.4176[/C][C]0[/C][C]-0.0515[/C][C]0[/C][/ROW]
[ROW][C](p-val)[/C][C](0.0138 )[/C][C](0.1301 )[/C][C](0.0178 )[/C][C](0.1304 )[/C][C](NA )[/C][C](0.6661 )[/C][C](NA )[/C][/ROW]
[ROW][C]Estimates ( 4 )[/C][C]0.6793[/C][C]-0.1892[/C][C]0.2218[/C][C]-0.4104[/C][C]0[/C][C]0[/C][C]0[/C][/ROW]
[ROW][C](p-val)[/C][C](0.0147 )[/C][C](0.1428 )[/C][C](0.0192 )[/C][C](0.1385 )[/C][C](NA )[/C][C](NA )[/C][C](NA )[/C][/ROW]
[ROW][C]Estimates ( 5 )[/C][C]0.1995[/C][C]0[/C][C]0.1939[/C][C]0.0869[/C][C]0[/C][C]0[/C][C]0[/C][/ROW]
[ROW][C](p-val)[/C][C](0.6032 )[/C][C](NA )[/C][C](0.0308 )[/C][C](0.8419 )[/C][C](NA )[/C][C](NA )[/C][C](NA )[/C][/ROW]
[ROW][C]Estimates ( 6 )[/C][C]0.2721[/C][C]0[/C][C]0.1918[/C][C]0[/C][C]0[/C][C]0[/C][C]0[/C][/ROW]
[ROW][C](p-val)[/C][C](0.0022 )[/C][C](NA )[/C][C](0.0295 )[/C][C](NA )[/C][C](NA )[/C][C](NA )[/C][C](NA )[/C][/ROW]
[ROW][C]Estimates ( 7 )[/C][C]NA[/C][C]NA[/C][C]NA[/C][C]NA[/C][C]NA[/C][C]NA[/C][C]NA[/C][/ROW]
[ROW][C](p-val)[/C][C](NA )[/C][C](NA )[/C][C](NA )[/C][C](NA )[/C][C](NA )[/C][C](NA )[/C][C](NA )[/C][/ROW]
[ROW][C]Estimates ( 8 )[/C][C]NA[/C][C]NA[/C][C]NA[/C][C]NA[/C][C]NA[/C][C]NA[/C][C]NA[/C][/ROW]
[ROW][C](p-val)[/C][C](NA )[/C][C](NA )[/C][C](NA )[/C][C](NA )[/C][C](NA )[/C][C](NA )[/C][C](NA )[/C][/ROW]
[ROW][C]Estimates ( 9 )[/C][C]NA[/C][C]NA[/C][C]NA[/C][C]NA[/C][C]NA[/C][C]NA[/C][C]NA[/C][/ROW]
[ROW][C](p-val)[/C][C](NA )[/C][C](NA )[/C][C](NA )[/C][C](NA )[/C][C](NA )[/C][C](NA )[/C][C](NA )[/C][/ROW]
[ROW][C]Estimates ( 10 )[/C][C]NA[/C][C]NA[/C][C]NA[/C][C]NA[/C][C]NA[/C][C]NA[/C][C]NA[/C][/ROW]
[ROW][C](p-val)[/C][C](NA )[/C][C](NA )[/C][C](NA )[/C][C](NA )[/C][C](NA )[/C][C](NA )[/C][C](NA )[/C][/ROW]
[ROW][C]Estimates ( 11 )[/C][C]NA[/C][C]NA[/C][C]NA[/C][C]NA[/C][C]NA[/C][C]NA[/C][C]NA[/C][/ROW]
[ROW][C](p-val)[/C][C](NA )[/C][C](NA )[/C][C](NA )[/C][C](NA )[/C][C](NA )[/C][C](NA )[/C][C](NA )[/C][/ROW]
[ROW][C]Estimates ( 12 )[/C][C]NA[/C][C]NA[/C][C]NA[/C][C]NA[/C][C]NA[/C][C]NA[/C][C]NA[/C][/ROW]
[ROW][C](p-val)[/C][C](NA )[/C][C](NA )[/C][C](NA )[/C][C](NA )[/C][C](NA )[/C][C](NA )[/C][C](NA )[/C][/ROW]
[ROW][C]Estimates ( 13 )[/C][C]NA[/C][C]NA[/C][C]NA[/C][C]NA[/C][C]NA[/C][C]NA[/C][C]NA[/C][/ROW]
[ROW][C](p-val)[/C][C](NA )[/C][C](NA )[/C][C](NA )[/C][C](NA )[/C][C](NA )[/C][C](NA )[/C][C](NA )[/C][/ROW]
[/TABLE]
Source: https://freestatistics.org/blog/index.php?pk=70273&T=1

Globally Unique Identifier (entire table): ba.freestatistics.org/blog/index.php?pk=70273&T=1

As an alternative you can also use a QR Code:  

The GUIDs for individual cells are displayed in the table below:

ARIMA Parameter Estimation and Backward Selection
Iterationar1ar2ar3ma1sar1sar2sma1
Estimates ( 1 )0.6855-0.19690.224-0.4187-0.3174-0.0560.3118
(p-val)(0.0137 )(0.1306 )(0.0194 )(0.1308 )(0.7681 )(0.6383 )(0.7719 )
Estimates ( 2 )0.6827-0.19660.2254-0.4173-0.0069-0.05160
(p-val)(0.0135 )(0.1297 )(0.0186 )(0.1296 )(0.943 )(0.6652 )(NA )
Estimates ( 3 )0.6827-0.19570.2243-0.41760-0.05150
(p-val)(0.0138 )(0.1301 )(0.0178 )(0.1304 )(NA )(0.6661 )(NA )
Estimates ( 4 )0.6793-0.18920.2218-0.4104000
(p-val)(0.0147 )(0.1428 )(0.0192 )(0.1385 )(NA )(NA )(NA )
Estimates ( 5 )0.199500.19390.0869000
(p-val)(0.6032 )(NA )(0.0308 )(0.8419 )(NA )(NA )(NA )
Estimates ( 6 )0.272100.19180000
(p-val)(0.0022 )(NA )(0.0295 )(NA )(NA )(NA )(NA )
Estimates ( 7 )NANANANANANANA
(p-val)(NA )(NA )(NA )(NA )(NA )(NA )(NA )
Estimates ( 8 )NANANANANANANA
(p-val)(NA )(NA )(NA )(NA )(NA )(NA )(NA )
Estimates ( 9 )NANANANANANANA
(p-val)(NA )(NA )(NA )(NA )(NA )(NA )(NA )
Estimates ( 10 )NANANANANANANA
(p-val)(NA )(NA )(NA )(NA )(NA )(NA )(NA )
Estimates ( 11 )NANANANANANANA
(p-val)(NA )(NA )(NA )(NA )(NA )(NA )(NA )
Estimates ( 12 )NANANANANANANA
(p-val)(NA )(NA )(NA )(NA )(NA )(NA )(NA )
Estimates ( 13 )NANANANANANANA
(p-val)(NA )(NA )(NA )(NA )(NA )(NA )(NA )


Estimated ARIMA Residuals
Value
3.03028827142852
-212.357001533948
31.2401201064933
129.921669968741
-9.28335409970617
45.2926467818523
82.6015437788435
103.841195371870
-151.578732505758
25.5719771178860
34.6850745029892
-91.8791967507014
-1.23972268010130
1.22058532078336
-145.302191535133
65.86651687017
-64.6424788698914
98.324966924482
48.093252083539
-29.9914470333692
-290.913239764183
106.484434106412
5.81645881720397
30.4664103045234
76.0977303107657
-0.806422077529078
-11.0963854909110
63.1524825586134
-37.8881732728905
-236.434864856602
-195.779954049189
-20.7055934552982
-82.0505025180219
-39.9147674998871
147.429710520151
-50.7819168993162
-10.5488194158927
-189.986740396654
-69.008087925761
239.642756971408
51.7203891844531
54.711796621833
-43.0666053918089
78.644333311891
-2.62568676666660
19.3067523055802
28.7374504057566
2.73742371214712
143.750175899493
36.2446170227013
-56.9703238661264
45.6270185436374
-99.3871852279294
74.7959217899402
-34.8920066198034
66.7762056994006
122.947611706087
72.2245568508838
54.4144370778981
20.3339692159707
22.705074144239
66.7723290869499
-13.8490108265250
-2.53129358251499
-79.58116591213
49.5769065741983
50.3414165787713
89.5060923881815
-13.9629929823245
3.08379976413244
46.2414747868097
108.614736641883
133.901733588696
86.5973333460611
43.0069474350621
-80.6236856051278
-111.272532221350
-222.763359638681
201.272703430638
135.244414616117
108.798192589286
111.961767660414
-13.2432257216915
59.1743686034388
97.0458316924487
7.90137932213293
-175.729845956591
248.956191052232
25.9282540199911
-70.6560111465778
-82.7668960241626
-361.933376609321
211.95466589847
112.921252475085
-297.686433206751
84.9949523106898
-308.770832521011
21.6115554208168
-26.0541158560982
247.544323484341
-90.6827385290503
-268.493998797200
-424.769576004259
156.423690374434
-43.6505982826079
-652.37272145297
23.0405172079800
-100.631115228999
229.785338100740
-87.3427506377375
-85.0994036222887
221.621267627064
147.847742293011
-45.3687515699826
11.9646522383946
176.950822190398
94.4267977876734
23.8066950210678
-105.412449507766

\begin{tabular}{lllllllll}
\hline
Estimated ARIMA Residuals \tabularnewline
Value \tabularnewline
3.03028827142852 \tabularnewline
-212.357001533948 \tabularnewline
31.2401201064933 \tabularnewline
129.921669968741 \tabularnewline
-9.28335409970617 \tabularnewline
45.2926467818523 \tabularnewline
82.6015437788435 \tabularnewline
103.841195371870 \tabularnewline
-151.578732505758 \tabularnewline
25.5719771178860 \tabularnewline
34.6850745029892 \tabularnewline
-91.8791967507014 \tabularnewline
-1.23972268010130 \tabularnewline
1.22058532078336 \tabularnewline
-145.302191535133 \tabularnewline
65.86651687017 \tabularnewline
-64.6424788698914 \tabularnewline
98.324966924482 \tabularnewline
48.093252083539 \tabularnewline
-29.9914470333692 \tabularnewline
-290.913239764183 \tabularnewline
106.484434106412 \tabularnewline
5.81645881720397 \tabularnewline
30.4664103045234 \tabularnewline
76.0977303107657 \tabularnewline
-0.806422077529078 \tabularnewline
-11.0963854909110 \tabularnewline
63.1524825586134 \tabularnewline
-37.8881732728905 \tabularnewline
-236.434864856602 \tabularnewline
-195.779954049189 \tabularnewline
-20.7055934552982 \tabularnewline
-82.0505025180219 \tabularnewline
-39.9147674998871 \tabularnewline
147.429710520151 \tabularnewline
-50.7819168993162 \tabularnewline
-10.5488194158927 \tabularnewline
-189.986740396654 \tabularnewline
-69.008087925761 \tabularnewline
239.642756971408 \tabularnewline
51.7203891844531 \tabularnewline
54.711796621833 \tabularnewline
-43.0666053918089 \tabularnewline
78.644333311891 \tabularnewline
-2.62568676666660 \tabularnewline
19.3067523055802 \tabularnewline
28.7374504057566 \tabularnewline
2.73742371214712 \tabularnewline
143.750175899493 \tabularnewline
36.2446170227013 \tabularnewline
-56.9703238661264 \tabularnewline
45.6270185436374 \tabularnewline
-99.3871852279294 \tabularnewline
74.7959217899402 \tabularnewline
-34.8920066198034 \tabularnewline
66.7762056994006 \tabularnewline
122.947611706087 \tabularnewline
72.2245568508838 \tabularnewline
54.4144370778981 \tabularnewline
20.3339692159707 \tabularnewline
22.705074144239 \tabularnewline
66.7723290869499 \tabularnewline
-13.8490108265250 \tabularnewline
-2.53129358251499 \tabularnewline
-79.58116591213 \tabularnewline
49.5769065741983 \tabularnewline
50.3414165787713 \tabularnewline
89.5060923881815 \tabularnewline
-13.9629929823245 \tabularnewline
3.08379976413244 \tabularnewline
46.2414747868097 \tabularnewline
108.614736641883 \tabularnewline
133.901733588696 \tabularnewline
86.5973333460611 \tabularnewline
43.0069474350621 \tabularnewline
-80.6236856051278 \tabularnewline
-111.272532221350 \tabularnewline
-222.763359638681 \tabularnewline
201.272703430638 \tabularnewline
135.244414616117 \tabularnewline
108.798192589286 \tabularnewline
111.961767660414 \tabularnewline
-13.2432257216915 \tabularnewline
59.1743686034388 \tabularnewline
97.0458316924487 \tabularnewline
7.90137932213293 \tabularnewline
-175.729845956591 \tabularnewline
248.956191052232 \tabularnewline
25.9282540199911 \tabularnewline
-70.6560111465778 \tabularnewline
-82.7668960241626 \tabularnewline
-361.933376609321 \tabularnewline
211.95466589847 \tabularnewline
112.921252475085 \tabularnewline
-297.686433206751 \tabularnewline
84.9949523106898 \tabularnewline
-308.770832521011 \tabularnewline
21.6115554208168 \tabularnewline
-26.0541158560982 \tabularnewline
247.544323484341 \tabularnewline
-90.6827385290503 \tabularnewline
-268.493998797200 \tabularnewline
-424.769576004259 \tabularnewline
156.423690374434 \tabularnewline
-43.6505982826079 \tabularnewline
-652.37272145297 \tabularnewline
23.0405172079800 \tabularnewline
-100.631115228999 \tabularnewline
229.785338100740 \tabularnewline
-87.3427506377375 \tabularnewline
-85.0994036222887 \tabularnewline
221.621267627064 \tabularnewline
147.847742293011 \tabularnewline
-45.3687515699826 \tabularnewline
11.9646522383946 \tabularnewline
176.950822190398 \tabularnewline
94.4267977876734 \tabularnewline
23.8066950210678 \tabularnewline
-105.412449507766 \tabularnewline
\hline
\end{tabular}
%Source: https://freestatistics.org/blog/index.php?pk=70273&T=2

[TABLE]
[ROW][C]Estimated ARIMA Residuals[/C][/ROW]
[ROW][C]Value[/C][/ROW]
[ROW][C]3.03028827142852[/C][/ROW]
[ROW][C]-212.357001533948[/C][/ROW]
[ROW][C]31.2401201064933[/C][/ROW]
[ROW][C]129.921669968741[/C][/ROW]
[ROW][C]-9.28335409970617[/C][/ROW]
[ROW][C]45.2926467818523[/C][/ROW]
[ROW][C]82.6015437788435[/C][/ROW]
[ROW][C]103.841195371870[/C][/ROW]
[ROW][C]-151.578732505758[/C][/ROW]
[ROW][C]25.5719771178860[/C][/ROW]
[ROW][C]34.6850745029892[/C][/ROW]
[ROW][C]-91.8791967507014[/C][/ROW]
[ROW][C]-1.23972268010130[/C][/ROW]
[ROW][C]1.22058532078336[/C][/ROW]
[ROW][C]-145.302191535133[/C][/ROW]
[ROW][C]65.86651687017[/C][/ROW]
[ROW][C]-64.6424788698914[/C][/ROW]
[ROW][C]98.324966924482[/C][/ROW]
[ROW][C]48.093252083539[/C][/ROW]
[ROW][C]-29.9914470333692[/C][/ROW]
[ROW][C]-290.913239764183[/C][/ROW]
[ROW][C]106.484434106412[/C][/ROW]
[ROW][C]5.81645881720397[/C][/ROW]
[ROW][C]30.4664103045234[/C][/ROW]
[ROW][C]76.0977303107657[/C][/ROW]
[ROW][C]-0.806422077529078[/C][/ROW]
[ROW][C]-11.0963854909110[/C][/ROW]
[ROW][C]63.1524825586134[/C][/ROW]
[ROW][C]-37.8881732728905[/C][/ROW]
[ROW][C]-236.434864856602[/C][/ROW]
[ROW][C]-195.779954049189[/C][/ROW]
[ROW][C]-20.7055934552982[/C][/ROW]
[ROW][C]-82.0505025180219[/C][/ROW]
[ROW][C]-39.9147674998871[/C][/ROW]
[ROW][C]147.429710520151[/C][/ROW]
[ROW][C]-50.7819168993162[/C][/ROW]
[ROW][C]-10.5488194158927[/C][/ROW]
[ROW][C]-189.986740396654[/C][/ROW]
[ROW][C]-69.008087925761[/C][/ROW]
[ROW][C]239.642756971408[/C][/ROW]
[ROW][C]51.7203891844531[/C][/ROW]
[ROW][C]54.711796621833[/C][/ROW]
[ROW][C]-43.0666053918089[/C][/ROW]
[ROW][C]78.644333311891[/C][/ROW]
[ROW][C]-2.62568676666660[/C][/ROW]
[ROW][C]19.3067523055802[/C][/ROW]
[ROW][C]28.7374504057566[/C][/ROW]
[ROW][C]2.73742371214712[/C][/ROW]
[ROW][C]143.750175899493[/C][/ROW]
[ROW][C]36.2446170227013[/C][/ROW]
[ROW][C]-56.9703238661264[/C][/ROW]
[ROW][C]45.6270185436374[/C][/ROW]
[ROW][C]-99.3871852279294[/C][/ROW]
[ROW][C]74.7959217899402[/C][/ROW]
[ROW][C]-34.8920066198034[/C][/ROW]
[ROW][C]66.7762056994006[/C][/ROW]
[ROW][C]122.947611706087[/C][/ROW]
[ROW][C]72.2245568508838[/C][/ROW]
[ROW][C]54.4144370778981[/C][/ROW]
[ROW][C]20.3339692159707[/C][/ROW]
[ROW][C]22.705074144239[/C][/ROW]
[ROW][C]66.7723290869499[/C][/ROW]
[ROW][C]-13.8490108265250[/C][/ROW]
[ROW][C]-2.53129358251499[/C][/ROW]
[ROW][C]-79.58116591213[/C][/ROW]
[ROW][C]49.5769065741983[/C][/ROW]
[ROW][C]50.3414165787713[/C][/ROW]
[ROW][C]89.5060923881815[/C][/ROW]
[ROW][C]-13.9629929823245[/C][/ROW]
[ROW][C]3.08379976413244[/C][/ROW]
[ROW][C]46.2414747868097[/C][/ROW]
[ROW][C]108.614736641883[/C][/ROW]
[ROW][C]133.901733588696[/C][/ROW]
[ROW][C]86.5973333460611[/C][/ROW]
[ROW][C]43.0069474350621[/C][/ROW]
[ROW][C]-80.6236856051278[/C][/ROW]
[ROW][C]-111.272532221350[/C][/ROW]
[ROW][C]-222.763359638681[/C][/ROW]
[ROW][C]201.272703430638[/C][/ROW]
[ROW][C]135.244414616117[/C][/ROW]
[ROW][C]108.798192589286[/C][/ROW]
[ROW][C]111.961767660414[/C][/ROW]
[ROW][C]-13.2432257216915[/C][/ROW]
[ROW][C]59.1743686034388[/C][/ROW]
[ROW][C]97.0458316924487[/C][/ROW]
[ROW][C]7.90137932213293[/C][/ROW]
[ROW][C]-175.729845956591[/C][/ROW]
[ROW][C]248.956191052232[/C][/ROW]
[ROW][C]25.9282540199911[/C][/ROW]
[ROW][C]-70.6560111465778[/C][/ROW]
[ROW][C]-82.7668960241626[/C][/ROW]
[ROW][C]-361.933376609321[/C][/ROW]
[ROW][C]211.95466589847[/C][/ROW]
[ROW][C]112.921252475085[/C][/ROW]
[ROW][C]-297.686433206751[/C][/ROW]
[ROW][C]84.9949523106898[/C][/ROW]
[ROW][C]-308.770832521011[/C][/ROW]
[ROW][C]21.6115554208168[/C][/ROW]
[ROW][C]-26.0541158560982[/C][/ROW]
[ROW][C]247.544323484341[/C][/ROW]
[ROW][C]-90.6827385290503[/C][/ROW]
[ROW][C]-268.493998797200[/C][/ROW]
[ROW][C]-424.769576004259[/C][/ROW]
[ROW][C]156.423690374434[/C][/ROW]
[ROW][C]-43.6505982826079[/C][/ROW]
[ROW][C]-652.37272145297[/C][/ROW]
[ROW][C]23.0405172079800[/C][/ROW]
[ROW][C]-100.631115228999[/C][/ROW]
[ROW][C]229.785338100740[/C][/ROW]
[ROW][C]-87.3427506377375[/C][/ROW]
[ROW][C]-85.0994036222887[/C][/ROW]
[ROW][C]221.621267627064[/C][/ROW]
[ROW][C]147.847742293011[/C][/ROW]
[ROW][C]-45.3687515699826[/C][/ROW]
[ROW][C]11.9646522383946[/C][/ROW]
[ROW][C]176.950822190398[/C][/ROW]
[ROW][C]94.4267977876734[/C][/ROW]
[ROW][C]23.8066950210678[/C][/ROW]
[ROW][C]-105.412449507766[/C][/ROW]
[/TABLE]
Source: https://freestatistics.org/blog/index.php?pk=70273&T=2

Globally Unique Identifier (entire table): ba.freestatistics.org/blog/index.php?pk=70273&T=2

As an alternative you can also use a QR Code:  

The GUIDs for individual cells are displayed in the table below:

Estimated ARIMA Residuals
Value
3.03028827142852
-212.357001533948
31.2401201064933
129.921669968741
-9.28335409970617
45.2926467818523
82.6015437788435
103.841195371870
-151.578732505758
25.5719771178860
34.6850745029892
-91.8791967507014
-1.23972268010130
1.22058532078336
-145.302191535133
65.86651687017
-64.6424788698914
98.324966924482
48.093252083539
-29.9914470333692
-290.913239764183
106.484434106412
5.81645881720397
30.4664103045234
76.0977303107657
-0.806422077529078
-11.0963854909110
63.1524825586134
-37.8881732728905
-236.434864856602
-195.779954049189
-20.7055934552982
-82.0505025180219
-39.9147674998871
147.429710520151
-50.7819168993162
-10.5488194158927
-189.986740396654
-69.008087925761
239.642756971408
51.7203891844531
54.711796621833
-43.0666053918089
78.644333311891
-2.62568676666660
19.3067523055802
28.7374504057566
2.73742371214712
143.750175899493
36.2446170227013
-56.9703238661264
45.6270185436374
-99.3871852279294
74.7959217899402
-34.8920066198034
66.7762056994006
122.947611706087
72.2245568508838
54.4144370778981
20.3339692159707
22.705074144239
66.7723290869499
-13.8490108265250
-2.53129358251499
-79.58116591213
49.5769065741983
50.3414165787713
89.5060923881815
-13.9629929823245
3.08379976413244
46.2414747868097
108.614736641883
133.901733588696
86.5973333460611
43.0069474350621
-80.6236856051278
-111.272532221350
-222.763359638681
201.272703430638
135.244414616117
108.798192589286
111.961767660414
-13.2432257216915
59.1743686034388
97.0458316924487
7.90137932213293
-175.729845956591
248.956191052232
25.9282540199911
-70.6560111465778
-82.7668960241626
-361.933376609321
211.95466589847
112.921252475085
-297.686433206751
84.9949523106898
-308.770832521011
21.6115554208168
-26.0541158560982
247.544323484341
-90.6827385290503
-268.493998797200
-424.769576004259
156.423690374434
-43.6505982826079
-652.37272145297
23.0405172079800
-100.631115228999
229.785338100740
-87.3427506377375
-85.0994036222887
221.621267627064
147.847742293011
-45.3687515699826
11.9646522383946
176.950822190398
94.4267977876734
23.8066950210678
-105.412449507766


Parameters (Session):
par1 = FALSE ; par2 = 1 ; par3 = 1 ; par4 = 0 ; par5 = 12 ; par6 = 3 ; par7 = 1 ; par8 = 2 ; par9 = 1 ;
Parameters (R input):
par1 = FALSE ; par2 = 1.0 ; par3 = 1 ; par4 = 0 ; par5 = 12 ; par6 = 3 ; par7 = 1 ; par8 = 2 ; par9 = 1 ;
R code (references can be found in the software module):
library(lattice)
if (par1 == 'TRUE') par1 <- TRUE
if (par1 == 'FALSE') par1 <- FALSE
par2 <- as.numeric(par2) #Box-Cox lambda transformation parameter
par3 <- as.numeric(par3) #degree of non-seasonal differencing
par4 <- as.numeric(par4) #degree of seasonal differencing
par5 <- as.numeric(par5) #seasonal period
par6 <- as.numeric(par6) #degree (p) of the non-seasonal AR(p) polynomial
par7 <- as.numeric(par7) #degree (q) of the non-seasonal MA(q) polynomial
par8 <- as.numeric(par8) #degree (P) of the seasonal AR(P) polynomial
par9 <- as.numeric(par9) #degree (Q) of the seasonal MA(Q) polynomial
armaGR <- function(arima.out, names, n){
try1 <- arima.out$coef
try2 <- sqrt(diag(arima.out$var.coef))
try.data.frame <- data.frame(matrix(NA,ncol=4,nrow=length(names)))
dimnames(try.data.frame) <- list(names,c('coef','std','tstat','pv'))
try.data.frame[,1] <- try1
for(i in 1:length(try2)) try.data.frame[which(rownames(try.data.frame)==names(try2)[i]),2] <- try2[i]
try.data.frame[,3] <- try.data.frame[,1] / try.data.frame[,2]
try.data.frame[,4] <- round((1-pt(abs(try.data.frame[,3]),df=n-(length(try2)+1)))*2,5)
vector <- rep(NA,length(names))
vector[is.na(try.data.frame[,4])] <- 0
maxi <- which.max(try.data.frame[,4])
continue <- max(try.data.frame[,4],na.rm=TRUE) > .05
vector[maxi] <- 0
list(summary=try.data.frame,next.vector=vector,continue=continue)
}
arimaSelect <- function(series, order=c(13,0,0), seasonal=list(order=c(2,0,0),period=12), include.mean=F){
nrc <- order[1]+order[3]+seasonal$order[1]+seasonal$order[3]
coeff <- matrix(NA, nrow=nrc*2, ncol=nrc)
pval <- matrix(NA, nrow=nrc*2, ncol=nrc)
mylist <- rep(list(NULL), nrc)
names <- NULL
if(order[1] > 0) names <- paste('ar',1:order[1],sep='')
if(order[3] > 0) names <- c( names , paste('ma',1:order[3],sep='') )
if(seasonal$order[1] > 0) names <- c(names, paste('sar',1:seasonal$order[1],sep=''))
if(seasonal$order[3] > 0) names <- c(names, paste('sma',1:seasonal$order[3],sep=''))
arima.out <- arima(series, order=order, seasonal=seasonal, include.mean=include.mean, method='ML')
mylist[[1]] <- arima.out
last.arma <- armaGR(arima.out, names, length(series))
mystop <- FALSE
i <- 1
coeff[i,] <- last.arma[[1]][,1]
pval [i,] <- last.arma[[1]][,4]
i <- 2
aic <- arima.out$aic
while(!mystop){
mylist[[i]] <- arima.out
arima.out <- arima(series, order=order, seasonal=seasonal, include.mean=include.mean, method='ML', fixed=last.arma$next.vector)
aic <- c(aic, arima.out$aic)
last.arma <- armaGR(arima.out, names, length(series))
mystop <- !last.arma$continue
coeff[i,] <- last.arma[[1]][,1]
pval [i,] <- last.arma[[1]][,4]
i <- i+1
}
list(coeff, pval, mylist, aic=aic)
}
arimaSelectplot <- function(arimaSelect.out,noms,choix){
noms <- names(arimaSelect.out[[3]][[1]]$coef)
coeff <- arimaSelect.out[[1]]
k <- min(which(is.na(coeff[,1])))-1
coeff <- coeff[1:k,]
pval <- arimaSelect.out[[2]][1:k,]
aic <- arimaSelect.out$aic[1:k]
coeff[coeff==0] <- NA
n <- ncol(coeff)
if(missing(choix)) choix <- k
layout(matrix(c(1,1,1,2,
3,3,3,2,
3,3,3,4,
5,6,7,7),nr=4),
widths=c(10,35,45,15),
heights=c(30,30,15,15))
couleurs <- rainbow(75)[1:50]#(50)
ticks <- pretty(coeff)
par(mar=c(1,1,3,1))
plot(aic,k:1-.5,type='o',pch=21,bg='blue',cex=2,axes=F,lty=2,xpd=NA)
points(aic[choix],k-choix+.5,pch=21,cex=4,bg=2,xpd=NA)
title('aic',line=2)
par(mar=c(3,0,0,0))
plot(0,axes=F,xlab='',ylab='',xlim=range(ticks),ylim=c(.1,1))
rect(xleft = min(ticks) + (0:49)/50*(max(ticks)-min(ticks)),
xright = min(ticks) + (1:50)/50*(max(ticks)-min(ticks)),
ytop = rep(1,50),
ybottom= rep(0,50),col=couleurs,border=NA)
axis(1,ticks)
rect(xleft=min(ticks),xright=max(ticks),ytop=1,ybottom=0)
text(mean(coeff,na.rm=T),.5,'coefficients',cex=2,font=2)
par(mar=c(1,1,3,1))
image(1:n,1:k,t(coeff[k:1,]),axes=F,col=couleurs,zlim=range(ticks))
for(i in 1:n) for(j in 1:k) if(!is.na(coeff[j,i])) {
if(pval[j,i]<.01) symb = 'green'
else if( (pval[j,i]<.05) & (pval[j,i]>=.01)) symb = 'orange'
else if( (pval[j,i]<.1) & (pval[j,i]>=.05)) symb = 'red'
else symb = 'black'
polygon(c(i+.5 ,i+.2 ,i+.5 ,i+.5),
c(k-j+0.5,k-j+0.5,k-j+0.8,k-j+0.5),
col=symb)
if(j==choix) {
rect(xleft=i-.5,
xright=i+.5,
ybottom=k-j+1.5,
ytop=k-j+.5,
lwd=4)
text(i,
k-j+1,
round(coeff[j,i],2),
cex=1.2,
font=2)
}
else{
rect(xleft=i-.5,xright=i+.5,ybottom=k-j+1.5,ytop=k-j+.5)
text(i,k-j+1,round(coeff[j,i],2),cex=1.2,font=1)
}
}
axis(3,1:n,noms)
par(mar=c(0.5,0,0,0.5))
plot(0,axes=F,xlab='',ylab='',type='n',xlim=c(0,8),ylim=c(-.2,.8))
cols <- c('green','orange','red','black')
niv <- c('0','0.01','0.05','0.1')
for(i in 0:3){
polygon(c(1+2*i ,1+2*i ,1+2*i-.5 ,1+2*i),
c(.4 ,.7 , .4 , .4),
col=cols[i+1])
text(2*i,0.5,niv[i+1],cex=1.5)
}
text(8,.5,1,cex=1.5)
text(4,0,'p-value',cex=2)
box()
residus <- arimaSelect.out[[3]][[choix]]$res
par(mar=c(1,2,4,1))
acf(residus,main='')
title('acf',line=.5)
par(mar=c(1,2,4,1))
pacf(residus,main='')
title('pacf',line=.5)
par(mar=c(2,2,4,1))
qqnorm(residus,main='')
title('qq-norm',line=.5)
qqline(residus)
residus
}
if (par2 == 0) x <- log(x)
if (par2 != 0) x <- x^par2
(selection <- arimaSelect(x, order=c(par6,par3,par7), seasonal=list(order=c(par8,par4,par9), period=par5)))
bitmap(file='test1.png')
resid <- arimaSelectplot(selection)
dev.off()
resid
bitmap(file='test2.png')
acf(resid,length(resid)/2, main='Residual Autocorrelation Function')
dev.off()
bitmap(file='test3.png')
pacf(resid,length(resid)/2, main='Residual Partial Autocorrelation Function')
dev.off()
bitmap(file='test4.png')
cpgram(resid, main='Residual Cumulative Periodogram')
dev.off()
bitmap(file='test5.png')
hist(resid, main='Residual Histogram', xlab='values of Residuals')
dev.off()
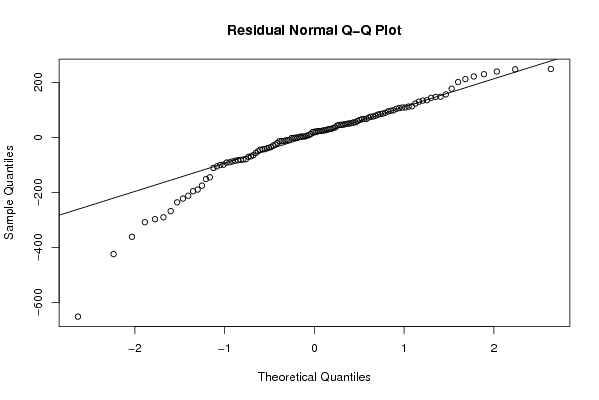
bitmap(file='test6.png')
densityplot(~resid,col='black',main='Residual Density Plot', xlab='values of Residuals')
dev.off()
bitmap(file='test7.png')
qqnorm(resid, main='Residual Normal Q-Q Plot')
qqline(resid)
dev.off()
ncols <- length(selection[[1]][1,])
nrows <- length(selection[[2]][,1])-1
load(file='createtable')
a<-table.start()
a<-table.row.start(a)
a<-table.element(a,'ARIMA Parameter Estimation and Backward Selection', ncols+1,TRUE)
a<-table.row.end(a)
a<-table.row.start(a)
a<-table.element(a,'Iteration', header=TRUE)
for (i in 1:ncols) {
a<-table.element(a,names(selection[[3]][[1]]$coef)[i],header=TRUE)
}
a<-table.row.end(a)
for (j in 1:nrows) {
a<-table.row.start(a)
mydum <- 'Estimates ('
mydum <- paste(mydum,j)
mydum <- paste(mydum,')')
a<-table.element(a,mydum, header=TRUE)
for (i in 1:ncols) {
a<-table.element(a,round(selection[[1]][j,i],4))
}
a<-table.row.end(a)
a<-table.row.start(a)
a<-table.element(a,'(p-val)', header=TRUE)
for (i in 1:ncols) {
mydum <- '('
mydum <- paste(mydum,round(selection[[2]][j,i],4),sep='')
mydum <- paste(mydum,')')
a<-table.element(a,mydum)
}
a<-table.row.end(a)
}
a<-table.end(a)
table.save(a,file='mytable.tab')
a<-table.start()
a<-table.row.start(a)
a<-table.element(a,'Estimated ARIMA Residuals', 1,TRUE)
a<-table.row.end(a)
a<-table.row.start(a)
a<-table.element(a,'Value', 1,TRUE)
a<-table.row.end(a)
for (i in (par4*par5+par3):length(resid)) {
a<-table.row.start(a)
a<-table.element(a,resid[i])
a<-table.row.end(a)
}
a<-table.end(a)
table.save(a,file='mytable1.tab')