Free Statistics

of Irreproducible Research!

Author's title

Author*The author of this computation has been verified*
R Software Modulerwasp_autocorrelation.wasp
Title produced by software(Partial) Autocorrelation Function
Date of computationMon, 21 Dec 2009 08:27:36 -0700
Cite this page as followsStatistical Computations at FreeStatistics.org, Office for Research Development and Education, URL https://freestatistics.org/blog/index.php?v=date/2009/Dec/21/t12614094020i8taeujxgi8v6t.htm/, Retrieved Sun, 05 May 2024 09:15:41 +0000
Statistical Computations at FreeStatistics.org, Office for Research Development and Education, URL https://freestatistics.org/blog/index.php?pk=70272, Retrieved Sun, 05 May 2024 09:15:41 +0000
QR Codes:

Original text written by user:
IsPrivate?No (this computation is public)
User-defined keywords
Estimated Impact139
Family? (F = Feedback message, R = changed R code, M = changed R Module, P = changed Parameters, D = changed Data)
-     [Standard Deviation-Mean Plot] [Standard deviatio...] [2008-12-11 16:40:34] [12d343c4448a5f9e527bb31caeac580b]
-  M D  [Standard Deviation-Mean Plot] [Standard Deviatio...] [2009-12-18 19:32:26] [976efdaed7598845c859b86bc2e467ce]
- RMPD      [(Partial) Autocorrelation Function] [Autocorrelatie fu...] [2009-12-21 15:27:36] [5313d555d4efcc917d0ed22935ab5cb0] [Current]
-   P         [(Partial) Autocorrelation Function] [Autocorrelatie en...] [2009-12-21 16:53:21] [ae69f4b008b5eaa8ebe185637a6eee4e]
-   P           [(Partial) Autocorrelation Function] [Autocorrelatie fu...] [2009-12-21 17:00:29] [ae69f4b008b5eaa8ebe185637a6eee4e]
Feedback Forum

Post a new message
Dataseries X:
467
460
448
443
436
431
484
510
513
503
471
471
476
475
470
461
455
456
517
525
523
519
509
512
519
517
510
509
501
507
569
580
578
565
547
555
562
561
555
544
537
543
594
611
613
611
594
595
591
589
584
573
567
569
621
629
628
612
595
597


Summary of computational transaction
Raw Inputview raw input (R code)
Raw Outputview raw output of R engine
Computing time1 seconds
R Server'Gwilym Jenkins' @ 72.249.127.135

\begin{tabular}{lllllllll}
\hline
Summary of computational transaction \tabularnewline
Raw Input & view raw input (R code)  \tabularnewline
Raw Output & view raw output of R engine  \tabularnewline
Computing time & 1 seconds \tabularnewline
R Server & 'Gwilym Jenkins' @ 72.249.127.135 \tabularnewline
\hline
\end{tabular}
%Source: https://freestatistics.org/blog/index.php?pk=70272&T=0

[TABLE]
[ROW][C]Summary of computational transaction[/C][/ROW]
[ROW][C]Raw Input[/C][C]view raw input (R code) [/C][/ROW]
[ROW][C]Raw Output[/C][C]view raw output of R engine [/C][/ROW]
[ROW][C]Computing time[/C][C]1 seconds[/C][/ROW]
[ROW][C]R Server[/C][C]'Gwilym Jenkins' @ 72.249.127.135[/C][/ROW]
[/TABLE]
Source: https://freestatistics.org/blog/index.php?pk=70272&T=0

Globally Unique Identifier (entire table): ba.freestatistics.org/blog/index.php?pk=70272&T=0

As an alternative you can also use a QR Code:  

The GUIDs for individual cells are displayed in the table below:

Summary of computational transaction
Raw Inputview raw input (R code)
Raw Outputview raw output of R engine
Computing time1 seconds
R Server'Gwilym Jenkins' @ 72.249.127.135


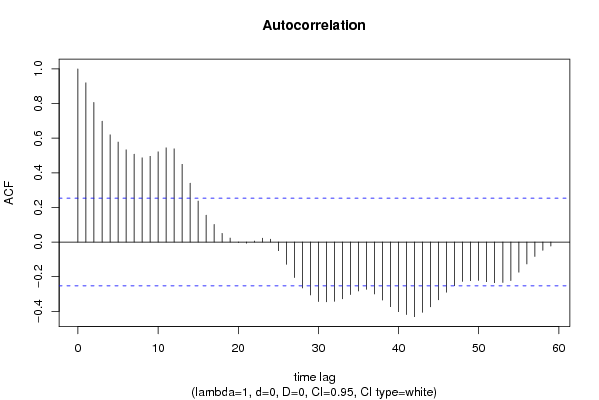
Autocorrelation Function
Time lag kACF(k)T-STATP-value
10.9198297.1250
20.806226.2450
30.6979145.4061e-06
40.6192984.79716e-06
50.5778374.47591.7e-05
60.5328884.12775.7e-05
70.5073493.92990.000111
80.4868633.77120.000187
90.4956143.8390.00015
100.5216324.04057.7e-05
110.5446844.21914.2e-05
120.538744.17314.9e-05
130.4487983.47640.000476
140.3401672.63490.005346
150.2366211.83290.035893
160.1553921.20370.116723
170.1014190.78560.217599
180.0500380.38760.349845
190.0231760.17950.429066
20-0.002345-0.01820.492783
21-0.006909-0.05350.47875
220.0058330.04520.482055
230.0224160.17360.431368
240.0164040.12710.449658
25-0.050333-0.38990.349005
26-0.12868-0.99670.161445
27-0.205115-1.58880.058679
28-0.265381-2.05560.022089
29-0.305776-2.36850.010548
30-0.343799-2.66310.004963
31-0.345714-2.67790.004772
32-0.342766-2.65510.00507
33-0.328327-2.54320.00679
34-0.303503-2.35090.011015
35-0.282205-2.1860.016366
36-0.273006-2.11470.019309
37-0.299954-2.32340.011781
38-0.335586-2.59940.005868
39-0.373257-2.89120.002668
40-0.402425-3.11720.001401
41-0.419245-3.24750.000954
42-0.431099-3.33930.000724
43-0.405891-3.1440.001295
44-0.374574-2.90140.002593
45-0.334008-2.58720.006058
46-0.289497-2.24240.01432
47-0.252432-1.95530.027603
48-0.227414-1.76150.041621
49-0.223178-1.72870.0445
50-0.221765-1.71780.045496
51-0.228779-1.77210.040727
52-0.234641-1.81750.037066
53-0.233784-1.81090.037583
54-0.222418-1.72280.045034
55-0.17437-1.35070.090938
56-0.126558-0.98030.165433
57-0.083204-0.64450.260856
58-0.048017-0.37190.355623
59-0.023177-0.17950.429065
60NANANA

\begin{tabular}{lllllllll}
\hline
Autocorrelation Function \tabularnewline
Time lag k & ACF(k) & T-STAT & P-value \tabularnewline
1 & 0.919829 & 7.125 & 0 \tabularnewline
2 & 0.80622 & 6.245 & 0 \tabularnewline
3 & 0.697914 & 5.406 & 1e-06 \tabularnewline
4 & 0.619298 & 4.7971 & 6e-06 \tabularnewline
5 & 0.577837 & 4.4759 & 1.7e-05 \tabularnewline
6 & 0.532888 & 4.1277 & 5.7e-05 \tabularnewline
7 & 0.507349 & 3.9299 & 0.000111 \tabularnewline
8 & 0.486863 & 3.7712 & 0.000187 \tabularnewline
9 & 0.495614 & 3.839 & 0.00015 \tabularnewline
10 & 0.521632 & 4.0405 & 7.7e-05 \tabularnewline
11 & 0.544684 & 4.2191 & 4.2e-05 \tabularnewline
12 & 0.53874 & 4.1731 & 4.9e-05 \tabularnewline
13 & 0.448798 & 3.4764 & 0.000476 \tabularnewline
14 & 0.340167 & 2.6349 & 0.005346 \tabularnewline
15 & 0.236621 & 1.8329 & 0.035893 \tabularnewline
16 & 0.155392 & 1.2037 & 0.116723 \tabularnewline
17 & 0.101419 & 0.7856 & 0.217599 \tabularnewline
18 & 0.050038 & 0.3876 & 0.349845 \tabularnewline
19 & 0.023176 & 0.1795 & 0.429066 \tabularnewline
20 & -0.002345 & -0.0182 & 0.492783 \tabularnewline
21 & -0.006909 & -0.0535 & 0.47875 \tabularnewline
22 & 0.005833 & 0.0452 & 0.482055 \tabularnewline
23 & 0.022416 & 0.1736 & 0.431368 \tabularnewline
24 & 0.016404 & 0.1271 & 0.449658 \tabularnewline
25 & -0.050333 & -0.3899 & 0.349005 \tabularnewline
26 & -0.12868 & -0.9967 & 0.161445 \tabularnewline
27 & -0.205115 & -1.5888 & 0.058679 \tabularnewline
28 & -0.265381 & -2.0556 & 0.022089 \tabularnewline
29 & -0.305776 & -2.3685 & 0.010548 \tabularnewline
30 & -0.343799 & -2.6631 & 0.004963 \tabularnewline
31 & -0.345714 & -2.6779 & 0.004772 \tabularnewline
32 & -0.342766 & -2.6551 & 0.00507 \tabularnewline
33 & -0.328327 & -2.5432 & 0.00679 \tabularnewline
34 & -0.303503 & -2.3509 & 0.011015 \tabularnewline
35 & -0.282205 & -2.186 & 0.016366 \tabularnewline
36 & -0.273006 & -2.1147 & 0.019309 \tabularnewline
37 & -0.299954 & -2.3234 & 0.011781 \tabularnewline
38 & -0.335586 & -2.5994 & 0.005868 \tabularnewline
39 & -0.373257 & -2.8912 & 0.002668 \tabularnewline
40 & -0.402425 & -3.1172 & 0.001401 \tabularnewline
41 & -0.419245 & -3.2475 & 0.000954 \tabularnewline
42 & -0.431099 & -3.3393 & 0.000724 \tabularnewline
43 & -0.405891 & -3.144 & 0.001295 \tabularnewline
44 & -0.374574 & -2.9014 & 0.002593 \tabularnewline
45 & -0.334008 & -2.5872 & 0.006058 \tabularnewline
46 & -0.289497 & -2.2424 & 0.01432 \tabularnewline
47 & -0.252432 & -1.9553 & 0.027603 \tabularnewline
48 & -0.227414 & -1.7615 & 0.041621 \tabularnewline
49 & -0.223178 & -1.7287 & 0.0445 \tabularnewline
50 & -0.221765 & -1.7178 & 0.045496 \tabularnewline
51 & -0.228779 & -1.7721 & 0.040727 \tabularnewline
52 & -0.234641 & -1.8175 & 0.037066 \tabularnewline
53 & -0.233784 & -1.8109 & 0.037583 \tabularnewline
54 & -0.222418 & -1.7228 & 0.045034 \tabularnewline
55 & -0.17437 & -1.3507 & 0.090938 \tabularnewline
56 & -0.126558 & -0.9803 & 0.165433 \tabularnewline
57 & -0.083204 & -0.6445 & 0.260856 \tabularnewline
58 & -0.048017 & -0.3719 & 0.355623 \tabularnewline
59 & -0.023177 & -0.1795 & 0.429065 \tabularnewline
60 & NA & NA & NA \tabularnewline
\hline
\end{tabular}
%Source: https://freestatistics.org/blog/index.php?pk=70272&T=1

[TABLE]
[ROW][C]Autocorrelation Function[/C][/ROW]
[ROW][C]Time lag k[/C][C]ACF(k)[/C][C]T-STAT[/C][C]P-value[/C][/ROW]
[ROW][C]1[/C][C]0.919829[/C][C]7.125[/C][C]0[/C][/ROW]
[ROW][C]2[/C][C]0.80622[/C][C]6.245[/C][C]0[/C][/ROW]
[ROW][C]3[/C][C]0.697914[/C][C]5.406[/C][C]1e-06[/C][/ROW]
[ROW][C]4[/C][C]0.619298[/C][C]4.7971[/C][C]6e-06[/C][/ROW]
[ROW][C]5[/C][C]0.577837[/C][C]4.4759[/C][C]1.7e-05[/C][/ROW]
[ROW][C]6[/C][C]0.532888[/C][C]4.1277[/C][C]5.7e-05[/C][/ROW]
[ROW][C]7[/C][C]0.507349[/C][C]3.9299[/C][C]0.000111[/C][/ROW]
[ROW][C]8[/C][C]0.486863[/C][C]3.7712[/C][C]0.000187[/C][/ROW]
[ROW][C]9[/C][C]0.495614[/C][C]3.839[/C][C]0.00015[/C][/ROW]
[ROW][C]10[/C][C]0.521632[/C][C]4.0405[/C][C]7.7e-05[/C][/ROW]
[ROW][C]11[/C][C]0.544684[/C][C]4.2191[/C][C]4.2e-05[/C][/ROW]
[ROW][C]12[/C][C]0.53874[/C][C]4.1731[/C][C]4.9e-05[/C][/ROW]
[ROW][C]13[/C][C]0.448798[/C][C]3.4764[/C][C]0.000476[/C][/ROW]
[ROW][C]14[/C][C]0.340167[/C][C]2.6349[/C][C]0.005346[/C][/ROW]
[ROW][C]15[/C][C]0.236621[/C][C]1.8329[/C][C]0.035893[/C][/ROW]
[ROW][C]16[/C][C]0.155392[/C][C]1.2037[/C][C]0.116723[/C][/ROW]
[ROW][C]17[/C][C]0.101419[/C][C]0.7856[/C][C]0.217599[/C][/ROW]
[ROW][C]18[/C][C]0.050038[/C][C]0.3876[/C][C]0.349845[/C][/ROW]
[ROW][C]19[/C][C]0.023176[/C][C]0.1795[/C][C]0.429066[/C][/ROW]
[ROW][C]20[/C][C]-0.002345[/C][C]-0.0182[/C][C]0.492783[/C][/ROW]
[ROW][C]21[/C][C]-0.006909[/C][C]-0.0535[/C][C]0.47875[/C][/ROW]
[ROW][C]22[/C][C]0.005833[/C][C]0.0452[/C][C]0.482055[/C][/ROW]
[ROW][C]23[/C][C]0.022416[/C][C]0.1736[/C][C]0.431368[/C][/ROW]
[ROW][C]24[/C][C]0.016404[/C][C]0.1271[/C][C]0.449658[/C][/ROW]
[ROW][C]25[/C][C]-0.050333[/C][C]-0.3899[/C][C]0.349005[/C][/ROW]
[ROW][C]26[/C][C]-0.12868[/C][C]-0.9967[/C][C]0.161445[/C][/ROW]
[ROW][C]27[/C][C]-0.205115[/C][C]-1.5888[/C][C]0.058679[/C][/ROW]
[ROW][C]28[/C][C]-0.265381[/C][C]-2.0556[/C][C]0.022089[/C][/ROW]
[ROW][C]29[/C][C]-0.305776[/C][C]-2.3685[/C][C]0.010548[/C][/ROW]
[ROW][C]30[/C][C]-0.343799[/C][C]-2.6631[/C][C]0.004963[/C][/ROW]
[ROW][C]31[/C][C]-0.345714[/C][C]-2.6779[/C][C]0.004772[/C][/ROW]
[ROW][C]32[/C][C]-0.342766[/C][C]-2.6551[/C][C]0.00507[/C][/ROW]
[ROW][C]33[/C][C]-0.328327[/C][C]-2.5432[/C][C]0.00679[/C][/ROW]
[ROW][C]34[/C][C]-0.303503[/C][C]-2.3509[/C][C]0.011015[/C][/ROW]
[ROW][C]35[/C][C]-0.282205[/C][C]-2.186[/C][C]0.016366[/C][/ROW]
[ROW][C]36[/C][C]-0.273006[/C][C]-2.1147[/C][C]0.019309[/C][/ROW]
[ROW][C]37[/C][C]-0.299954[/C][C]-2.3234[/C][C]0.011781[/C][/ROW]
[ROW][C]38[/C][C]-0.335586[/C][C]-2.5994[/C][C]0.005868[/C][/ROW]
[ROW][C]39[/C][C]-0.373257[/C][C]-2.8912[/C][C]0.002668[/C][/ROW]
[ROW][C]40[/C][C]-0.402425[/C][C]-3.1172[/C][C]0.001401[/C][/ROW]
[ROW][C]41[/C][C]-0.419245[/C][C]-3.2475[/C][C]0.000954[/C][/ROW]
[ROW][C]42[/C][C]-0.431099[/C][C]-3.3393[/C][C]0.000724[/C][/ROW]
[ROW][C]43[/C][C]-0.405891[/C][C]-3.144[/C][C]0.001295[/C][/ROW]
[ROW][C]44[/C][C]-0.374574[/C][C]-2.9014[/C][C]0.002593[/C][/ROW]
[ROW][C]45[/C][C]-0.334008[/C][C]-2.5872[/C][C]0.006058[/C][/ROW]
[ROW][C]46[/C][C]-0.289497[/C][C]-2.2424[/C][C]0.01432[/C][/ROW]
[ROW][C]47[/C][C]-0.252432[/C][C]-1.9553[/C][C]0.027603[/C][/ROW]
[ROW][C]48[/C][C]-0.227414[/C][C]-1.7615[/C][C]0.041621[/C][/ROW]
[ROW][C]49[/C][C]-0.223178[/C][C]-1.7287[/C][C]0.0445[/C][/ROW]
[ROW][C]50[/C][C]-0.221765[/C][C]-1.7178[/C][C]0.045496[/C][/ROW]
[ROW][C]51[/C][C]-0.228779[/C][C]-1.7721[/C][C]0.040727[/C][/ROW]
[ROW][C]52[/C][C]-0.234641[/C][C]-1.8175[/C][C]0.037066[/C][/ROW]
[ROW][C]53[/C][C]-0.233784[/C][C]-1.8109[/C][C]0.037583[/C][/ROW]
[ROW][C]54[/C][C]-0.222418[/C][C]-1.7228[/C][C]0.045034[/C][/ROW]
[ROW][C]55[/C][C]-0.17437[/C][C]-1.3507[/C][C]0.090938[/C][/ROW]
[ROW][C]56[/C][C]-0.126558[/C][C]-0.9803[/C][C]0.165433[/C][/ROW]
[ROW][C]57[/C][C]-0.083204[/C][C]-0.6445[/C][C]0.260856[/C][/ROW]
[ROW][C]58[/C][C]-0.048017[/C][C]-0.3719[/C][C]0.355623[/C][/ROW]
[ROW][C]59[/C][C]-0.023177[/C][C]-0.1795[/C][C]0.429065[/C][/ROW]
[ROW][C]60[/C][C]NA[/C][C]NA[/C][C]NA[/C][/ROW]
[/TABLE]
Source: https://freestatistics.org/blog/index.php?pk=70272&T=1

Globally Unique Identifier (entire table): ba.freestatistics.org/blog/index.php?pk=70272&T=1

As an alternative you can also use a QR Code:  

The GUIDs for individual cells are displayed in the table below:

Autocorrelation Function
Time lag kACF(k)T-STATP-value
10.9198297.1250
20.806226.2450
30.6979145.4061e-06
40.6192984.79716e-06
50.5778374.47591.7e-05
60.5328884.12775.7e-05
70.5073493.92990.000111
80.4868633.77120.000187
90.4956143.8390.00015
100.5216324.04057.7e-05
110.5446844.21914.2e-05
120.538744.17314.9e-05
130.4487983.47640.000476
140.3401672.63490.005346
150.2366211.83290.035893
160.1553921.20370.116723
170.1014190.78560.217599
180.0500380.38760.349845
190.0231760.17950.429066
20-0.002345-0.01820.492783
21-0.006909-0.05350.47875
220.0058330.04520.482055
230.0224160.17360.431368
240.0164040.12710.449658
25-0.050333-0.38990.349005
26-0.12868-0.99670.161445
27-0.205115-1.58880.058679
28-0.265381-2.05560.022089
29-0.305776-2.36850.010548
30-0.343799-2.66310.004963
31-0.345714-2.67790.004772
32-0.342766-2.65510.00507
33-0.328327-2.54320.00679
34-0.303503-2.35090.011015
35-0.282205-2.1860.016366
36-0.273006-2.11470.019309
37-0.299954-2.32340.011781
38-0.335586-2.59940.005868
39-0.373257-2.89120.002668
40-0.402425-3.11720.001401
41-0.419245-3.24750.000954
42-0.431099-3.33930.000724
43-0.405891-3.1440.001295
44-0.374574-2.90140.002593
45-0.334008-2.58720.006058
46-0.289497-2.24240.01432
47-0.252432-1.95530.027603
48-0.227414-1.76150.041621
49-0.223178-1.72870.0445
50-0.221765-1.71780.045496
51-0.228779-1.77210.040727
52-0.234641-1.81750.037066
53-0.233784-1.81090.037583
54-0.222418-1.72280.045034
55-0.17437-1.35070.090938
56-0.126558-0.98030.165433
57-0.083204-0.64450.260856
58-0.048017-0.37190.355623
59-0.023177-0.17950.429065
60NANANA


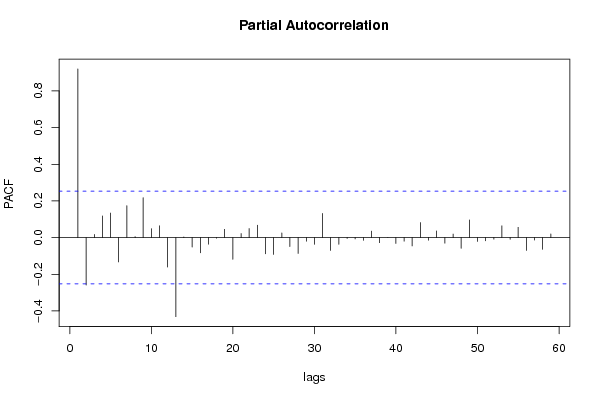
Partial Autocorrelation Function
Time lag kPACF(k)T-STATP-value
10.9198297.1250
2-0.259014-2.00630.024668
30.0173850.13470.446663
40.1182920.91630.181592
50.1338931.03710.151919
6-0.133065-1.03070.153406
70.1737391.34580.09172
80.0052890.0410.483729
90.2174481.68430.048655
100.0486820.37710.353719
110.0644850.49950.309627
12-0.161085-1.24780.108484
13-0.431227-3.34030.000722
140.0036620.02840.488733
15-0.051591-0.39960.345428
16-0.083192-0.64440.260885
17-0.035716-0.27670.391497
18-0.003308-0.02560.489821
190.0451570.34980.363863
20-0.118174-0.91540.181831
210.0222840.17260.43177
220.0492630.38160.352058
230.0679790.52660.300218
24-0.088746-0.68740.247233
25-0.092049-0.7130.239303
260.0256130.19840.421701
27-0.04875-0.37760.353525
28-0.086355-0.66890.253062
29-0.019816-0.15350.439262
30-0.036795-0.2850.388307
310.1318581.02140.155591
32-0.070399-0.54530.293782
33-0.036982-0.28650.387757
34-0.004422-0.03430.486393
35-0.007602-0.05890.47662
36-0.014653-0.11350.455005
370.0352920.27340.392755
38-0.027572-0.21360.415803
390.0003560.00280.498905
40-0.031673-0.24530.403517
41-0.019355-0.14990.440665
42-0.045295-0.35090.363463
430.0822380.6370.263271
44-0.013932-0.10790.45721
450.0359920.27880.390681
46-0.030658-0.23750.40655
470.019290.14940.440862
48-0.058773-0.45530.325284
490.0962370.74540.229456
50-0.021062-0.16310.435475
51-0.017465-0.13530.44642
52-0.008782-0.0680.472995
530.0641040.49660.31066
54-0.009235-0.07150.471606
550.0561950.43530.332459
56-0.070351-0.54490.293909
57-0.01342-0.10390.458778
58-0.064239-0.49760.310296
590.0197280.15280.43953
60NANANA

\begin{tabular}{lllllllll}
\hline
Partial Autocorrelation Function \tabularnewline
Time lag k & PACF(k) & T-STAT & P-value \tabularnewline
1 & 0.919829 & 7.125 & 0 \tabularnewline
2 & -0.259014 & -2.0063 & 0.024668 \tabularnewline
3 & 0.017385 & 0.1347 & 0.446663 \tabularnewline
4 & 0.118292 & 0.9163 & 0.181592 \tabularnewline
5 & 0.133893 & 1.0371 & 0.151919 \tabularnewline
6 & -0.133065 & -1.0307 & 0.153406 \tabularnewline
7 & 0.173739 & 1.3458 & 0.09172 \tabularnewline
8 & 0.005289 & 0.041 & 0.483729 \tabularnewline
9 & 0.217448 & 1.6843 & 0.048655 \tabularnewline
10 & 0.048682 & 0.3771 & 0.353719 \tabularnewline
11 & 0.064485 & 0.4995 & 0.309627 \tabularnewline
12 & -0.161085 & -1.2478 & 0.108484 \tabularnewline
13 & -0.431227 & -3.3403 & 0.000722 \tabularnewline
14 & 0.003662 & 0.0284 & 0.488733 \tabularnewline
15 & -0.051591 & -0.3996 & 0.345428 \tabularnewline
16 & -0.083192 & -0.6444 & 0.260885 \tabularnewline
17 & -0.035716 & -0.2767 & 0.391497 \tabularnewline
18 & -0.003308 & -0.0256 & 0.489821 \tabularnewline
19 & 0.045157 & 0.3498 & 0.363863 \tabularnewline
20 & -0.118174 & -0.9154 & 0.181831 \tabularnewline
21 & 0.022284 & 0.1726 & 0.43177 \tabularnewline
22 & 0.049263 & 0.3816 & 0.352058 \tabularnewline
23 & 0.067979 & 0.5266 & 0.300218 \tabularnewline
24 & -0.088746 & -0.6874 & 0.247233 \tabularnewline
25 & -0.092049 & -0.713 & 0.239303 \tabularnewline
26 & 0.025613 & 0.1984 & 0.421701 \tabularnewline
27 & -0.04875 & -0.3776 & 0.353525 \tabularnewline
28 & -0.086355 & -0.6689 & 0.253062 \tabularnewline
29 & -0.019816 & -0.1535 & 0.439262 \tabularnewline
30 & -0.036795 & -0.285 & 0.388307 \tabularnewline
31 & 0.131858 & 1.0214 & 0.155591 \tabularnewline
32 & -0.070399 & -0.5453 & 0.293782 \tabularnewline
33 & -0.036982 & -0.2865 & 0.387757 \tabularnewline
34 & -0.004422 & -0.0343 & 0.486393 \tabularnewline
35 & -0.007602 & -0.0589 & 0.47662 \tabularnewline
36 & -0.014653 & -0.1135 & 0.455005 \tabularnewline
37 & 0.035292 & 0.2734 & 0.392755 \tabularnewline
38 & -0.027572 & -0.2136 & 0.415803 \tabularnewline
39 & 0.000356 & 0.0028 & 0.498905 \tabularnewline
40 & -0.031673 & -0.2453 & 0.403517 \tabularnewline
41 & -0.019355 & -0.1499 & 0.440665 \tabularnewline
42 & -0.045295 & -0.3509 & 0.363463 \tabularnewline
43 & 0.082238 & 0.637 & 0.263271 \tabularnewline
44 & -0.013932 & -0.1079 & 0.45721 \tabularnewline
45 & 0.035992 & 0.2788 & 0.390681 \tabularnewline
46 & -0.030658 & -0.2375 & 0.40655 \tabularnewline
47 & 0.01929 & 0.1494 & 0.440862 \tabularnewline
48 & -0.058773 & -0.4553 & 0.325284 \tabularnewline
49 & 0.096237 & 0.7454 & 0.229456 \tabularnewline
50 & -0.021062 & -0.1631 & 0.435475 \tabularnewline
51 & -0.017465 & -0.1353 & 0.44642 \tabularnewline
52 & -0.008782 & -0.068 & 0.472995 \tabularnewline
53 & 0.064104 & 0.4966 & 0.31066 \tabularnewline
54 & -0.009235 & -0.0715 & 0.471606 \tabularnewline
55 & 0.056195 & 0.4353 & 0.332459 \tabularnewline
56 & -0.070351 & -0.5449 & 0.293909 \tabularnewline
57 & -0.01342 & -0.1039 & 0.458778 \tabularnewline
58 & -0.064239 & -0.4976 & 0.310296 \tabularnewline
59 & 0.019728 & 0.1528 & 0.43953 \tabularnewline
60 & NA & NA & NA \tabularnewline
\hline
\end{tabular}
%Source: https://freestatistics.org/blog/index.php?pk=70272&T=2

[TABLE]
[ROW][C]Partial Autocorrelation Function[/C][/ROW]
[ROW][C]Time lag k[/C][C]PACF(k)[/C][C]T-STAT[/C][C]P-value[/C][/ROW]
[ROW][C]1[/C][C]0.919829[/C][C]7.125[/C][C]0[/C][/ROW]
[ROW][C]2[/C][C]-0.259014[/C][C]-2.0063[/C][C]0.024668[/C][/ROW]
[ROW][C]3[/C][C]0.017385[/C][C]0.1347[/C][C]0.446663[/C][/ROW]
[ROW][C]4[/C][C]0.118292[/C][C]0.9163[/C][C]0.181592[/C][/ROW]
[ROW][C]5[/C][C]0.133893[/C][C]1.0371[/C][C]0.151919[/C][/ROW]
[ROW][C]6[/C][C]-0.133065[/C][C]-1.0307[/C][C]0.153406[/C][/ROW]
[ROW][C]7[/C][C]0.173739[/C][C]1.3458[/C][C]0.09172[/C][/ROW]
[ROW][C]8[/C][C]0.005289[/C][C]0.041[/C][C]0.483729[/C][/ROW]
[ROW][C]9[/C][C]0.217448[/C][C]1.6843[/C][C]0.048655[/C][/ROW]
[ROW][C]10[/C][C]0.048682[/C][C]0.3771[/C][C]0.353719[/C][/ROW]
[ROW][C]11[/C][C]0.064485[/C][C]0.4995[/C][C]0.309627[/C][/ROW]
[ROW][C]12[/C][C]-0.161085[/C][C]-1.2478[/C][C]0.108484[/C][/ROW]
[ROW][C]13[/C][C]-0.431227[/C][C]-3.3403[/C][C]0.000722[/C][/ROW]
[ROW][C]14[/C][C]0.003662[/C][C]0.0284[/C][C]0.488733[/C][/ROW]
[ROW][C]15[/C][C]-0.051591[/C][C]-0.3996[/C][C]0.345428[/C][/ROW]
[ROW][C]16[/C][C]-0.083192[/C][C]-0.6444[/C][C]0.260885[/C][/ROW]
[ROW][C]17[/C][C]-0.035716[/C][C]-0.2767[/C][C]0.391497[/C][/ROW]
[ROW][C]18[/C][C]-0.003308[/C][C]-0.0256[/C][C]0.489821[/C][/ROW]
[ROW][C]19[/C][C]0.045157[/C][C]0.3498[/C][C]0.363863[/C][/ROW]
[ROW][C]20[/C][C]-0.118174[/C][C]-0.9154[/C][C]0.181831[/C][/ROW]
[ROW][C]21[/C][C]0.022284[/C][C]0.1726[/C][C]0.43177[/C][/ROW]
[ROW][C]22[/C][C]0.049263[/C][C]0.3816[/C][C]0.352058[/C][/ROW]
[ROW][C]23[/C][C]0.067979[/C][C]0.5266[/C][C]0.300218[/C][/ROW]
[ROW][C]24[/C][C]-0.088746[/C][C]-0.6874[/C][C]0.247233[/C][/ROW]
[ROW][C]25[/C][C]-0.092049[/C][C]-0.713[/C][C]0.239303[/C][/ROW]
[ROW][C]26[/C][C]0.025613[/C][C]0.1984[/C][C]0.421701[/C][/ROW]
[ROW][C]27[/C][C]-0.04875[/C][C]-0.3776[/C][C]0.353525[/C][/ROW]
[ROW][C]28[/C][C]-0.086355[/C][C]-0.6689[/C][C]0.253062[/C][/ROW]
[ROW][C]29[/C][C]-0.019816[/C][C]-0.1535[/C][C]0.439262[/C][/ROW]
[ROW][C]30[/C][C]-0.036795[/C][C]-0.285[/C][C]0.388307[/C][/ROW]
[ROW][C]31[/C][C]0.131858[/C][C]1.0214[/C][C]0.155591[/C][/ROW]
[ROW][C]32[/C][C]-0.070399[/C][C]-0.5453[/C][C]0.293782[/C][/ROW]
[ROW][C]33[/C][C]-0.036982[/C][C]-0.2865[/C][C]0.387757[/C][/ROW]
[ROW][C]34[/C][C]-0.004422[/C][C]-0.0343[/C][C]0.486393[/C][/ROW]
[ROW][C]35[/C][C]-0.007602[/C][C]-0.0589[/C][C]0.47662[/C][/ROW]
[ROW][C]36[/C][C]-0.014653[/C][C]-0.1135[/C][C]0.455005[/C][/ROW]
[ROW][C]37[/C][C]0.035292[/C][C]0.2734[/C][C]0.392755[/C][/ROW]
[ROW][C]38[/C][C]-0.027572[/C][C]-0.2136[/C][C]0.415803[/C][/ROW]
[ROW][C]39[/C][C]0.000356[/C][C]0.0028[/C][C]0.498905[/C][/ROW]
[ROW][C]40[/C][C]-0.031673[/C][C]-0.2453[/C][C]0.403517[/C][/ROW]
[ROW][C]41[/C][C]-0.019355[/C][C]-0.1499[/C][C]0.440665[/C][/ROW]
[ROW][C]42[/C][C]-0.045295[/C][C]-0.3509[/C][C]0.363463[/C][/ROW]
[ROW][C]43[/C][C]0.082238[/C][C]0.637[/C][C]0.263271[/C][/ROW]
[ROW][C]44[/C][C]-0.013932[/C][C]-0.1079[/C][C]0.45721[/C][/ROW]
[ROW][C]45[/C][C]0.035992[/C][C]0.2788[/C][C]0.390681[/C][/ROW]
[ROW][C]46[/C][C]-0.030658[/C][C]-0.2375[/C][C]0.40655[/C][/ROW]
[ROW][C]47[/C][C]0.01929[/C][C]0.1494[/C][C]0.440862[/C][/ROW]
[ROW][C]48[/C][C]-0.058773[/C][C]-0.4553[/C][C]0.325284[/C][/ROW]
[ROW][C]49[/C][C]0.096237[/C][C]0.7454[/C][C]0.229456[/C][/ROW]
[ROW][C]50[/C][C]-0.021062[/C][C]-0.1631[/C][C]0.435475[/C][/ROW]
[ROW][C]51[/C][C]-0.017465[/C][C]-0.1353[/C][C]0.44642[/C][/ROW]
[ROW][C]52[/C][C]-0.008782[/C][C]-0.068[/C][C]0.472995[/C][/ROW]
[ROW][C]53[/C][C]0.064104[/C][C]0.4966[/C][C]0.31066[/C][/ROW]
[ROW][C]54[/C][C]-0.009235[/C][C]-0.0715[/C][C]0.471606[/C][/ROW]
[ROW][C]55[/C][C]0.056195[/C][C]0.4353[/C][C]0.332459[/C][/ROW]
[ROW][C]56[/C][C]-0.070351[/C][C]-0.5449[/C][C]0.293909[/C][/ROW]
[ROW][C]57[/C][C]-0.01342[/C][C]-0.1039[/C][C]0.458778[/C][/ROW]
[ROW][C]58[/C][C]-0.064239[/C][C]-0.4976[/C][C]0.310296[/C][/ROW]
[ROW][C]59[/C][C]0.019728[/C][C]0.1528[/C][C]0.43953[/C][/ROW]
[ROW][C]60[/C][C]NA[/C][C]NA[/C][C]NA[/C][/ROW]
[/TABLE]
Source: https://freestatistics.org/blog/index.php?pk=70272&T=2

Globally Unique Identifier (entire table): ba.freestatistics.org/blog/index.php?pk=70272&T=2

As an alternative you can also use a QR Code:  

The GUIDs for individual cells are displayed in the table below:

Partial Autocorrelation Function
Time lag kPACF(k)T-STATP-value
10.9198297.1250
2-0.259014-2.00630.024668
30.0173850.13470.446663
40.1182920.91630.181592
50.1338931.03710.151919
6-0.133065-1.03070.153406
70.1737391.34580.09172
80.0052890.0410.483729
90.2174481.68430.048655
100.0486820.37710.353719
110.0644850.49950.309627
12-0.161085-1.24780.108484
13-0.431227-3.34030.000722
140.0036620.02840.488733
15-0.051591-0.39960.345428
16-0.083192-0.64440.260885
17-0.035716-0.27670.391497
18-0.003308-0.02560.489821
190.0451570.34980.363863
20-0.118174-0.91540.181831
210.0222840.17260.43177
220.0492630.38160.352058
230.0679790.52660.300218
24-0.088746-0.68740.247233
25-0.092049-0.7130.239303
260.0256130.19840.421701
27-0.04875-0.37760.353525
28-0.086355-0.66890.253062
29-0.019816-0.15350.439262
30-0.036795-0.2850.388307
310.1318581.02140.155591
32-0.070399-0.54530.293782
33-0.036982-0.28650.387757
34-0.004422-0.03430.486393
35-0.007602-0.05890.47662
36-0.014653-0.11350.455005
370.0352920.27340.392755
38-0.027572-0.21360.415803
390.0003560.00280.498905
40-0.031673-0.24530.403517
41-0.019355-0.14990.440665
42-0.045295-0.35090.363463
430.0822380.6370.263271
44-0.013932-0.10790.45721
450.0359920.27880.390681
46-0.030658-0.23750.40655
470.019290.14940.440862
48-0.058773-0.45530.325284
490.0962370.74540.229456
50-0.021062-0.16310.435475
51-0.017465-0.13530.44642
52-0.008782-0.0680.472995
530.0641040.49660.31066
54-0.009235-0.07150.471606
550.0561950.43530.332459
56-0.070351-0.54490.293909
57-0.01342-0.10390.458778
58-0.064239-0.49760.310296
590.0197280.15280.43953
60NANANA


Parameters (Session):
par1 = 60 ; par2 = 1 ; par3 = 0 ; par4 = 0 ; par5 = 12 ; par6 = White Noise ; par7 = 0.95 ;
Parameters (R input):
par1 = 60 ; par2 = 1 ; par3 = 0 ; par4 = 0 ; par5 = 12 ; par6 = White Noise ; par7 = 0.95 ;
R code (references can be found in the software module):
if (par1 == 'Default') {
par1 = 10*log10(length(x))
} else {
par1 <- as.numeric(par1)
}
par2 <- as.numeric(par2)
par3 <- as.numeric(par3)
par4 <- as.numeric(par4)
par5 <- as.numeric(par5)
if (par6 == 'White Noise') par6 <- 'white' else par6 <- 'ma'
par7 <- as.numeric(par7)
if (par2 == 0) {
x <- log(x)
} else {
x <- (x ^ par2 - 1) / par2
}
if (par3 > 0) x <- diff(x,lag=1,difference=par3)
if (par4 > 0) x <- diff(x,lag=par5,difference=par4)
bitmap(file='pic1.png')
racf <- acf(x, par1, main='Autocorrelation', xlab='time lag', ylab='ACF', ci.type=par6, ci=par7, sub=paste('(lambda=',par2,', d=',par3,', D=',par4,', CI=', par7, ', CI type=',par6,')',sep=''))
dev.off()
bitmap(file='pic2.png')
rpacf <- pacf(x,par1,main='Partial Autocorrelation',xlab='lags',ylab='PACF')
dev.off()
(myacf <- c(racf$acf))
(mypacf <- c(rpacf$acf))
lengthx <- length(x)
sqrtn <- sqrt(lengthx)
load(file='createtable')
a<-table.start()
a<-table.row.start(a)
a<-table.element(a,'Autocorrelation Function',4,TRUE)
a<-table.row.end(a)
a<-table.row.start(a)
a<-table.element(a,'Time lag k',header=TRUE)
a<-table.element(a,hyperlink('basics.htm','ACF(k)','click here for more information about the Autocorrelation Function'),header=TRUE)
a<-table.element(a,'T-STAT',header=TRUE)
a<-table.element(a,'P-value',header=TRUE)
a<-table.row.end(a)
for (i in 2:(par1+1)) {
a<-table.row.start(a)
a<-table.element(a,i-1,header=TRUE)
a<-table.element(a,round(myacf[i],6))
mytstat <- myacf[i]*sqrtn
a<-table.element(a,round(mytstat,4))
a<-table.element(a,round(1-pt(abs(mytstat),lengthx),6))
a<-table.row.end(a)
}
a<-table.end(a)
table.save(a,file='mytable.tab')
a<-table.start()
a<-table.row.start(a)
a<-table.element(a,'Partial Autocorrelation Function',4,TRUE)
a<-table.row.end(a)
a<-table.row.start(a)
a<-table.element(a,'Time lag k',header=TRUE)
a<-table.element(a,hyperlink('basics.htm','PACF(k)','click here for more information about the Partial Autocorrelation Function'),header=TRUE)
a<-table.element(a,'T-STAT',header=TRUE)
a<-table.element(a,'P-value',header=TRUE)
a<-table.row.end(a)
for (i in 1:par1) {
a<-table.row.start(a)
a<-table.element(a,i,header=TRUE)
a<-table.element(a,round(mypacf[i],6))
mytstat <- mypacf[i]*sqrtn
a<-table.element(a,round(mytstat,4))
a<-table.element(a,round(1-pt(abs(mytstat),lengthx),6))
a<-table.row.end(a)
}
a<-table.end(a)
table.save(a,file='mytable1.tab')