Free Statistics

of Irreproducible Research!

Author's title

Author*The author of this computation has been verified*
R Software Modulerwasp_autocorrelation.wasp
Title produced by software(Partial) Autocorrelation Function
Date of computationMon, 21 Dec 2009 08:07:00 -0700
Cite this page as followsStatistical Computations at FreeStatistics.org, Office for Research Development and Education, URL https://freestatistics.org/blog/index.php?v=date/2009/Dec/21/t1261408067oo9gs0klu04f9w2.htm/, Retrieved Sun, 05 May 2024 17:10:16 +0000
Statistical Computations at FreeStatistics.org, Office for Research Development and Education, URL https://freestatistics.org/blog/index.php?pk=70238, Retrieved Sun, 05 May 2024 17:10:16 +0000
QR Codes:

Original text written by user:
IsPrivate?No (this computation is public)
User-defined keywords
Estimated Impact146
Family? (F = Feedback message, R = changed R code, M = changed R Module, P = changed Parameters, D = changed Data)
-     [(Partial) Autocorrelation Function] [Partial autocorre...] [2008-12-09 20:18:51] [12d343c4448a5f9e527bb31caeac580b]
-   P   [(Partial) Autocorrelation Function] [Partial autocorre...] [2008-12-09 20:27:26] [12d343c4448a5f9e527bb31caeac580b]
- RMPD    [(Partial) Autocorrelation Function] [Autocorrelatie bi...] [2009-12-21 14:51:48] [9dbb467a28ad600d808a4e47d5e0774e]
-   P         [(Partial) Autocorrelation Function] [Autocorrelatie bi...] [2009-12-21 15:07:00] [4c76f32a7a0cc9034048c3cdcdaf547e] [Current]
-               [(Partial) Autocorrelation Function] [paper] [2010-12-28 16:30:36] [654616a560d52fe6eb611aa3bbf6b3c7]
Feedback Forum

Post a new message
Dataseries X:
36845
35338
35022
34777
26887
23970
22780
17351
21382
24561
17409
11514
31514
27071
29462
26105
22397
23843
21705
18089
20764
25316
17704
15548
28029
29383
36438
32034
22679
24319
18004
17537
20366
22782
19169
13807
29743
25591
29096
26482
22405
27044
17970
18730
19684
19785
18479
10698
31956
29506
34506
27165
26736
23691
18157
17328
18205
20995
17382
9367
31124
26551
30651
25859
25100
25778
20418
18688
20424
24776
19814
12738
31566
30111
30019
31934
25826
26835
20205
17789
20520
22518
15572
11509


Summary of computational transaction
Raw Inputview raw input (R code)
Raw Outputview raw output of R engine
Computing time1 seconds
R Server'Gwilym Jenkins' @ 72.249.127.135

\begin{tabular}{lllllllll}
\hline
Summary of computational transaction \tabularnewline
Raw Input & view raw input (R code)  \tabularnewline
Raw Output & view raw output of R engine  \tabularnewline
Computing time & 1 seconds \tabularnewline
R Server & 'Gwilym Jenkins' @ 72.249.127.135 \tabularnewline
\hline
\end{tabular}
%Source: https://freestatistics.org/blog/index.php?pk=70238&T=0

[TABLE]
[ROW][C]Summary of computational transaction[/C][/ROW]
[ROW][C]Raw Input[/C][C]view raw input (R code) [/C][/ROW]
[ROW][C]Raw Output[/C][C]view raw output of R engine [/C][/ROW]
[ROW][C]Computing time[/C][C]1 seconds[/C][/ROW]
[ROW][C]R Server[/C][C]'Gwilym Jenkins' @ 72.249.127.135[/C][/ROW]
[/TABLE]
Source: https://freestatistics.org/blog/index.php?pk=70238&T=0

Globally Unique Identifier (entire table): ba.freestatistics.org/blog/index.php?pk=70238&T=0

As an alternative you can also use a QR Code:  

The GUIDs for individual cells are displayed in the table below:

Summary of computational transaction
Raw Inputview raw input (R code)
Raw Outputview raw output of R engine
Computing time1 seconds
R Server'Gwilym Jenkins' @ 72.249.127.135


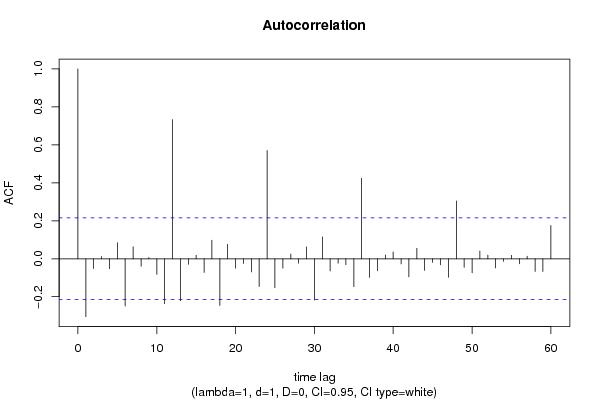
Autocorrelation Function
Time lag kACF(k)T-STATP-value
1-0.304956-2.77830.003378
2-0.051316-0.46750.320679
30.0117150.10670.457629
4-0.052171-0.47530.317911
50.0849710.77410.22053
6-0.249401-2.27210.012832
70.0633040.57670.282842
8-0.039126-0.35650.361201
90.0066680.06080.475852
10-0.082063-0.74760.228398
11-0.236775-2.15710.016944
120.7334066.68160
13-0.221279-2.01590.02352
14-0.028944-0.26370.396337
150.0183510.16720.433814
16-0.072127-0.65710.256464
170.0980280.89310.187198
18-0.245771-2.23910.013913
190.0762770.69490.244525
20-0.049502-0.4510.32659
21-0.025091-0.22860.409876
22-0.069732-0.63530.263492
23-0.146446-1.33420.092897
240.5698915.1921e-06
25-0.152158-1.38620.084695
26-0.049441-0.45040.326788
270.0248940.22680.410571
28-0.023283-0.21210.416267
290.0623840.56830.285668
30-0.217473-1.98130.025436
310.1151841.04940.148525
32-0.064281-0.58560.279856
33-0.023601-0.2150.415143
34-0.031277-0.28490.388198
35-0.146868-1.3380.09227
360.4240283.86310.000111
37-0.098512-0.89750.186027
38-0.063731-0.58060.281535
390.0198560.18090.428446
400.036190.32970.371228
41-0.027049-0.24640.402979
42-0.09495-0.8650.194757
430.0550760.50180.308579
44-0.061218-0.55770.289266
45-0.01902-0.17330.431426
46-0.031749-0.28920.386556
47-0.097629-0.88940.188167
480.3045152.77430.003416
49-0.04486-0.40870.341907
50-0.073919-0.67340.251271
510.0406860.37070.355913
520.0192090.1750.430753
53-0.048304-0.44010.330516
54-0.014412-0.13130.447926
550.0185270.16880.433186
56-0.026629-0.24260.404457
570.0136640.12450.450617
58-0.06646-0.60550.273256
59-0.066874-0.60930.272011
600.1755021.59890.056821

\begin{tabular}{lllllllll}
\hline
Autocorrelation Function \tabularnewline
Time lag k & ACF(k) & T-STAT & P-value \tabularnewline
1 & -0.304956 & -2.7783 & 0.003378 \tabularnewline
2 & -0.051316 & -0.4675 & 0.320679 \tabularnewline
3 & 0.011715 & 0.1067 & 0.457629 \tabularnewline
4 & -0.052171 & -0.4753 & 0.317911 \tabularnewline
5 & 0.084971 & 0.7741 & 0.22053 \tabularnewline
6 & -0.249401 & -2.2721 & 0.012832 \tabularnewline
7 & 0.063304 & 0.5767 & 0.282842 \tabularnewline
8 & -0.039126 & -0.3565 & 0.361201 \tabularnewline
9 & 0.006668 & 0.0608 & 0.475852 \tabularnewline
10 & -0.082063 & -0.7476 & 0.228398 \tabularnewline
11 & -0.236775 & -2.1571 & 0.016944 \tabularnewline
12 & 0.733406 & 6.6816 & 0 \tabularnewline
13 & -0.221279 & -2.0159 & 0.02352 \tabularnewline
14 & -0.028944 & -0.2637 & 0.396337 \tabularnewline
15 & 0.018351 & 0.1672 & 0.433814 \tabularnewline
16 & -0.072127 & -0.6571 & 0.256464 \tabularnewline
17 & 0.098028 & 0.8931 & 0.187198 \tabularnewline
18 & -0.245771 & -2.2391 & 0.013913 \tabularnewline
19 & 0.076277 & 0.6949 & 0.244525 \tabularnewline
20 & -0.049502 & -0.451 & 0.32659 \tabularnewline
21 & -0.025091 & -0.2286 & 0.409876 \tabularnewline
22 & -0.069732 & -0.6353 & 0.263492 \tabularnewline
23 & -0.146446 & -1.3342 & 0.092897 \tabularnewline
24 & 0.569891 & 5.192 & 1e-06 \tabularnewline
25 & -0.152158 & -1.3862 & 0.084695 \tabularnewline
26 & -0.049441 & -0.4504 & 0.326788 \tabularnewline
27 & 0.024894 & 0.2268 & 0.410571 \tabularnewline
28 & -0.023283 & -0.2121 & 0.416267 \tabularnewline
29 & 0.062384 & 0.5683 & 0.285668 \tabularnewline
30 & -0.217473 & -1.9813 & 0.025436 \tabularnewline
31 & 0.115184 & 1.0494 & 0.148525 \tabularnewline
32 & -0.064281 & -0.5856 & 0.279856 \tabularnewline
33 & -0.023601 & -0.215 & 0.415143 \tabularnewline
34 & -0.031277 & -0.2849 & 0.388198 \tabularnewline
35 & -0.146868 & -1.338 & 0.09227 \tabularnewline
36 & 0.424028 & 3.8631 & 0.000111 \tabularnewline
37 & -0.098512 & -0.8975 & 0.186027 \tabularnewline
38 & -0.063731 & -0.5806 & 0.281535 \tabularnewline
39 & 0.019856 & 0.1809 & 0.428446 \tabularnewline
40 & 0.03619 & 0.3297 & 0.371228 \tabularnewline
41 & -0.027049 & -0.2464 & 0.402979 \tabularnewline
42 & -0.09495 & -0.865 & 0.194757 \tabularnewline
43 & 0.055076 & 0.5018 & 0.308579 \tabularnewline
44 & -0.061218 & -0.5577 & 0.289266 \tabularnewline
45 & -0.01902 & -0.1733 & 0.431426 \tabularnewline
46 & -0.031749 & -0.2892 & 0.386556 \tabularnewline
47 & -0.097629 & -0.8894 & 0.188167 \tabularnewline
48 & 0.304515 & 2.7743 & 0.003416 \tabularnewline
49 & -0.04486 & -0.4087 & 0.341907 \tabularnewline
50 & -0.073919 & -0.6734 & 0.251271 \tabularnewline
51 & 0.040686 & 0.3707 & 0.355913 \tabularnewline
52 & 0.019209 & 0.175 & 0.430753 \tabularnewline
53 & -0.048304 & -0.4401 & 0.330516 \tabularnewline
54 & -0.014412 & -0.1313 & 0.447926 \tabularnewline
55 & 0.018527 & 0.1688 & 0.433186 \tabularnewline
56 & -0.026629 & -0.2426 & 0.404457 \tabularnewline
57 & 0.013664 & 0.1245 & 0.450617 \tabularnewline
58 & -0.06646 & -0.6055 & 0.273256 \tabularnewline
59 & -0.066874 & -0.6093 & 0.272011 \tabularnewline
60 & 0.175502 & 1.5989 & 0.056821 \tabularnewline
\hline
\end{tabular}
%Source: https://freestatistics.org/blog/index.php?pk=70238&T=1

[TABLE]
[ROW][C]Autocorrelation Function[/C][/ROW]
[ROW][C]Time lag k[/C][C]ACF(k)[/C][C]T-STAT[/C][C]P-value[/C][/ROW]
[ROW][C]1[/C][C]-0.304956[/C][C]-2.7783[/C][C]0.003378[/C][/ROW]
[ROW][C]2[/C][C]-0.051316[/C][C]-0.4675[/C][C]0.320679[/C][/ROW]
[ROW][C]3[/C][C]0.011715[/C][C]0.1067[/C][C]0.457629[/C][/ROW]
[ROW][C]4[/C][C]-0.052171[/C][C]-0.4753[/C][C]0.317911[/C][/ROW]
[ROW][C]5[/C][C]0.084971[/C][C]0.7741[/C][C]0.22053[/C][/ROW]
[ROW][C]6[/C][C]-0.249401[/C][C]-2.2721[/C][C]0.012832[/C][/ROW]
[ROW][C]7[/C][C]0.063304[/C][C]0.5767[/C][C]0.282842[/C][/ROW]
[ROW][C]8[/C][C]-0.039126[/C][C]-0.3565[/C][C]0.361201[/C][/ROW]
[ROW][C]9[/C][C]0.006668[/C][C]0.0608[/C][C]0.475852[/C][/ROW]
[ROW][C]10[/C][C]-0.082063[/C][C]-0.7476[/C][C]0.228398[/C][/ROW]
[ROW][C]11[/C][C]-0.236775[/C][C]-2.1571[/C][C]0.016944[/C][/ROW]
[ROW][C]12[/C][C]0.733406[/C][C]6.6816[/C][C]0[/C][/ROW]
[ROW][C]13[/C][C]-0.221279[/C][C]-2.0159[/C][C]0.02352[/C][/ROW]
[ROW][C]14[/C][C]-0.028944[/C][C]-0.2637[/C][C]0.396337[/C][/ROW]
[ROW][C]15[/C][C]0.018351[/C][C]0.1672[/C][C]0.433814[/C][/ROW]
[ROW][C]16[/C][C]-0.072127[/C][C]-0.6571[/C][C]0.256464[/C][/ROW]
[ROW][C]17[/C][C]0.098028[/C][C]0.8931[/C][C]0.187198[/C][/ROW]
[ROW][C]18[/C][C]-0.245771[/C][C]-2.2391[/C][C]0.013913[/C][/ROW]
[ROW][C]19[/C][C]0.076277[/C][C]0.6949[/C][C]0.244525[/C][/ROW]
[ROW][C]20[/C][C]-0.049502[/C][C]-0.451[/C][C]0.32659[/C][/ROW]
[ROW][C]21[/C][C]-0.025091[/C][C]-0.2286[/C][C]0.409876[/C][/ROW]
[ROW][C]22[/C][C]-0.069732[/C][C]-0.6353[/C][C]0.263492[/C][/ROW]
[ROW][C]23[/C][C]-0.146446[/C][C]-1.3342[/C][C]0.092897[/C][/ROW]
[ROW][C]24[/C][C]0.569891[/C][C]5.192[/C][C]1e-06[/C][/ROW]
[ROW][C]25[/C][C]-0.152158[/C][C]-1.3862[/C][C]0.084695[/C][/ROW]
[ROW][C]26[/C][C]-0.049441[/C][C]-0.4504[/C][C]0.326788[/C][/ROW]
[ROW][C]27[/C][C]0.024894[/C][C]0.2268[/C][C]0.410571[/C][/ROW]
[ROW][C]28[/C][C]-0.023283[/C][C]-0.2121[/C][C]0.416267[/C][/ROW]
[ROW][C]29[/C][C]0.062384[/C][C]0.5683[/C][C]0.285668[/C][/ROW]
[ROW][C]30[/C][C]-0.217473[/C][C]-1.9813[/C][C]0.025436[/C][/ROW]
[ROW][C]31[/C][C]0.115184[/C][C]1.0494[/C][C]0.148525[/C][/ROW]
[ROW][C]32[/C][C]-0.064281[/C][C]-0.5856[/C][C]0.279856[/C][/ROW]
[ROW][C]33[/C][C]-0.023601[/C][C]-0.215[/C][C]0.415143[/C][/ROW]
[ROW][C]34[/C][C]-0.031277[/C][C]-0.2849[/C][C]0.388198[/C][/ROW]
[ROW][C]35[/C][C]-0.146868[/C][C]-1.338[/C][C]0.09227[/C][/ROW]
[ROW][C]36[/C][C]0.424028[/C][C]3.8631[/C][C]0.000111[/C][/ROW]
[ROW][C]37[/C][C]-0.098512[/C][C]-0.8975[/C][C]0.186027[/C][/ROW]
[ROW][C]38[/C][C]-0.063731[/C][C]-0.5806[/C][C]0.281535[/C][/ROW]
[ROW][C]39[/C][C]0.019856[/C][C]0.1809[/C][C]0.428446[/C][/ROW]
[ROW][C]40[/C][C]0.03619[/C][C]0.3297[/C][C]0.371228[/C][/ROW]
[ROW][C]41[/C][C]-0.027049[/C][C]-0.2464[/C][C]0.402979[/C][/ROW]
[ROW][C]42[/C][C]-0.09495[/C][C]-0.865[/C][C]0.194757[/C][/ROW]
[ROW][C]43[/C][C]0.055076[/C][C]0.5018[/C][C]0.308579[/C][/ROW]
[ROW][C]44[/C][C]-0.061218[/C][C]-0.5577[/C][C]0.289266[/C][/ROW]
[ROW][C]45[/C][C]-0.01902[/C][C]-0.1733[/C][C]0.431426[/C][/ROW]
[ROW][C]46[/C][C]-0.031749[/C][C]-0.2892[/C][C]0.386556[/C][/ROW]
[ROW][C]47[/C][C]-0.097629[/C][C]-0.8894[/C][C]0.188167[/C][/ROW]
[ROW][C]48[/C][C]0.304515[/C][C]2.7743[/C][C]0.003416[/C][/ROW]
[ROW][C]49[/C][C]-0.04486[/C][C]-0.4087[/C][C]0.341907[/C][/ROW]
[ROW][C]50[/C][C]-0.073919[/C][C]-0.6734[/C][C]0.251271[/C][/ROW]
[ROW][C]51[/C][C]0.040686[/C][C]0.3707[/C][C]0.355913[/C][/ROW]
[ROW][C]52[/C][C]0.019209[/C][C]0.175[/C][C]0.430753[/C][/ROW]
[ROW][C]53[/C][C]-0.048304[/C][C]-0.4401[/C][C]0.330516[/C][/ROW]
[ROW][C]54[/C][C]-0.014412[/C][C]-0.1313[/C][C]0.447926[/C][/ROW]
[ROW][C]55[/C][C]0.018527[/C][C]0.1688[/C][C]0.433186[/C][/ROW]
[ROW][C]56[/C][C]-0.026629[/C][C]-0.2426[/C][C]0.404457[/C][/ROW]
[ROW][C]57[/C][C]0.013664[/C][C]0.1245[/C][C]0.450617[/C][/ROW]
[ROW][C]58[/C][C]-0.06646[/C][C]-0.6055[/C][C]0.273256[/C][/ROW]
[ROW][C]59[/C][C]-0.066874[/C][C]-0.6093[/C][C]0.272011[/C][/ROW]
[ROW][C]60[/C][C]0.175502[/C][C]1.5989[/C][C]0.056821[/C][/ROW]
[/TABLE]
Source: https://freestatistics.org/blog/index.php?pk=70238&T=1

Globally Unique Identifier (entire table): ba.freestatistics.org/blog/index.php?pk=70238&T=1

As an alternative you can also use a QR Code:  

The GUIDs for individual cells are displayed in the table below:

Autocorrelation Function
Time lag kACF(k)T-STATP-value
1-0.304956-2.77830.003378
2-0.051316-0.46750.320679
30.0117150.10670.457629
4-0.052171-0.47530.317911
50.0849710.77410.22053
6-0.249401-2.27210.012832
70.0633040.57670.282842
8-0.039126-0.35650.361201
90.0066680.06080.475852
10-0.082063-0.74760.228398
11-0.236775-2.15710.016944
120.7334066.68160
13-0.221279-2.01590.02352
14-0.028944-0.26370.396337
150.0183510.16720.433814
16-0.072127-0.65710.256464
170.0980280.89310.187198
18-0.245771-2.23910.013913
190.0762770.69490.244525
20-0.049502-0.4510.32659
21-0.025091-0.22860.409876
22-0.069732-0.63530.263492
23-0.146446-1.33420.092897
240.5698915.1921e-06
25-0.152158-1.38620.084695
26-0.049441-0.45040.326788
270.0248940.22680.410571
28-0.023283-0.21210.416267
290.0623840.56830.285668
30-0.217473-1.98130.025436
310.1151841.04940.148525
32-0.064281-0.58560.279856
33-0.023601-0.2150.415143
34-0.031277-0.28490.388198
35-0.146868-1.3380.09227
360.4240283.86310.000111
37-0.098512-0.89750.186027
38-0.063731-0.58060.281535
390.0198560.18090.428446
400.036190.32970.371228
41-0.027049-0.24640.402979
42-0.09495-0.8650.194757
430.0550760.50180.308579
44-0.061218-0.55770.289266
45-0.01902-0.17330.431426
46-0.031749-0.28920.386556
47-0.097629-0.88940.188167
480.3045152.77430.003416
49-0.04486-0.40870.341907
50-0.073919-0.67340.251271
510.0406860.37070.355913
520.0192090.1750.430753
53-0.048304-0.44010.330516
54-0.014412-0.13130.447926
550.0185270.16880.433186
56-0.026629-0.24260.404457
570.0136640.12450.450617
58-0.06646-0.60550.273256
59-0.066874-0.60930.272011
600.1755021.59890.056821


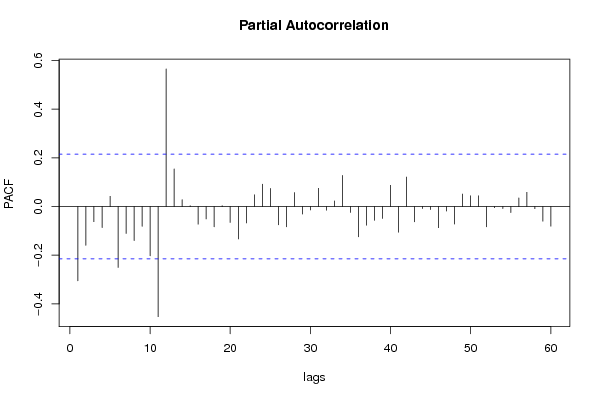
Partial Autocorrelation Function
Time lag kPACF(k)T-STATP-value
1-0.304956-2.77830.003378
2-0.159111-1.44960.075473
3-0.062153-0.56620.28638
4-0.086484-0.78790.216497
50.0421740.38420.350896
6-0.250109-2.27860.01263
7-0.11027-1.00460.159003
8-0.139946-1.2750.10294
9-0.081238-0.74010.23066
10-0.202199-1.84210.034514
11-0.452337-4.1214.4e-05
120.5653885.15091e-06
130.1544471.40710.081569
140.028280.25760.398659
150.0035470.03230.48715
16-0.07271-0.66240.25477
17-0.051128-0.46580.321289
18-0.083317-0.75910.224985
190.0037160.03390.486538
20-0.065215-0.59410.277017
21-0.13282-1.21010.114847
22-0.067469-0.61470.270225
230.0482190.43930.330794
240.0918770.8370.202487
250.0745170.67890.24955
26-0.075051-0.68370.24802
27-0.083282-0.75870.225079
280.0576610.52530.30038
29-0.030901-0.28150.389505
30-0.013766-0.12540.45025
310.0748370.68180.248632
32-0.014786-0.13470.446587
330.0232210.21150.416489
340.1276641.16310.124066
35-0.02441-0.22240.412278
36-0.124161-1.13120.130623
37-0.076787-0.69960.243077
38-0.056425-0.51410.30429
39-0.0489-0.44550.328559
400.0872310.79470.214523
41-0.105283-0.95920.170128
420.1210291.10260.136688
43-0.062881-0.57290.284141
44-0.008345-0.0760.469789
45-0.01254-0.11420.454661
46-0.086727-0.79010.215855
47-0.018704-0.17040.432556
48-0.071688-0.65310.257747
490.0511510.4660.321215
500.0443420.4040.343635
510.0442250.40290.344027
52-0.083121-0.75730.225516
53-0.004435-0.04040.483933
54-0.008194-0.07470.470336
55-0.024612-0.22420.411566
560.0352690.32130.374388
570.058640.53420.297303
58-0.00856-0.0780.469013
59-0.059884-0.54560.293413
60-0.080564-0.7340.232516

\begin{tabular}{lllllllll}
\hline
Partial Autocorrelation Function \tabularnewline
Time lag k & PACF(k) & T-STAT & P-value \tabularnewline
1 & -0.304956 & -2.7783 & 0.003378 \tabularnewline
2 & -0.159111 & -1.4496 & 0.075473 \tabularnewline
3 & -0.062153 & -0.5662 & 0.28638 \tabularnewline
4 & -0.086484 & -0.7879 & 0.216497 \tabularnewline
5 & 0.042174 & 0.3842 & 0.350896 \tabularnewline
6 & -0.250109 & -2.2786 & 0.01263 \tabularnewline
7 & -0.11027 & -1.0046 & 0.159003 \tabularnewline
8 & -0.139946 & -1.275 & 0.10294 \tabularnewline
9 & -0.081238 & -0.7401 & 0.23066 \tabularnewline
10 & -0.202199 & -1.8421 & 0.034514 \tabularnewline
11 & -0.452337 & -4.121 & 4.4e-05 \tabularnewline
12 & 0.565388 & 5.1509 & 1e-06 \tabularnewline
13 & 0.154447 & 1.4071 & 0.081569 \tabularnewline
14 & 0.02828 & 0.2576 & 0.398659 \tabularnewline
15 & 0.003547 & 0.0323 & 0.48715 \tabularnewline
16 & -0.07271 & -0.6624 & 0.25477 \tabularnewline
17 & -0.051128 & -0.4658 & 0.321289 \tabularnewline
18 & -0.083317 & -0.7591 & 0.224985 \tabularnewline
19 & 0.003716 & 0.0339 & 0.486538 \tabularnewline
20 & -0.065215 & -0.5941 & 0.277017 \tabularnewline
21 & -0.13282 & -1.2101 & 0.114847 \tabularnewline
22 & -0.067469 & -0.6147 & 0.270225 \tabularnewline
23 & 0.048219 & 0.4393 & 0.330794 \tabularnewline
24 & 0.091877 & 0.837 & 0.202487 \tabularnewline
25 & 0.074517 & 0.6789 & 0.24955 \tabularnewline
26 & -0.075051 & -0.6837 & 0.24802 \tabularnewline
27 & -0.083282 & -0.7587 & 0.225079 \tabularnewline
28 & 0.057661 & 0.5253 & 0.30038 \tabularnewline
29 & -0.030901 & -0.2815 & 0.389505 \tabularnewline
30 & -0.013766 & -0.1254 & 0.45025 \tabularnewline
31 & 0.074837 & 0.6818 & 0.248632 \tabularnewline
32 & -0.014786 & -0.1347 & 0.446587 \tabularnewline
33 & 0.023221 & 0.2115 & 0.416489 \tabularnewline
34 & 0.127664 & 1.1631 & 0.124066 \tabularnewline
35 & -0.02441 & -0.2224 & 0.412278 \tabularnewline
36 & -0.124161 & -1.1312 & 0.130623 \tabularnewline
37 & -0.076787 & -0.6996 & 0.243077 \tabularnewline
38 & -0.056425 & -0.5141 & 0.30429 \tabularnewline
39 & -0.0489 & -0.4455 & 0.328559 \tabularnewline
40 & 0.087231 & 0.7947 & 0.214523 \tabularnewline
41 & -0.105283 & -0.9592 & 0.170128 \tabularnewline
42 & 0.121029 & 1.1026 & 0.136688 \tabularnewline
43 & -0.062881 & -0.5729 & 0.284141 \tabularnewline
44 & -0.008345 & -0.076 & 0.469789 \tabularnewline
45 & -0.01254 & -0.1142 & 0.454661 \tabularnewline
46 & -0.086727 & -0.7901 & 0.215855 \tabularnewline
47 & -0.018704 & -0.1704 & 0.432556 \tabularnewline
48 & -0.071688 & -0.6531 & 0.257747 \tabularnewline
49 & 0.051151 & 0.466 & 0.321215 \tabularnewline
50 & 0.044342 & 0.404 & 0.343635 \tabularnewline
51 & 0.044225 & 0.4029 & 0.344027 \tabularnewline
52 & -0.083121 & -0.7573 & 0.225516 \tabularnewline
53 & -0.004435 & -0.0404 & 0.483933 \tabularnewline
54 & -0.008194 & -0.0747 & 0.470336 \tabularnewline
55 & -0.024612 & -0.2242 & 0.411566 \tabularnewline
56 & 0.035269 & 0.3213 & 0.374388 \tabularnewline
57 & 0.05864 & 0.5342 & 0.297303 \tabularnewline
58 & -0.00856 & -0.078 & 0.469013 \tabularnewline
59 & -0.059884 & -0.5456 & 0.293413 \tabularnewline
60 & -0.080564 & -0.734 & 0.232516 \tabularnewline
\hline
\end{tabular}
%Source: https://freestatistics.org/blog/index.php?pk=70238&T=2

[TABLE]
[ROW][C]Partial Autocorrelation Function[/C][/ROW]
[ROW][C]Time lag k[/C][C]PACF(k)[/C][C]T-STAT[/C][C]P-value[/C][/ROW]
[ROW][C]1[/C][C]-0.304956[/C][C]-2.7783[/C][C]0.003378[/C][/ROW]
[ROW][C]2[/C][C]-0.159111[/C][C]-1.4496[/C][C]0.075473[/C][/ROW]
[ROW][C]3[/C][C]-0.062153[/C][C]-0.5662[/C][C]0.28638[/C][/ROW]
[ROW][C]4[/C][C]-0.086484[/C][C]-0.7879[/C][C]0.216497[/C][/ROW]
[ROW][C]5[/C][C]0.042174[/C][C]0.3842[/C][C]0.350896[/C][/ROW]
[ROW][C]6[/C][C]-0.250109[/C][C]-2.2786[/C][C]0.01263[/C][/ROW]
[ROW][C]7[/C][C]-0.11027[/C][C]-1.0046[/C][C]0.159003[/C][/ROW]
[ROW][C]8[/C][C]-0.139946[/C][C]-1.275[/C][C]0.10294[/C][/ROW]
[ROW][C]9[/C][C]-0.081238[/C][C]-0.7401[/C][C]0.23066[/C][/ROW]
[ROW][C]10[/C][C]-0.202199[/C][C]-1.8421[/C][C]0.034514[/C][/ROW]
[ROW][C]11[/C][C]-0.452337[/C][C]-4.121[/C][C]4.4e-05[/C][/ROW]
[ROW][C]12[/C][C]0.565388[/C][C]5.1509[/C][C]1e-06[/C][/ROW]
[ROW][C]13[/C][C]0.154447[/C][C]1.4071[/C][C]0.081569[/C][/ROW]
[ROW][C]14[/C][C]0.02828[/C][C]0.2576[/C][C]0.398659[/C][/ROW]
[ROW][C]15[/C][C]0.003547[/C][C]0.0323[/C][C]0.48715[/C][/ROW]
[ROW][C]16[/C][C]-0.07271[/C][C]-0.6624[/C][C]0.25477[/C][/ROW]
[ROW][C]17[/C][C]-0.051128[/C][C]-0.4658[/C][C]0.321289[/C][/ROW]
[ROW][C]18[/C][C]-0.083317[/C][C]-0.7591[/C][C]0.224985[/C][/ROW]
[ROW][C]19[/C][C]0.003716[/C][C]0.0339[/C][C]0.486538[/C][/ROW]
[ROW][C]20[/C][C]-0.065215[/C][C]-0.5941[/C][C]0.277017[/C][/ROW]
[ROW][C]21[/C][C]-0.13282[/C][C]-1.2101[/C][C]0.114847[/C][/ROW]
[ROW][C]22[/C][C]-0.067469[/C][C]-0.6147[/C][C]0.270225[/C][/ROW]
[ROW][C]23[/C][C]0.048219[/C][C]0.4393[/C][C]0.330794[/C][/ROW]
[ROW][C]24[/C][C]0.091877[/C][C]0.837[/C][C]0.202487[/C][/ROW]
[ROW][C]25[/C][C]0.074517[/C][C]0.6789[/C][C]0.24955[/C][/ROW]
[ROW][C]26[/C][C]-0.075051[/C][C]-0.6837[/C][C]0.24802[/C][/ROW]
[ROW][C]27[/C][C]-0.083282[/C][C]-0.7587[/C][C]0.225079[/C][/ROW]
[ROW][C]28[/C][C]0.057661[/C][C]0.5253[/C][C]0.30038[/C][/ROW]
[ROW][C]29[/C][C]-0.030901[/C][C]-0.2815[/C][C]0.389505[/C][/ROW]
[ROW][C]30[/C][C]-0.013766[/C][C]-0.1254[/C][C]0.45025[/C][/ROW]
[ROW][C]31[/C][C]0.074837[/C][C]0.6818[/C][C]0.248632[/C][/ROW]
[ROW][C]32[/C][C]-0.014786[/C][C]-0.1347[/C][C]0.446587[/C][/ROW]
[ROW][C]33[/C][C]0.023221[/C][C]0.2115[/C][C]0.416489[/C][/ROW]
[ROW][C]34[/C][C]0.127664[/C][C]1.1631[/C][C]0.124066[/C][/ROW]
[ROW][C]35[/C][C]-0.02441[/C][C]-0.2224[/C][C]0.412278[/C][/ROW]
[ROW][C]36[/C][C]-0.124161[/C][C]-1.1312[/C][C]0.130623[/C][/ROW]
[ROW][C]37[/C][C]-0.076787[/C][C]-0.6996[/C][C]0.243077[/C][/ROW]
[ROW][C]38[/C][C]-0.056425[/C][C]-0.5141[/C][C]0.30429[/C][/ROW]
[ROW][C]39[/C][C]-0.0489[/C][C]-0.4455[/C][C]0.328559[/C][/ROW]
[ROW][C]40[/C][C]0.087231[/C][C]0.7947[/C][C]0.214523[/C][/ROW]
[ROW][C]41[/C][C]-0.105283[/C][C]-0.9592[/C][C]0.170128[/C][/ROW]
[ROW][C]42[/C][C]0.121029[/C][C]1.1026[/C][C]0.136688[/C][/ROW]
[ROW][C]43[/C][C]-0.062881[/C][C]-0.5729[/C][C]0.284141[/C][/ROW]
[ROW][C]44[/C][C]-0.008345[/C][C]-0.076[/C][C]0.469789[/C][/ROW]
[ROW][C]45[/C][C]-0.01254[/C][C]-0.1142[/C][C]0.454661[/C][/ROW]
[ROW][C]46[/C][C]-0.086727[/C][C]-0.7901[/C][C]0.215855[/C][/ROW]
[ROW][C]47[/C][C]-0.018704[/C][C]-0.1704[/C][C]0.432556[/C][/ROW]
[ROW][C]48[/C][C]-0.071688[/C][C]-0.6531[/C][C]0.257747[/C][/ROW]
[ROW][C]49[/C][C]0.051151[/C][C]0.466[/C][C]0.321215[/C][/ROW]
[ROW][C]50[/C][C]0.044342[/C][C]0.404[/C][C]0.343635[/C][/ROW]
[ROW][C]51[/C][C]0.044225[/C][C]0.4029[/C][C]0.344027[/C][/ROW]
[ROW][C]52[/C][C]-0.083121[/C][C]-0.7573[/C][C]0.225516[/C][/ROW]
[ROW][C]53[/C][C]-0.004435[/C][C]-0.0404[/C][C]0.483933[/C][/ROW]
[ROW][C]54[/C][C]-0.008194[/C][C]-0.0747[/C][C]0.470336[/C][/ROW]
[ROW][C]55[/C][C]-0.024612[/C][C]-0.2242[/C][C]0.411566[/C][/ROW]
[ROW][C]56[/C][C]0.035269[/C][C]0.3213[/C][C]0.374388[/C][/ROW]
[ROW][C]57[/C][C]0.05864[/C][C]0.5342[/C][C]0.297303[/C][/ROW]
[ROW][C]58[/C][C]-0.00856[/C][C]-0.078[/C][C]0.469013[/C][/ROW]
[ROW][C]59[/C][C]-0.059884[/C][C]-0.5456[/C][C]0.293413[/C][/ROW]
[ROW][C]60[/C][C]-0.080564[/C][C]-0.734[/C][C]0.232516[/C][/ROW]
[/TABLE]
Source: https://freestatistics.org/blog/index.php?pk=70238&T=2

Globally Unique Identifier (entire table): ba.freestatistics.org/blog/index.php?pk=70238&T=2

As an alternative you can also use a QR Code:  

The GUIDs for individual cells are displayed in the table below:

Partial Autocorrelation Function
Time lag kPACF(k)T-STATP-value
1-0.304956-2.77830.003378
2-0.159111-1.44960.075473
3-0.062153-0.56620.28638
4-0.086484-0.78790.216497
50.0421740.38420.350896
6-0.250109-2.27860.01263
7-0.11027-1.00460.159003
8-0.139946-1.2750.10294
9-0.081238-0.74010.23066
10-0.202199-1.84210.034514
11-0.452337-4.1214.4e-05
120.5653885.15091e-06
130.1544471.40710.081569
140.028280.25760.398659
150.0035470.03230.48715
16-0.07271-0.66240.25477
17-0.051128-0.46580.321289
18-0.083317-0.75910.224985
190.0037160.03390.486538
20-0.065215-0.59410.277017
21-0.13282-1.21010.114847
22-0.067469-0.61470.270225
230.0482190.43930.330794
240.0918770.8370.202487
250.0745170.67890.24955
26-0.075051-0.68370.24802
27-0.083282-0.75870.225079
280.0576610.52530.30038
29-0.030901-0.28150.389505
30-0.013766-0.12540.45025
310.0748370.68180.248632
32-0.014786-0.13470.446587
330.0232210.21150.416489
340.1276641.16310.124066
35-0.02441-0.22240.412278
36-0.124161-1.13120.130623
37-0.076787-0.69960.243077
38-0.056425-0.51410.30429
39-0.0489-0.44550.328559
400.0872310.79470.214523
41-0.105283-0.95920.170128
420.1210291.10260.136688
43-0.062881-0.57290.284141
44-0.008345-0.0760.469789
45-0.01254-0.11420.454661
46-0.086727-0.79010.215855
47-0.018704-0.17040.432556
48-0.071688-0.65310.257747
490.0511510.4660.321215
500.0443420.4040.343635
510.0442250.40290.344027
52-0.083121-0.75730.225516
53-0.004435-0.04040.483933
54-0.008194-0.07470.470336
55-0.024612-0.22420.411566
560.0352690.32130.374388
570.058640.53420.297303
58-0.00856-0.0780.469013
59-0.059884-0.54560.293413
60-0.080564-0.7340.232516


Parameters (Session):
par1 = 60 ; par2 = 1 ; par3 = 1 ; par4 = 0 ; par5 = 12 ; par6 = White Noise ; par7 = 0.95 ;
Parameters (R input):
par1 = 60 ; par2 = 1 ; par3 = 1 ; par4 = 0 ; par5 = 12 ; par6 = White Noise ; par7 = 0.95 ;
R code (references can be found in the software module):
if (par1 == 'Default') {
par1 = 10*log10(length(x))
} else {
par1 <- as.numeric(par1)
}
par2 <- as.numeric(par2)
par3 <- as.numeric(par3)
par4 <- as.numeric(par4)
par5 <- as.numeric(par5)
if (par6 == 'White Noise') par6 <- 'white' else par6 <- 'ma'
par7 <- as.numeric(par7)
if (par2 == 0) {
x <- log(x)
} else {
x <- (x ^ par2 - 1) / par2
}
if (par3 > 0) x <- diff(x,lag=1,difference=par3)
if (par4 > 0) x <- diff(x,lag=par5,difference=par4)
bitmap(file='pic1.png')
racf <- acf(x, par1, main='Autocorrelation', xlab='time lag', ylab='ACF', ci.type=par6, ci=par7, sub=paste('(lambda=',par2,', d=',par3,', D=',par4,', CI=', par7, ', CI type=',par6,')',sep=''))
dev.off()
bitmap(file='pic2.png')
rpacf <- pacf(x,par1,main='Partial Autocorrelation',xlab='lags',ylab='PACF')
dev.off()
(myacf <- c(racf$acf))
(mypacf <- c(rpacf$acf))
lengthx <- length(x)
sqrtn <- sqrt(lengthx)
load(file='createtable')
a<-table.start()
a<-table.row.start(a)
a<-table.element(a,'Autocorrelation Function',4,TRUE)
a<-table.row.end(a)
a<-table.row.start(a)
a<-table.element(a,'Time lag k',header=TRUE)
a<-table.element(a,hyperlink('basics.htm','ACF(k)','click here for more information about the Autocorrelation Function'),header=TRUE)
a<-table.element(a,'T-STAT',header=TRUE)
a<-table.element(a,'P-value',header=TRUE)
a<-table.row.end(a)
for (i in 2:(par1+1)) {
a<-table.row.start(a)
a<-table.element(a,i-1,header=TRUE)
a<-table.element(a,round(myacf[i],6))
mytstat <- myacf[i]*sqrtn
a<-table.element(a,round(mytstat,4))
a<-table.element(a,round(1-pt(abs(mytstat),lengthx),6))
a<-table.row.end(a)
}
a<-table.end(a)
table.save(a,file='mytable.tab')
a<-table.start()
a<-table.row.start(a)
a<-table.element(a,'Partial Autocorrelation Function',4,TRUE)
a<-table.row.end(a)
a<-table.row.start(a)
a<-table.element(a,'Time lag k',header=TRUE)
a<-table.element(a,hyperlink('basics.htm','PACF(k)','click here for more information about the Partial Autocorrelation Function'),header=TRUE)
a<-table.element(a,'T-STAT',header=TRUE)
a<-table.element(a,'P-value',header=TRUE)
a<-table.row.end(a)
for (i in 1:par1) {
a<-table.row.start(a)
a<-table.element(a,i,header=TRUE)
a<-table.element(a,round(mypacf[i],6))
mytstat <- mypacf[i]*sqrtn
a<-table.element(a,round(mytstat,4))
a<-table.element(a,round(1-pt(abs(mytstat),lengthx),6))
a<-table.row.end(a)
}
a<-table.end(a)
table.save(a,file='mytable1.tab')