Free Statistics

of Irreproducible Research!

Author's title

Author*The author of this computation has been verified*
R Software Modulerwasp_autocorrelation.wasp
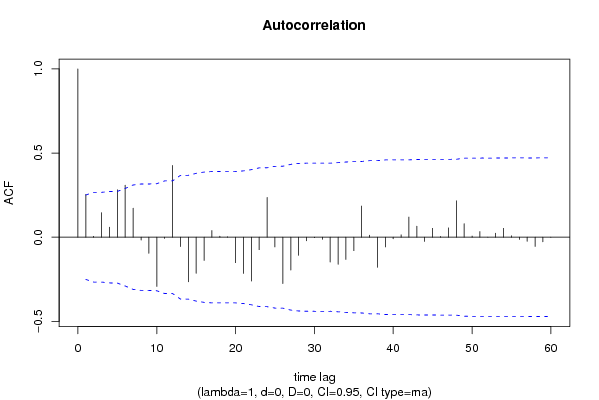
Title produced by software(Partial) Autocorrelation Function
Date of computationMon, 21 Dec 2009 06:47:14 -0700
Cite this page as followsStatistical Computations at FreeStatistics.org, Office for Research Development and Education, URL https://freestatistics.org/blog/index.php?v=date/2009/Dec/21/t1261403303146xiu7ay28ohuu.htm/, Retrieved Sun, 05 May 2024 19:25:50 +0000
Statistical Computations at FreeStatistics.org, Office for Research Development and Education, URL https://freestatistics.org/blog/index.php?pk=70156, Retrieved Sun, 05 May 2024 19:25:50 +0000
QR Codes:

Original text written by user:
IsPrivate?No (this computation is public)
User-defined keywords
Estimated Impact103
Family? (F = Feedback message, R = changed R code, M = changed R Module, P = changed Parameters, D = changed Data)
-     [Univariate Explorative Data Analysis] [Run Sequence gebo...] [2008-12-12 13:32:37] [76963dc1903f0f612b6153510a3818cf]
- R  D  [Univariate Explorative Data Analysis] [Run Sequence gebo...] [2008-12-17 12:14:40] [76963dc1903f0f612b6153510a3818cf]
-         [Univariate Explorative Data Analysis] [Run Sequence Plot...] [2008-12-22 18:19:51] [1ce0d16c8f4225c977b42c8fa93bc163]
- RMP       [(Partial) Autocorrelation Function] [Identifying Integ...] [2009-11-22 12:16:10] [b98453cac15ba1066b407e146608df68]
-   PD          [(Partial) Autocorrelation Function] [Autocorrelation f...] [2009-12-21 13:47:14] [0744dbfa8cdb263e2e292d0a5ee9dc89] [Current]
Feedback Forum

Post a new message
Dataseries X:
114.1
110.3
103.9
101.6
94.6
95.9
104.7
102.8
98.1
113.9
80.9
95.7
113.2
105.9
108.8
102.3
99
100.7
115.5
100.7
109.9
114.6
85.4
100.5
114.8
116.5
112.9
102
106
105.3
118.8
106.1
109.3
117.2
92.5
104.2
112.5
122.4
113.3
100
110.7
112.8
109.8
117.3
109.1
115.9
96
99.8
116.8
115.7
99.4
94.3
91
93.2
103.1
94.1
91.8
102.7
82.6
89.1
104.5


Summary of computational transaction
Raw Inputview raw input (R code)
Raw Outputview raw output of R engine
Computing time2 seconds
R Server'Gwilym Jenkins' @ 72.249.127.135

\begin{tabular}{lllllllll}
\hline
Summary of computational transaction \tabularnewline
Raw Input & view raw input (R code)  \tabularnewline
Raw Output & view raw output of R engine  \tabularnewline
Computing time & 2 seconds \tabularnewline
R Server & 'Gwilym Jenkins' @ 72.249.127.135 \tabularnewline
\hline
\end{tabular}
%Source: https://freestatistics.org/blog/index.php?pk=70156&T=0

[TABLE]
[ROW][C]Summary of computational transaction[/C][/ROW]
[ROW][C]Raw Input[/C][C]view raw input (R code) [/C][/ROW]
[ROW][C]Raw Output[/C][C]view raw output of R engine [/C][/ROW]
[ROW][C]Computing time[/C][C]2 seconds[/C][/ROW]
[ROW][C]R Server[/C][C]'Gwilym Jenkins' @ 72.249.127.135[/C][/ROW]
[/TABLE]
Source: https://freestatistics.org/blog/index.php?pk=70156&T=0

Globally Unique Identifier (entire table): ba.freestatistics.org/blog/index.php?pk=70156&T=0

As an alternative you can also use a QR Code:  

The GUIDs for individual cells are displayed in the table below:

Summary of computational transaction
Raw Inputview raw input (R code)
Raw Outputview raw output of R engine
Computing time2 seconds
R Server'Gwilym Jenkins' @ 72.249.127.135


Autocorrelation Function
Time lag kACF(k)T-STATP-value
10.2544651.98740.025684
20.0052230.04080.483796
30.1456571.13760.129865
40.0594130.4640.322138
50.2818482.20130.015754
60.309242.41520.009368
70.1728261.34980.091032
8-0.016577-0.12950.448707
9-0.095706-0.74750.228821
10-0.292391-2.28360.012944
11-0.007335-0.05730.47725
120.426623.3320.000734
13-0.055862-0.43630.332082
14-0.265195-2.07120.021287
15-0.214449-1.67490.049537
16-0.138002-1.07780.142676
170.0393690.30750.379762
180.0059350.04640.48159
190.0021930.01710.493196
20-0.151769-1.18540.120237
21-0.215484-1.6830.048745
22-0.260895-2.03770.022964
23-0.073897-0.57720.282979
240.236091.84390.035026
25-0.05752-0.44920.327422
26-0.275686-2.15320.017634
27-0.194924-1.52240.066538
28-0.107866-0.84250.20141
29-0.021398-0.16710.433914
30-0.003125-0.02440.490305
31-0.012369-0.09660.461678
32-0.148017-1.15610.126084
33-0.160928-1.25690.106793
34-0.131822-1.02960.15364
35-0.080086-0.62550.26699
360.1854161.44810.076348
370.0122610.09580.462012
38-0.178901-1.39730.083698
39-0.057859-0.45190.326476
40-0.009721-0.07590.469865
410.0140770.10990.456406
420.120080.93790.176009
430.0652270.50940.30614
44-0.0252-0.19680.422312
450.0527830.41220.340801
460.0044830.0350.486092
470.0555370.43380.332998
480.2166341.6920.047877
490.0804920.62870.265958
500.0066450.05190.47939
510.033960.26520.395861
520.0004120.00320.498721
530.0241990.1890.425361
540.0531670.41520.33971
550.0083810.06550.474013
56-0.01334-0.10420.458681
57-0.024543-0.19170.424311
58-0.054664-0.42690.335462
59-0.027045-0.21120.416708
60-5.7e-05-4e-040.499822

\begin{tabular}{lllllllll}
\hline
Autocorrelation Function \tabularnewline
Time lag k & ACF(k) & T-STAT & P-value \tabularnewline
1 & 0.254465 & 1.9874 & 0.025684 \tabularnewline
2 & 0.005223 & 0.0408 & 0.483796 \tabularnewline
3 & 0.145657 & 1.1376 & 0.129865 \tabularnewline
4 & 0.059413 & 0.464 & 0.322138 \tabularnewline
5 & 0.281848 & 2.2013 & 0.015754 \tabularnewline
6 & 0.30924 & 2.4152 & 0.009368 \tabularnewline
7 & 0.172826 & 1.3498 & 0.091032 \tabularnewline
8 & -0.016577 & -0.1295 & 0.448707 \tabularnewline
9 & -0.095706 & -0.7475 & 0.228821 \tabularnewline
10 & -0.292391 & -2.2836 & 0.012944 \tabularnewline
11 & -0.007335 & -0.0573 & 0.47725 \tabularnewline
12 & 0.42662 & 3.332 & 0.000734 \tabularnewline
13 & -0.055862 & -0.4363 & 0.332082 \tabularnewline
14 & -0.265195 & -2.0712 & 0.021287 \tabularnewline
15 & -0.214449 & -1.6749 & 0.049537 \tabularnewline
16 & -0.138002 & -1.0778 & 0.142676 \tabularnewline
17 & 0.039369 & 0.3075 & 0.379762 \tabularnewline
18 & 0.005935 & 0.0464 & 0.48159 \tabularnewline
19 & 0.002193 & 0.0171 & 0.493196 \tabularnewline
20 & -0.151769 & -1.1854 & 0.120237 \tabularnewline
21 & -0.215484 & -1.683 & 0.048745 \tabularnewline
22 & -0.260895 & -2.0377 & 0.022964 \tabularnewline
23 & -0.073897 & -0.5772 & 0.282979 \tabularnewline
24 & 0.23609 & 1.8439 & 0.035026 \tabularnewline
25 & -0.05752 & -0.4492 & 0.327422 \tabularnewline
26 & -0.275686 & -2.1532 & 0.017634 \tabularnewline
27 & -0.194924 & -1.5224 & 0.066538 \tabularnewline
28 & -0.107866 & -0.8425 & 0.20141 \tabularnewline
29 & -0.021398 & -0.1671 & 0.433914 \tabularnewline
30 & -0.003125 & -0.0244 & 0.490305 \tabularnewline
31 & -0.012369 & -0.0966 & 0.461678 \tabularnewline
32 & -0.148017 & -1.1561 & 0.126084 \tabularnewline
33 & -0.160928 & -1.2569 & 0.106793 \tabularnewline
34 & -0.131822 & -1.0296 & 0.15364 \tabularnewline
35 & -0.080086 & -0.6255 & 0.26699 \tabularnewline
36 & 0.185416 & 1.4481 & 0.076348 \tabularnewline
37 & 0.012261 & 0.0958 & 0.462012 \tabularnewline
38 & -0.178901 & -1.3973 & 0.083698 \tabularnewline
39 & -0.057859 & -0.4519 & 0.326476 \tabularnewline
40 & -0.009721 & -0.0759 & 0.469865 \tabularnewline
41 & 0.014077 & 0.1099 & 0.456406 \tabularnewline
42 & 0.12008 & 0.9379 & 0.176009 \tabularnewline
43 & 0.065227 & 0.5094 & 0.30614 \tabularnewline
44 & -0.0252 & -0.1968 & 0.422312 \tabularnewline
45 & 0.052783 & 0.4122 & 0.340801 \tabularnewline
46 & 0.004483 & 0.035 & 0.486092 \tabularnewline
47 & 0.055537 & 0.4338 & 0.332998 \tabularnewline
48 & 0.216634 & 1.692 & 0.047877 \tabularnewline
49 & 0.080492 & 0.6287 & 0.265958 \tabularnewline
50 & 0.006645 & 0.0519 & 0.47939 \tabularnewline
51 & 0.03396 & 0.2652 & 0.395861 \tabularnewline
52 & 0.000412 & 0.0032 & 0.498721 \tabularnewline
53 & 0.024199 & 0.189 & 0.425361 \tabularnewline
54 & 0.053167 & 0.4152 & 0.33971 \tabularnewline
55 & 0.008381 & 0.0655 & 0.474013 \tabularnewline
56 & -0.01334 & -0.1042 & 0.458681 \tabularnewline
57 & -0.024543 & -0.1917 & 0.424311 \tabularnewline
58 & -0.054664 & -0.4269 & 0.335462 \tabularnewline
59 & -0.027045 & -0.2112 & 0.416708 \tabularnewline
60 & -5.7e-05 & -4e-04 & 0.499822 \tabularnewline
\hline
\end{tabular}
%Source: https://freestatistics.org/blog/index.php?pk=70156&T=1

[TABLE]
[ROW][C]Autocorrelation Function[/C][/ROW]
[ROW][C]Time lag k[/C][C]ACF(k)[/C][C]T-STAT[/C][C]P-value[/C][/ROW]
[ROW][C]1[/C][C]0.254465[/C][C]1.9874[/C][C]0.025684[/C][/ROW]
[ROW][C]2[/C][C]0.005223[/C][C]0.0408[/C][C]0.483796[/C][/ROW]
[ROW][C]3[/C][C]0.145657[/C][C]1.1376[/C][C]0.129865[/C][/ROW]
[ROW][C]4[/C][C]0.059413[/C][C]0.464[/C][C]0.322138[/C][/ROW]
[ROW][C]5[/C][C]0.281848[/C][C]2.2013[/C][C]0.015754[/C][/ROW]
[ROW][C]6[/C][C]0.30924[/C][C]2.4152[/C][C]0.009368[/C][/ROW]
[ROW][C]7[/C][C]0.172826[/C][C]1.3498[/C][C]0.091032[/C][/ROW]
[ROW][C]8[/C][C]-0.016577[/C][C]-0.1295[/C][C]0.448707[/C][/ROW]
[ROW][C]9[/C][C]-0.095706[/C][C]-0.7475[/C][C]0.228821[/C][/ROW]
[ROW][C]10[/C][C]-0.292391[/C][C]-2.2836[/C][C]0.012944[/C][/ROW]
[ROW][C]11[/C][C]-0.007335[/C][C]-0.0573[/C][C]0.47725[/C][/ROW]
[ROW][C]12[/C][C]0.42662[/C][C]3.332[/C][C]0.000734[/C][/ROW]
[ROW][C]13[/C][C]-0.055862[/C][C]-0.4363[/C][C]0.332082[/C][/ROW]
[ROW][C]14[/C][C]-0.265195[/C][C]-2.0712[/C][C]0.021287[/C][/ROW]
[ROW][C]15[/C][C]-0.214449[/C][C]-1.6749[/C][C]0.049537[/C][/ROW]
[ROW][C]16[/C][C]-0.138002[/C][C]-1.0778[/C][C]0.142676[/C][/ROW]
[ROW][C]17[/C][C]0.039369[/C][C]0.3075[/C][C]0.379762[/C][/ROW]
[ROW][C]18[/C][C]0.005935[/C][C]0.0464[/C][C]0.48159[/C][/ROW]
[ROW][C]19[/C][C]0.002193[/C][C]0.0171[/C][C]0.493196[/C][/ROW]
[ROW][C]20[/C][C]-0.151769[/C][C]-1.1854[/C][C]0.120237[/C][/ROW]
[ROW][C]21[/C][C]-0.215484[/C][C]-1.683[/C][C]0.048745[/C][/ROW]
[ROW][C]22[/C][C]-0.260895[/C][C]-2.0377[/C][C]0.022964[/C][/ROW]
[ROW][C]23[/C][C]-0.073897[/C][C]-0.5772[/C][C]0.282979[/C][/ROW]
[ROW][C]24[/C][C]0.23609[/C][C]1.8439[/C][C]0.035026[/C][/ROW]
[ROW][C]25[/C][C]-0.05752[/C][C]-0.4492[/C][C]0.327422[/C][/ROW]
[ROW][C]26[/C][C]-0.275686[/C][C]-2.1532[/C][C]0.017634[/C][/ROW]
[ROW][C]27[/C][C]-0.194924[/C][C]-1.5224[/C][C]0.066538[/C][/ROW]
[ROW][C]28[/C][C]-0.107866[/C][C]-0.8425[/C][C]0.20141[/C][/ROW]
[ROW][C]29[/C][C]-0.021398[/C][C]-0.1671[/C][C]0.433914[/C][/ROW]
[ROW][C]30[/C][C]-0.003125[/C][C]-0.0244[/C][C]0.490305[/C][/ROW]
[ROW][C]31[/C][C]-0.012369[/C][C]-0.0966[/C][C]0.461678[/C][/ROW]
[ROW][C]32[/C][C]-0.148017[/C][C]-1.1561[/C][C]0.126084[/C][/ROW]
[ROW][C]33[/C][C]-0.160928[/C][C]-1.2569[/C][C]0.106793[/C][/ROW]
[ROW][C]34[/C][C]-0.131822[/C][C]-1.0296[/C][C]0.15364[/C][/ROW]
[ROW][C]35[/C][C]-0.080086[/C][C]-0.6255[/C][C]0.26699[/C][/ROW]
[ROW][C]36[/C][C]0.185416[/C][C]1.4481[/C][C]0.076348[/C][/ROW]
[ROW][C]37[/C][C]0.012261[/C][C]0.0958[/C][C]0.462012[/C][/ROW]
[ROW][C]38[/C][C]-0.178901[/C][C]-1.3973[/C][C]0.083698[/C][/ROW]
[ROW][C]39[/C][C]-0.057859[/C][C]-0.4519[/C][C]0.326476[/C][/ROW]
[ROW][C]40[/C][C]-0.009721[/C][C]-0.0759[/C][C]0.469865[/C][/ROW]
[ROW][C]41[/C][C]0.014077[/C][C]0.1099[/C][C]0.456406[/C][/ROW]
[ROW][C]42[/C][C]0.12008[/C][C]0.9379[/C][C]0.176009[/C][/ROW]
[ROW][C]43[/C][C]0.065227[/C][C]0.5094[/C][C]0.30614[/C][/ROW]
[ROW][C]44[/C][C]-0.0252[/C][C]-0.1968[/C][C]0.422312[/C][/ROW]
[ROW][C]45[/C][C]0.052783[/C][C]0.4122[/C][C]0.340801[/C][/ROW]
[ROW][C]46[/C][C]0.004483[/C][C]0.035[/C][C]0.486092[/C][/ROW]
[ROW][C]47[/C][C]0.055537[/C][C]0.4338[/C][C]0.332998[/C][/ROW]
[ROW][C]48[/C][C]0.216634[/C][C]1.692[/C][C]0.047877[/C][/ROW]
[ROW][C]49[/C][C]0.080492[/C][C]0.6287[/C][C]0.265958[/C][/ROW]
[ROW][C]50[/C][C]0.006645[/C][C]0.0519[/C][C]0.47939[/C][/ROW]
[ROW][C]51[/C][C]0.03396[/C][C]0.2652[/C][C]0.395861[/C][/ROW]
[ROW][C]52[/C][C]0.000412[/C][C]0.0032[/C][C]0.498721[/C][/ROW]
[ROW][C]53[/C][C]0.024199[/C][C]0.189[/C][C]0.425361[/C][/ROW]
[ROW][C]54[/C][C]0.053167[/C][C]0.4152[/C][C]0.33971[/C][/ROW]
[ROW][C]55[/C][C]0.008381[/C][C]0.0655[/C][C]0.474013[/C][/ROW]
[ROW][C]56[/C][C]-0.01334[/C][C]-0.1042[/C][C]0.458681[/C][/ROW]
[ROW][C]57[/C][C]-0.024543[/C][C]-0.1917[/C][C]0.424311[/C][/ROW]
[ROW][C]58[/C][C]-0.054664[/C][C]-0.4269[/C][C]0.335462[/C][/ROW]
[ROW][C]59[/C][C]-0.027045[/C][C]-0.2112[/C][C]0.416708[/C][/ROW]
[ROW][C]60[/C][C]-5.7e-05[/C][C]-4e-04[/C][C]0.499822[/C][/ROW]
[/TABLE]
Source: https://freestatistics.org/blog/index.php?pk=70156&T=1

Globally Unique Identifier (entire table): ba.freestatistics.org/blog/index.php?pk=70156&T=1

As an alternative you can also use a QR Code:  

The GUIDs for individual cells are displayed in the table below:

Autocorrelation Function
Time lag kACF(k)T-STATP-value
10.2544651.98740.025684
20.0052230.04080.483796
30.1456571.13760.129865
40.0594130.4640.322138
50.2818482.20130.015754
60.309242.41520.009368
70.1728261.34980.091032
8-0.016577-0.12950.448707
9-0.095706-0.74750.228821
10-0.292391-2.28360.012944
11-0.007335-0.05730.47725
120.426623.3320.000734
13-0.055862-0.43630.332082
14-0.265195-2.07120.021287
15-0.214449-1.67490.049537
16-0.138002-1.07780.142676
170.0393690.30750.379762
180.0059350.04640.48159
190.0021930.01710.493196
20-0.151769-1.18540.120237
21-0.215484-1.6830.048745
22-0.260895-2.03770.022964
23-0.073897-0.57720.282979
240.236091.84390.035026
25-0.05752-0.44920.327422
26-0.275686-2.15320.017634
27-0.194924-1.52240.066538
28-0.107866-0.84250.20141
29-0.021398-0.16710.433914
30-0.003125-0.02440.490305
31-0.012369-0.09660.461678
32-0.148017-1.15610.126084
33-0.160928-1.25690.106793
34-0.131822-1.02960.15364
35-0.080086-0.62550.26699
360.1854161.44810.076348
370.0122610.09580.462012
38-0.178901-1.39730.083698
39-0.057859-0.45190.326476
40-0.009721-0.07590.469865
410.0140770.10990.456406
420.120080.93790.176009
430.0652270.50940.30614
44-0.0252-0.19680.422312
450.0527830.41220.340801
460.0044830.0350.486092
470.0555370.43380.332998
480.2166341.6920.047877
490.0804920.62870.265958
500.0066450.05190.47939
510.033960.26520.395861
520.0004120.00320.498721
530.0241990.1890.425361
540.0531670.41520.33971
550.0083810.06550.474013
56-0.01334-0.10420.458681
57-0.024543-0.19170.424311
58-0.054664-0.42690.335462
59-0.027045-0.21120.416708
60-5.7e-05-4e-040.499822


Partial Autocorrelation Function
Time lag kPACF(k)T-STATP-value
10.2544651.98740.025684
2-0.063651-0.49710.310442
30.1722461.34530.091757
4-0.027508-0.21480.415303
50.3182212.48540.007849
60.1532261.19670.11802
70.1284141.00290.159925
8-0.156151-1.21960.113659
9-0.122063-0.95330.17209
10-0.493977-3.85810.000139
110.0156690.12240.451499
120.4115313.21420.001046
13-0.078073-0.60980.272141
14-0.175057-1.36720.088284
15-0.108901-0.85050.199174
160.1913171.49420.070135
17-0.000241-0.00190.499251
18-0.203348-1.58820.058706
19-0.033288-0.260.397874
20-0.089243-0.6970.244223
210.0224260.17520.430769
220.0545340.42590.335831
23-0.074172-0.57930.282259
24-0.075765-0.59170.278105
25-0.025574-0.19970.421175
260.0207620.16220.43586
270.0498870.38960.349085
28-0.167436-1.30770.097939
29-0.145946-1.13990.129397
30-0.001582-0.01240.49509
310.0462620.36130.359555
32-0.054554-0.42610.335774
33-0.082385-0.64340.261173
340.1045170.81630.208752
35-0.098169-0.76670.223101
36-0.012567-0.09810.461068
370.0298490.23310.408223
380.0090440.07060.471961
39-0.062104-0.4850.31469
40-0.050588-0.39510.347071
41-0.075213-0.58740.279541
420.1111640.86820.194339
43-0.064011-0.49990.309458
440.0555110.43360.333072
450.0803620.62770.266288
46-0.045595-0.35610.361494
470.0470580.36750.357245
48-0.045611-0.35620.361447
49-0.023231-0.18140.428313
50-0.020651-0.16130.4362
51-0.137281-1.07220.143927
52-0.058143-0.45410.32568
53-0.096196-0.75130.227677
54-0.084088-0.65670.256907
550.0415730.32470.373262
560.0891030.69590.244563
57-0.028388-0.22170.412637
58-0.024944-0.19480.423092
590.0102990.08040.468075
600.0213290.16660.434125

\begin{tabular}{lllllllll}
\hline
Partial Autocorrelation Function \tabularnewline
Time lag k & PACF(k) & T-STAT & P-value \tabularnewline
1 & 0.254465 & 1.9874 & 0.025684 \tabularnewline
2 & -0.063651 & -0.4971 & 0.310442 \tabularnewline
3 & 0.172246 & 1.3453 & 0.091757 \tabularnewline
4 & -0.027508 & -0.2148 & 0.415303 \tabularnewline
5 & 0.318221 & 2.4854 & 0.007849 \tabularnewline
6 & 0.153226 & 1.1967 & 0.11802 \tabularnewline
7 & 0.128414 & 1.0029 & 0.159925 \tabularnewline
8 & -0.156151 & -1.2196 & 0.113659 \tabularnewline
9 & -0.122063 & -0.9533 & 0.17209 \tabularnewline
10 & -0.493977 & -3.8581 & 0.000139 \tabularnewline
11 & 0.015669 & 0.1224 & 0.451499 \tabularnewline
12 & 0.411531 & 3.2142 & 0.001046 \tabularnewline
13 & -0.078073 & -0.6098 & 0.272141 \tabularnewline
14 & -0.175057 & -1.3672 & 0.088284 \tabularnewline
15 & -0.108901 & -0.8505 & 0.199174 \tabularnewline
16 & 0.191317 & 1.4942 & 0.070135 \tabularnewline
17 & -0.000241 & -0.0019 & 0.499251 \tabularnewline
18 & -0.203348 & -1.5882 & 0.058706 \tabularnewline
19 & -0.033288 & -0.26 & 0.397874 \tabularnewline
20 & -0.089243 & -0.697 & 0.244223 \tabularnewline
21 & 0.022426 & 0.1752 & 0.430769 \tabularnewline
22 & 0.054534 & 0.4259 & 0.335831 \tabularnewline
23 & -0.074172 & -0.5793 & 0.282259 \tabularnewline
24 & -0.075765 & -0.5917 & 0.278105 \tabularnewline
25 & -0.025574 & -0.1997 & 0.421175 \tabularnewline
26 & 0.020762 & 0.1622 & 0.43586 \tabularnewline
27 & 0.049887 & 0.3896 & 0.349085 \tabularnewline
28 & -0.167436 & -1.3077 & 0.097939 \tabularnewline
29 & -0.145946 & -1.1399 & 0.129397 \tabularnewline
30 & -0.001582 & -0.0124 & 0.49509 \tabularnewline
31 & 0.046262 & 0.3613 & 0.359555 \tabularnewline
32 & -0.054554 & -0.4261 & 0.335774 \tabularnewline
33 & -0.082385 & -0.6434 & 0.261173 \tabularnewline
34 & 0.104517 & 0.8163 & 0.208752 \tabularnewline
35 & -0.098169 & -0.7667 & 0.223101 \tabularnewline
36 & -0.012567 & -0.0981 & 0.461068 \tabularnewline
37 & 0.029849 & 0.2331 & 0.408223 \tabularnewline
38 & 0.009044 & 0.0706 & 0.471961 \tabularnewline
39 & -0.062104 & -0.485 & 0.31469 \tabularnewline
40 & -0.050588 & -0.3951 & 0.347071 \tabularnewline
41 & -0.075213 & -0.5874 & 0.279541 \tabularnewline
42 & 0.111164 & 0.8682 & 0.194339 \tabularnewline
43 & -0.064011 & -0.4999 & 0.309458 \tabularnewline
44 & 0.055511 & 0.4336 & 0.333072 \tabularnewline
45 & 0.080362 & 0.6277 & 0.266288 \tabularnewline
46 & -0.045595 & -0.3561 & 0.361494 \tabularnewline
47 & 0.047058 & 0.3675 & 0.357245 \tabularnewline
48 & -0.045611 & -0.3562 & 0.361447 \tabularnewline
49 & -0.023231 & -0.1814 & 0.428313 \tabularnewline
50 & -0.020651 & -0.1613 & 0.4362 \tabularnewline
51 & -0.137281 & -1.0722 & 0.143927 \tabularnewline
52 & -0.058143 & -0.4541 & 0.32568 \tabularnewline
53 & -0.096196 & -0.7513 & 0.227677 \tabularnewline
54 & -0.084088 & -0.6567 & 0.256907 \tabularnewline
55 & 0.041573 & 0.3247 & 0.373262 \tabularnewline
56 & 0.089103 & 0.6959 & 0.244563 \tabularnewline
57 & -0.028388 & -0.2217 & 0.412637 \tabularnewline
58 & -0.024944 & -0.1948 & 0.423092 \tabularnewline
59 & 0.010299 & 0.0804 & 0.468075 \tabularnewline
60 & 0.021329 & 0.1666 & 0.434125 \tabularnewline
\hline
\end{tabular}
%Source: https://freestatistics.org/blog/index.php?pk=70156&T=2

[TABLE]
[ROW][C]Partial Autocorrelation Function[/C][/ROW]
[ROW][C]Time lag k[/C][C]PACF(k)[/C][C]T-STAT[/C][C]P-value[/C][/ROW]
[ROW][C]1[/C][C]0.254465[/C][C]1.9874[/C][C]0.025684[/C][/ROW]
[ROW][C]2[/C][C]-0.063651[/C][C]-0.4971[/C][C]0.310442[/C][/ROW]
[ROW][C]3[/C][C]0.172246[/C][C]1.3453[/C][C]0.091757[/C][/ROW]
[ROW][C]4[/C][C]-0.027508[/C][C]-0.2148[/C][C]0.415303[/C][/ROW]
[ROW][C]5[/C][C]0.318221[/C][C]2.4854[/C][C]0.007849[/C][/ROW]
[ROW][C]6[/C][C]0.153226[/C][C]1.1967[/C][C]0.11802[/C][/ROW]
[ROW][C]7[/C][C]0.128414[/C][C]1.0029[/C][C]0.159925[/C][/ROW]
[ROW][C]8[/C][C]-0.156151[/C][C]-1.2196[/C][C]0.113659[/C][/ROW]
[ROW][C]9[/C][C]-0.122063[/C][C]-0.9533[/C][C]0.17209[/C][/ROW]
[ROW][C]10[/C][C]-0.493977[/C][C]-3.8581[/C][C]0.000139[/C][/ROW]
[ROW][C]11[/C][C]0.015669[/C][C]0.1224[/C][C]0.451499[/C][/ROW]
[ROW][C]12[/C][C]0.411531[/C][C]3.2142[/C][C]0.001046[/C][/ROW]
[ROW][C]13[/C][C]-0.078073[/C][C]-0.6098[/C][C]0.272141[/C][/ROW]
[ROW][C]14[/C][C]-0.175057[/C][C]-1.3672[/C][C]0.088284[/C][/ROW]
[ROW][C]15[/C][C]-0.108901[/C][C]-0.8505[/C][C]0.199174[/C][/ROW]
[ROW][C]16[/C][C]0.191317[/C][C]1.4942[/C][C]0.070135[/C][/ROW]
[ROW][C]17[/C][C]-0.000241[/C][C]-0.0019[/C][C]0.499251[/C][/ROW]
[ROW][C]18[/C][C]-0.203348[/C][C]-1.5882[/C][C]0.058706[/C][/ROW]
[ROW][C]19[/C][C]-0.033288[/C][C]-0.26[/C][C]0.397874[/C][/ROW]
[ROW][C]20[/C][C]-0.089243[/C][C]-0.697[/C][C]0.244223[/C][/ROW]
[ROW][C]21[/C][C]0.022426[/C][C]0.1752[/C][C]0.430769[/C][/ROW]
[ROW][C]22[/C][C]0.054534[/C][C]0.4259[/C][C]0.335831[/C][/ROW]
[ROW][C]23[/C][C]-0.074172[/C][C]-0.5793[/C][C]0.282259[/C][/ROW]
[ROW][C]24[/C][C]-0.075765[/C][C]-0.5917[/C][C]0.278105[/C][/ROW]
[ROW][C]25[/C][C]-0.025574[/C][C]-0.1997[/C][C]0.421175[/C][/ROW]
[ROW][C]26[/C][C]0.020762[/C][C]0.1622[/C][C]0.43586[/C][/ROW]
[ROW][C]27[/C][C]0.049887[/C][C]0.3896[/C][C]0.349085[/C][/ROW]
[ROW][C]28[/C][C]-0.167436[/C][C]-1.3077[/C][C]0.097939[/C][/ROW]
[ROW][C]29[/C][C]-0.145946[/C][C]-1.1399[/C][C]0.129397[/C][/ROW]
[ROW][C]30[/C][C]-0.001582[/C][C]-0.0124[/C][C]0.49509[/C][/ROW]
[ROW][C]31[/C][C]0.046262[/C][C]0.3613[/C][C]0.359555[/C][/ROW]
[ROW][C]32[/C][C]-0.054554[/C][C]-0.4261[/C][C]0.335774[/C][/ROW]
[ROW][C]33[/C][C]-0.082385[/C][C]-0.6434[/C][C]0.261173[/C][/ROW]
[ROW][C]34[/C][C]0.104517[/C][C]0.8163[/C][C]0.208752[/C][/ROW]
[ROW][C]35[/C][C]-0.098169[/C][C]-0.7667[/C][C]0.223101[/C][/ROW]
[ROW][C]36[/C][C]-0.012567[/C][C]-0.0981[/C][C]0.461068[/C][/ROW]
[ROW][C]37[/C][C]0.029849[/C][C]0.2331[/C][C]0.408223[/C][/ROW]
[ROW][C]38[/C][C]0.009044[/C][C]0.0706[/C][C]0.471961[/C][/ROW]
[ROW][C]39[/C][C]-0.062104[/C][C]-0.485[/C][C]0.31469[/C][/ROW]
[ROW][C]40[/C][C]-0.050588[/C][C]-0.3951[/C][C]0.347071[/C][/ROW]
[ROW][C]41[/C][C]-0.075213[/C][C]-0.5874[/C][C]0.279541[/C][/ROW]
[ROW][C]42[/C][C]0.111164[/C][C]0.8682[/C][C]0.194339[/C][/ROW]
[ROW][C]43[/C][C]-0.064011[/C][C]-0.4999[/C][C]0.309458[/C][/ROW]
[ROW][C]44[/C][C]0.055511[/C][C]0.4336[/C][C]0.333072[/C][/ROW]
[ROW][C]45[/C][C]0.080362[/C][C]0.6277[/C][C]0.266288[/C][/ROW]
[ROW][C]46[/C][C]-0.045595[/C][C]-0.3561[/C][C]0.361494[/C][/ROW]
[ROW][C]47[/C][C]0.047058[/C][C]0.3675[/C][C]0.357245[/C][/ROW]
[ROW][C]48[/C][C]-0.045611[/C][C]-0.3562[/C][C]0.361447[/C][/ROW]
[ROW][C]49[/C][C]-0.023231[/C][C]-0.1814[/C][C]0.428313[/C][/ROW]
[ROW][C]50[/C][C]-0.020651[/C][C]-0.1613[/C][C]0.4362[/C][/ROW]
[ROW][C]51[/C][C]-0.137281[/C][C]-1.0722[/C][C]0.143927[/C][/ROW]
[ROW][C]52[/C][C]-0.058143[/C][C]-0.4541[/C][C]0.32568[/C][/ROW]
[ROW][C]53[/C][C]-0.096196[/C][C]-0.7513[/C][C]0.227677[/C][/ROW]
[ROW][C]54[/C][C]-0.084088[/C][C]-0.6567[/C][C]0.256907[/C][/ROW]
[ROW][C]55[/C][C]0.041573[/C][C]0.3247[/C][C]0.373262[/C][/ROW]
[ROW][C]56[/C][C]0.089103[/C][C]0.6959[/C][C]0.244563[/C][/ROW]
[ROW][C]57[/C][C]-0.028388[/C][C]-0.2217[/C][C]0.412637[/C][/ROW]
[ROW][C]58[/C][C]-0.024944[/C][C]-0.1948[/C][C]0.423092[/C][/ROW]
[ROW][C]59[/C][C]0.010299[/C][C]0.0804[/C][C]0.468075[/C][/ROW]
[ROW][C]60[/C][C]0.021329[/C][C]0.1666[/C][C]0.434125[/C][/ROW]
[/TABLE]
Source: https://freestatistics.org/blog/index.php?pk=70156&T=2

Globally Unique Identifier (entire table): ba.freestatistics.org/blog/index.php?pk=70156&T=2

As an alternative you can also use a QR Code:  

The GUIDs for individual cells are displayed in the table below:

Partial Autocorrelation Function
Time lag kPACF(k)T-STATP-value
10.2544651.98740.025684
2-0.063651-0.49710.310442
30.1722461.34530.091757
4-0.027508-0.21480.415303
50.3182212.48540.007849
60.1532261.19670.11802
70.1284141.00290.159925
8-0.156151-1.21960.113659
9-0.122063-0.95330.17209
10-0.493977-3.85810.000139
110.0156690.12240.451499
120.4115313.21420.001046
13-0.078073-0.60980.272141
14-0.175057-1.36720.088284
15-0.108901-0.85050.199174
160.1913171.49420.070135
17-0.000241-0.00190.499251
18-0.203348-1.58820.058706
19-0.033288-0.260.397874
20-0.089243-0.6970.244223
210.0224260.17520.430769
220.0545340.42590.335831
23-0.074172-0.57930.282259
24-0.075765-0.59170.278105
25-0.025574-0.19970.421175
260.0207620.16220.43586
270.0498870.38960.349085
28-0.167436-1.30770.097939
29-0.145946-1.13990.129397
30-0.001582-0.01240.49509
310.0462620.36130.359555
32-0.054554-0.42610.335774
33-0.082385-0.64340.261173
340.1045170.81630.208752
35-0.098169-0.76670.223101
36-0.012567-0.09810.461068
370.0298490.23310.408223
380.0090440.07060.471961
39-0.062104-0.4850.31469
40-0.050588-0.39510.347071
41-0.075213-0.58740.279541
420.1111640.86820.194339
43-0.064011-0.49990.309458
440.0555110.43360.333072
450.0803620.62770.266288
46-0.045595-0.35610.361494
470.0470580.36750.357245
48-0.045611-0.35620.361447
49-0.023231-0.18140.428313
50-0.020651-0.16130.4362
51-0.137281-1.07220.143927
52-0.058143-0.45410.32568
53-0.096196-0.75130.227677
54-0.084088-0.65670.256907
550.0415730.32470.373262
560.0891030.69590.244563
57-0.028388-0.22170.412637
58-0.024944-0.19480.423092
590.0102990.08040.468075
600.0213290.16660.434125


Parameters (Session):
par1 = 60 ; par2 = 1 ; par3 = 0 ; par4 = 0 ; par5 = 12 ; par6 = MA ; par7 = 0.95 ;
Parameters (R input):
par1 = 60 ; par2 = 1 ; par3 = 0 ; par4 = 0 ; par5 = 12 ; par6 = MA ; par7 = 0.95 ;
R code (references can be found in the software module):
if (par1 == 'Default') {
par1 = 10*log10(length(x))
} else {
par1 <- as.numeric(par1)
}
par2 <- as.numeric(par2)
par3 <- as.numeric(par3)
par4 <- as.numeric(par4)
par5 <- as.numeric(par5)
if (par6 == 'White Noise') par6 <- 'white' else par6 <- 'ma'
par7 <- as.numeric(par7)
if (par2 == 0) {
x <- log(x)
} else {
x <- (x ^ par2 - 1) / par2
}
if (par3 > 0) x <- diff(x,lag=1,difference=par3)
if (par4 > 0) x <- diff(x,lag=par5,difference=par4)
bitmap(file='pic1.png')
racf <- acf(x, par1, main='Autocorrelation', xlab='time lag', ylab='ACF', ci.type=par6, ci=par7, sub=paste('(lambda=',par2,', d=',par3,', D=',par4,', CI=', par7, ', CI type=',par6,')',sep=''))
dev.off()
bitmap(file='pic2.png')
rpacf <- pacf(x,par1,main='Partial Autocorrelation',xlab='lags',ylab='PACF')
dev.off()
(myacf <- c(racf$acf))
(mypacf <- c(rpacf$acf))
lengthx <- length(x)
sqrtn <- sqrt(lengthx)
load(file='createtable')
a<-table.start()
a<-table.row.start(a)
a<-table.element(a,'Autocorrelation Function',4,TRUE)
a<-table.row.end(a)
a<-table.row.start(a)
a<-table.element(a,'Time lag k',header=TRUE)
a<-table.element(a,hyperlink('basics.htm','ACF(k)','click here for more information about the Autocorrelation Function'),header=TRUE)
a<-table.element(a,'T-STAT',header=TRUE)
a<-table.element(a,'P-value',header=TRUE)
a<-table.row.end(a)
for (i in 2:(par1+1)) {
a<-table.row.start(a)
a<-table.element(a,i-1,header=TRUE)
a<-table.element(a,round(myacf[i],6))
mytstat <- myacf[i]*sqrtn
a<-table.element(a,round(mytstat,4))
a<-table.element(a,round(1-pt(abs(mytstat),lengthx),6))
a<-table.row.end(a)
}
a<-table.end(a)
table.save(a,file='mytable.tab')
a<-table.start()
a<-table.row.start(a)
a<-table.element(a,'Partial Autocorrelation Function',4,TRUE)
a<-table.row.end(a)
a<-table.row.start(a)
a<-table.element(a,'Time lag k',header=TRUE)
a<-table.element(a,hyperlink('basics.htm','PACF(k)','click here for more information about the Partial Autocorrelation Function'),header=TRUE)
a<-table.element(a,'T-STAT',header=TRUE)
a<-table.element(a,'P-value',header=TRUE)
a<-table.row.end(a)
for (i in 1:par1) {
a<-table.row.start(a)
a<-table.element(a,i,header=TRUE)
a<-table.element(a,round(mypacf[i],6))
mytstat <- mypacf[i]*sqrtn
a<-table.element(a,round(mytstat,4))
a<-table.element(a,round(1-pt(abs(mytstat),lengthx),6))
a<-table.row.end(a)
}
a<-table.end(a)
table.save(a,file='mytable1.tab')