Free Statistics

of Irreproducible Research!

Author's title

Author*The author of this computation has been verified*
R Software Modulerwasp_autocorrelation.wasp
Title produced by software(Partial) Autocorrelation Function
Date of computationMon, 21 Dec 2009 06:26:58 -0700
Cite this page as followsStatistical Computations at FreeStatistics.org, Office for Research Development and Education, URL https://freestatistics.org/blog/index.php?v=date/2009/Dec/21/t12614021772114v8rizgoata5.htm/, Retrieved Sun, 05 May 2024 14:46:19 +0000
Statistical Computations at FreeStatistics.org, Office for Research Development and Education, URL https://freestatistics.org/blog/index.php?pk=70152, Retrieved Sun, 05 May 2024 14:46:19 +0000
QR Codes:

Original text written by user:
IsPrivate?No (this computation is public)
User-defined keywords
Estimated Impact97
Family? (F = Feedback message, R = changed R code, M = changed R Module, P = changed Parameters, D = changed Data)
-       [(Partial) Autocorrelation Function] [AC JDB] [2009-12-21 13:26:58] [d41d8cd98f00b204e9800998ecf8427e] [Current]
Feedback Forum

Post a new message
Dataseries X:
102.9
105.9
117.6
113.6
115.9
118.9
77.6
81.2
123.1
136.6
112.1
95.1
96.3
105.7
115.8
105.7
105.7
111.1
82.4
60
107.3
99.3
113.5
108.9
100.2
103.9
138.7
120.2
100.2
143.2
70.9
85.2
133
136.6
117.9
106.3
122.3
125.5
148.4
126.3
99.6
140.4
80.3
92.6
138.5
110.9
119.6
105
109
129.4
148.6
101.4
134.8
143.7
81.6
90.3
141.5
140.7
140.2
100.2
125.7
119.6
134.7
109
116.3
146.9
97.4
89.4
132.1
139.8
129
112.5
121.9
121.7
123.1
131.6
119.3
132.5
98.3
85.1
131.7
129.3
90.7
78.6
68.9
79.1
83.5
74.1
59.7
93.3
61.3
56.6
98.5


Summary of computational transaction
Raw Inputview raw input (R code)
Raw Outputview raw output of R engine
Computing time2 seconds
R Server'Gwilym Jenkins' @ 72.249.127.135

\begin{tabular}{lllllllll}
\hline
Summary of computational transaction \tabularnewline
Raw Input & view raw input (R code)  \tabularnewline
Raw Output & view raw output of R engine  \tabularnewline
Computing time & 2 seconds \tabularnewline
R Server & 'Gwilym Jenkins' @ 72.249.127.135 \tabularnewline
\hline
\end{tabular}
%Source: https://freestatistics.org/blog/index.php?pk=70152&T=0

[TABLE]
[ROW][C]Summary of computational transaction[/C][/ROW]
[ROW][C]Raw Input[/C][C]view raw input (R code) [/C][/ROW]
[ROW][C]Raw Output[/C][C]view raw output of R engine [/C][/ROW]
[ROW][C]Computing time[/C][C]2 seconds[/C][/ROW]
[ROW][C]R Server[/C][C]'Gwilym Jenkins' @ 72.249.127.135[/C][/ROW]
[/TABLE]
Source: https://freestatistics.org/blog/index.php?pk=70152&T=0

Globally Unique Identifier (entire table): ba.freestatistics.org/blog/index.php?pk=70152&T=0

As an alternative you can also use a QR Code:  

The GUIDs for individual cells are displayed in the table below:

Summary of computational transaction
Raw Inputview raw input (R code)
Raw Outputview raw output of R engine
Computing time2 seconds
R Server'Gwilym Jenkins' @ 72.249.127.135


Autocorrelation Function
Time lag kACF(k)T-STATP-value
10.3542723.41650.000471
20.0599070.57770.282425
30.2659112.56440.005969
40.2369542.28510.01229
50.2486922.39830.009234
60.2376992.29230.012072
70.1298821.25250.106757
80.0856930.82640.205348
90.0484170.46690.320827
10-0.203253-1.96010.026488
110.0180180.17380.431216
120.4395344.23872.6e-05
13-0.008512-0.08210.467378
14-0.239276-2.30750.011623
15-0.051065-0.49250.311779
16-0.063801-0.61530.269939
17-0.024386-0.23520.407296
18-0.019469-0.18780.425738
19-0.023523-0.22690.410519
20-0.037812-0.36460.358101
21-0.046989-0.45310.325751
22-0.24956-2.40670.009038
23-0.002566-0.02470.490156
240.350033.37560.000538
25-0.047758-0.46060.323094
26-0.274984-2.65190.004706
27-0.089904-0.8670.194085
28-0.063602-0.61340.27057
29-0.051132-0.49310.311553
30-0.069114-0.66650.253369
31-0.058277-0.5620.287733
32-0.091752-0.88480.189266
33-0.111379-1.07410.142779
34-0.212984-2.05390.021394
35-0.086016-0.82950.204469
360.2139192.0630.020952

\begin{tabular}{lllllllll}
\hline
Autocorrelation Function \tabularnewline
Time lag k & ACF(k) & T-STAT & P-value \tabularnewline
1 & 0.354272 & 3.4165 & 0.000471 \tabularnewline
2 & 0.059907 & 0.5777 & 0.282425 \tabularnewline
3 & 0.265911 & 2.5644 & 0.005969 \tabularnewline
4 & 0.236954 & 2.2851 & 0.01229 \tabularnewline
5 & 0.248692 & 2.3983 & 0.009234 \tabularnewline
6 & 0.237699 & 2.2923 & 0.012072 \tabularnewline
7 & 0.129882 & 1.2525 & 0.106757 \tabularnewline
8 & 0.085693 & 0.8264 & 0.205348 \tabularnewline
9 & 0.048417 & 0.4669 & 0.320827 \tabularnewline
10 & -0.203253 & -1.9601 & 0.026488 \tabularnewline
11 & 0.018018 & 0.1738 & 0.431216 \tabularnewline
12 & 0.439534 & 4.2387 & 2.6e-05 \tabularnewline
13 & -0.008512 & -0.0821 & 0.467378 \tabularnewline
14 & -0.239276 & -2.3075 & 0.011623 \tabularnewline
15 & -0.051065 & -0.4925 & 0.311779 \tabularnewline
16 & -0.063801 & -0.6153 & 0.269939 \tabularnewline
17 & -0.024386 & -0.2352 & 0.407296 \tabularnewline
18 & -0.019469 & -0.1878 & 0.425738 \tabularnewline
19 & -0.023523 & -0.2269 & 0.410519 \tabularnewline
20 & -0.037812 & -0.3646 & 0.358101 \tabularnewline
21 & -0.046989 & -0.4531 & 0.325751 \tabularnewline
22 & -0.24956 & -2.4067 & 0.009038 \tabularnewline
23 & -0.002566 & -0.0247 & 0.490156 \tabularnewline
24 & 0.35003 & 3.3756 & 0.000538 \tabularnewline
25 & -0.047758 & -0.4606 & 0.323094 \tabularnewline
26 & -0.274984 & -2.6519 & 0.004706 \tabularnewline
27 & -0.089904 & -0.867 & 0.194085 \tabularnewline
28 & -0.063602 & -0.6134 & 0.27057 \tabularnewline
29 & -0.051132 & -0.4931 & 0.311553 \tabularnewline
30 & -0.069114 & -0.6665 & 0.253369 \tabularnewline
31 & -0.058277 & -0.562 & 0.287733 \tabularnewline
32 & -0.091752 & -0.8848 & 0.189266 \tabularnewline
33 & -0.111379 & -1.0741 & 0.142779 \tabularnewline
34 & -0.212984 & -2.0539 & 0.021394 \tabularnewline
35 & -0.086016 & -0.8295 & 0.204469 \tabularnewline
36 & 0.213919 & 2.063 & 0.020952 \tabularnewline
\hline
\end{tabular}
%Source: https://freestatistics.org/blog/index.php?pk=70152&T=1

[TABLE]
[ROW][C]Autocorrelation Function[/C][/ROW]
[ROW][C]Time lag k[/C][C]ACF(k)[/C][C]T-STAT[/C][C]P-value[/C][/ROW]
[ROW][C]1[/C][C]0.354272[/C][C]3.4165[/C][C]0.000471[/C][/ROW]
[ROW][C]2[/C][C]0.059907[/C][C]0.5777[/C][C]0.282425[/C][/ROW]
[ROW][C]3[/C][C]0.265911[/C][C]2.5644[/C][C]0.005969[/C][/ROW]
[ROW][C]4[/C][C]0.236954[/C][C]2.2851[/C][C]0.01229[/C][/ROW]
[ROW][C]5[/C][C]0.248692[/C][C]2.3983[/C][C]0.009234[/C][/ROW]
[ROW][C]6[/C][C]0.237699[/C][C]2.2923[/C][C]0.012072[/C][/ROW]
[ROW][C]7[/C][C]0.129882[/C][C]1.2525[/C][C]0.106757[/C][/ROW]
[ROW][C]8[/C][C]0.085693[/C][C]0.8264[/C][C]0.205348[/C][/ROW]
[ROW][C]9[/C][C]0.048417[/C][C]0.4669[/C][C]0.320827[/C][/ROW]
[ROW][C]10[/C][C]-0.203253[/C][C]-1.9601[/C][C]0.026488[/C][/ROW]
[ROW][C]11[/C][C]0.018018[/C][C]0.1738[/C][C]0.431216[/C][/ROW]
[ROW][C]12[/C][C]0.439534[/C][C]4.2387[/C][C]2.6e-05[/C][/ROW]
[ROW][C]13[/C][C]-0.008512[/C][C]-0.0821[/C][C]0.467378[/C][/ROW]
[ROW][C]14[/C][C]-0.239276[/C][C]-2.3075[/C][C]0.011623[/C][/ROW]
[ROW][C]15[/C][C]-0.051065[/C][C]-0.4925[/C][C]0.311779[/C][/ROW]
[ROW][C]16[/C][C]-0.063801[/C][C]-0.6153[/C][C]0.269939[/C][/ROW]
[ROW][C]17[/C][C]-0.024386[/C][C]-0.2352[/C][C]0.407296[/C][/ROW]
[ROW][C]18[/C][C]-0.019469[/C][C]-0.1878[/C][C]0.425738[/C][/ROW]
[ROW][C]19[/C][C]-0.023523[/C][C]-0.2269[/C][C]0.410519[/C][/ROW]
[ROW][C]20[/C][C]-0.037812[/C][C]-0.3646[/C][C]0.358101[/C][/ROW]
[ROW][C]21[/C][C]-0.046989[/C][C]-0.4531[/C][C]0.325751[/C][/ROW]
[ROW][C]22[/C][C]-0.24956[/C][C]-2.4067[/C][C]0.009038[/C][/ROW]
[ROW][C]23[/C][C]-0.002566[/C][C]-0.0247[/C][C]0.490156[/C][/ROW]
[ROW][C]24[/C][C]0.35003[/C][C]3.3756[/C][C]0.000538[/C][/ROW]
[ROW][C]25[/C][C]-0.047758[/C][C]-0.4606[/C][C]0.323094[/C][/ROW]
[ROW][C]26[/C][C]-0.274984[/C][C]-2.6519[/C][C]0.004706[/C][/ROW]
[ROW][C]27[/C][C]-0.089904[/C][C]-0.867[/C][C]0.194085[/C][/ROW]
[ROW][C]28[/C][C]-0.063602[/C][C]-0.6134[/C][C]0.27057[/C][/ROW]
[ROW][C]29[/C][C]-0.051132[/C][C]-0.4931[/C][C]0.311553[/C][/ROW]
[ROW][C]30[/C][C]-0.069114[/C][C]-0.6665[/C][C]0.253369[/C][/ROW]
[ROW][C]31[/C][C]-0.058277[/C][C]-0.562[/C][C]0.287733[/C][/ROW]
[ROW][C]32[/C][C]-0.091752[/C][C]-0.8848[/C][C]0.189266[/C][/ROW]
[ROW][C]33[/C][C]-0.111379[/C][C]-1.0741[/C][C]0.142779[/C][/ROW]
[ROW][C]34[/C][C]-0.212984[/C][C]-2.0539[/C][C]0.021394[/C][/ROW]
[ROW][C]35[/C][C]-0.086016[/C][C]-0.8295[/C][C]0.204469[/C][/ROW]
[ROW][C]36[/C][C]0.213919[/C][C]2.063[/C][C]0.020952[/C][/ROW]
[/TABLE]
Source: https://freestatistics.org/blog/index.php?pk=70152&T=1

Globally Unique Identifier (entire table): ba.freestatistics.org/blog/index.php?pk=70152&T=1

As an alternative you can also use a QR Code:  

The GUIDs for individual cells are displayed in the table below:

Autocorrelation Function
Time lag kACF(k)T-STATP-value
10.3542723.41650.000471
20.0599070.57770.282425
30.2659112.56440.005969
40.2369542.28510.01229
50.2486922.39830.009234
60.2376992.29230.012072
70.1298821.25250.106757
80.0856930.82640.205348
90.0484170.46690.320827
10-0.203253-1.96010.026488
110.0180180.17380.431216
120.4395344.23872.6e-05
13-0.008512-0.08210.467378
14-0.239276-2.30750.011623
15-0.051065-0.49250.311779
16-0.063801-0.61530.269939
17-0.024386-0.23520.407296
18-0.019469-0.18780.425738
19-0.023523-0.22690.410519
20-0.037812-0.36460.358101
21-0.046989-0.45310.325751
22-0.24956-2.40670.009038
23-0.002566-0.02470.490156
240.350033.37560.000538
25-0.047758-0.46060.323094
26-0.274984-2.65190.004706
27-0.089904-0.8670.194085
28-0.063602-0.61340.27057
29-0.051132-0.49310.311553
30-0.069114-0.66650.253369
31-0.058277-0.5620.287733
32-0.091752-0.88480.189266
33-0.111379-1.07410.142779
34-0.212984-2.05390.021394
35-0.086016-0.82950.204469
360.2139192.0630.020952


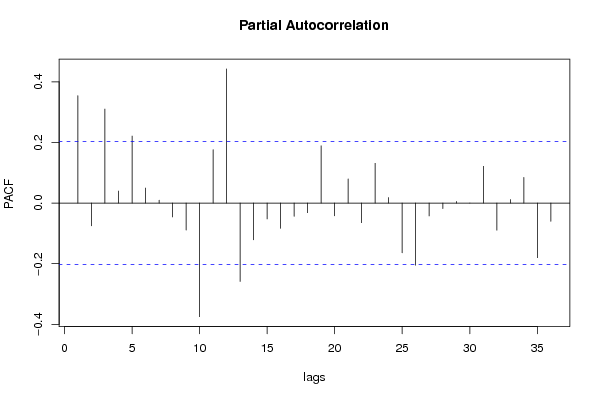
Partial Autocorrelation Function
Time lag kPACF(k)T-STATP-value
10.3542723.41650.000471
2-0.075017-0.72340.235613
30.3101212.99070.001781
40.0396950.38280.351367
50.2210892.13210.017817
60.0498150.48040.316036
70.009580.09240.463293
8-0.045687-0.44060.330266
9-0.08888-0.85710.19679
10-0.374541-3.61190.000246
110.1763381.70050.046186
120.4425954.26822.4e-05
13-0.25829-2.49090.007259
14-0.120978-1.16670.123164
15-0.052129-0.50270.308176
16-0.083038-0.80080.212648
17-0.0437-0.42140.337209
18-0.031786-0.30650.379941
190.1890591.82320.035742
20-0.042054-0.40550.343003
210.0796960.76860.22205
22-0.064519-0.62220.267667
230.1311531.26480.104553
240.0185170.17860.429333
25-0.1641-1.58250.058463
26-0.204977-1.97670.025517
27-0.042141-0.40640.342693
28-0.018103-0.17460.430896
290.0055380.05340.478762
300.0002310.00220.499114
310.1216261.17290.121911
32-0.089373-0.86190.195486
330.0117730.11350.454927
340.0846070.81590.208315
35-0.180095-1.73680.042869
36-0.060019-0.57880.28206

\begin{tabular}{lllllllll}
\hline
Partial Autocorrelation Function \tabularnewline
Time lag k & PACF(k) & T-STAT & P-value \tabularnewline
1 & 0.354272 & 3.4165 & 0.000471 \tabularnewline
2 & -0.075017 & -0.7234 & 0.235613 \tabularnewline
3 & 0.310121 & 2.9907 & 0.001781 \tabularnewline
4 & 0.039695 & 0.3828 & 0.351367 \tabularnewline
5 & 0.221089 & 2.1321 & 0.017817 \tabularnewline
6 & 0.049815 & 0.4804 & 0.316036 \tabularnewline
7 & 0.00958 & 0.0924 & 0.463293 \tabularnewline
8 & -0.045687 & -0.4406 & 0.330266 \tabularnewline
9 & -0.08888 & -0.8571 & 0.19679 \tabularnewline
10 & -0.374541 & -3.6119 & 0.000246 \tabularnewline
11 & 0.176338 & 1.7005 & 0.046186 \tabularnewline
12 & 0.442595 & 4.2682 & 2.4e-05 \tabularnewline
13 & -0.25829 & -2.4909 & 0.007259 \tabularnewline
14 & -0.120978 & -1.1667 & 0.123164 \tabularnewline
15 & -0.052129 & -0.5027 & 0.308176 \tabularnewline
16 & -0.083038 & -0.8008 & 0.212648 \tabularnewline
17 & -0.0437 & -0.4214 & 0.337209 \tabularnewline
18 & -0.031786 & -0.3065 & 0.379941 \tabularnewline
19 & 0.189059 & 1.8232 & 0.035742 \tabularnewline
20 & -0.042054 & -0.4055 & 0.343003 \tabularnewline
21 & 0.079696 & 0.7686 & 0.22205 \tabularnewline
22 & -0.064519 & -0.6222 & 0.267667 \tabularnewline
23 & 0.131153 & 1.2648 & 0.104553 \tabularnewline
24 & 0.018517 & 0.1786 & 0.429333 \tabularnewline
25 & -0.1641 & -1.5825 & 0.058463 \tabularnewline
26 & -0.204977 & -1.9767 & 0.025517 \tabularnewline
27 & -0.042141 & -0.4064 & 0.342693 \tabularnewline
28 & -0.018103 & -0.1746 & 0.430896 \tabularnewline
29 & 0.005538 & 0.0534 & 0.478762 \tabularnewline
30 & 0.000231 & 0.0022 & 0.499114 \tabularnewline
31 & 0.121626 & 1.1729 & 0.121911 \tabularnewline
32 & -0.089373 & -0.8619 & 0.195486 \tabularnewline
33 & 0.011773 & 0.1135 & 0.454927 \tabularnewline
34 & 0.084607 & 0.8159 & 0.208315 \tabularnewline
35 & -0.180095 & -1.7368 & 0.042869 \tabularnewline
36 & -0.060019 & -0.5788 & 0.28206 \tabularnewline
\hline
\end{tabular}
%Source: https://freestatistics.org/blog/index.php?pk=70152&T=2

[TABLE]
[ROW][C]Partial Autocorrelation Function[/C][/ROW]
[ROW][C]Time lag k[/C][C]PACF(k)[/C][C]T-STAT[/C][C]P-value[/C][/ROW]
[ROW][C]1[/C][C]0.354272[/C][C]3.4165[/C][C]0.000471[/C][/ROW]
[ROW][C]2[/C][C]-0.075017[/C][C]-0.7234[/C][C]0.235613[/C][/ROW]
[ROW][C]3[/C][C]0.310121[/C][C]2.9907[/C][C]0.001781[/C][/ROW]
[ROW][C]4[/C][C]0.039695[/C][C]0.3828[/C][C]0.351367[/C][/ROW]
[ROW][C]5[/C][C]0.221089[/C][C]2.1321[/C][C]0.017817[/C][/ROW]
[ROW][C]6[/C][C]0.049815[/C][C]0.4804[/C][C]0.316036[/C][/ROW]
[ROW][C]7[/C][C]0.00958[/C][C]0.0924[/C][C]0.463293[/C][/ROW]
[ROW][C]8[/C][C]-0.045687[/C][C]-0.4406[/C][C]0.330266[/C][/ROW]
[ROW][C]9[/C][C]-0.08888[/C][C]-0.8571[/C][C]0.19679[/C][/ROW]
[ROW][C]10[/C][C]-0.374541[/C][C]-3.6119[/C][C]0.000246[/C][/ROW]
[ROW][C]11[/C][C]0.176338[/C][C]1.7005[/C][C]0.046186[/C][/ROW]
[ROW][C]12[/C][C]0.442595[/C][C]4.2682[/C][C]2.4e-05[/C][/ROW]
[ROW][C]13[/C][C]-0.25829[/C][C]-2.4909[/C][C]0.007259[/C][/ROW]
[ROW][C]14[/C][C]-0.120978[/C][C]-1.1667[/C][C]0.123164[/C][/ROW]
[ROW][C]15[/C][C]-0.052129[/C][C]-0.5027[/C][C]0.308176[/C][/ROW]
[ROW][C]16[/C][C]-0.083038[/C][C]-0.8008[/C][C]0.212648[/C][/ROW]
[ROW][C]17[/C][C]-0.0437[/C][C]-0.4214[/C][C]0.337209[/C][/ROW]
[ROW][C]18[/C][C]-0.031786[/C][C]-0.3065[/C][C]0.379941[/C][/ROW]
[ROW][C]19[/C][C]0.189059[/C][C]1.8232[/C][C]0.035742[/C][/ROW]
[ROW][C]20[/C][C]-0.042054[/C][C]-0.4055[/C][C]0.343003[/C][/ROW]
[ROW][C]21[/C][C]0.079696[/C][C]0.7686[/C][C]0.22205[/C][/ROW]
[ROW][C]22[/C][C]-0.064519[/C][C]-0.6222[/C][C]0.267667[/C][/ROW]
[ROW][C]23[/C][C]0.131153[/C][C]1.2648[/C][C]0.104553[/C][/ROW]
[ROW][C]24[/C][C]0.018517[/C][C]0.1786[/C][C]0.429333[/C][/ROW]
[ROW][C]25[/C][C]-0.1641[/C][C]-1.5825[/C][C]0.058463[/C][/ROW]
[ROW][C]26[/C][C]-0.204977[/C][C]-1.9767[/C][C]0.025517[/C][/ROW]
[ROW][C]27[/C][C]-0.042141[/C][C]-0.4064[/C][C]0.342693[/C][/ROW]
[ROW][C]28[/C][C]-0.018103[/C][C]-0.1746[/C][C]0.430896[/C][/ROW]
[ROW][C]29[/C][C]0.005538[/C][C]0.0534[/C][C]0.478762[/C][/ROW]
[ROW][C]30[/C][C]0.000231[/C][C]0.0022[/C][C]0.499114[/C][/ROW]
[ROW][C]31[/C][C]0.121626[/C][C]1.1729[/C][C]0.121911[/C][/ROW]
[ROW][C]32[/C][C]-0.089373[/C][C]-0.8619[/C][C]0.195486[/C][/ROW]
[ROW][C]33[/C][C]0.011773[/C][C]0.1135[/C][C]0.454927[/C][/ROW]
[ROW][C]34[/C][C]0.084607[/C][C]0.8159[/C][C]0.208315[/C][/ROW]
[ROW][C]35[/C][C]-0.180095[/C][C]-1.7368[/C][C]0.042869[/C][/ROW]
[ROW][C]36[/C][C]-0.060019[/C][C]-0.5788[/C][C]0.28206[/C][/ROW]
[/TABLE]
Source: https://freestatistics.org/blog/index.php?pk=70152&T=2

Globally Unique Identifier (entire table): ba.freestatistics.org/blog/index.php?pk=70152&T=2

As an alternative you can also use a QR Code:  

The GUIDs for individual cells are displayed in the table below:

Partial Autocorrelation Function
Time lag kPACF(k)T-STATP-value
10.3542723.41650.000471
2-0.075017-0.72340.235613
30.3101212.99070.001781
40.0396950.38280.351367
50.2210892.13210.017817
60.0498150.48040.316036
70.009580.09240.463293
8-0.045687-0.44060.330266
9-0.08888-0.85710.19679
10-0.374541-3.61190.000246
110.1763381.70050.046186
120.4425954.26822.4e-05
13-0.25829-2.49090.007259
14-0.120978-1.16670.123164
15-0.052129-0.50270.308176
16-0.083038-0.80080.212648
17-0.0437-0.42140.337209
18-0.031786-0.30650.379941
190.1890591.82320.035742
20-0.042054-0.40550.343003
210.0796960.76860.22205
22-0.064519-0.62220.267667
230.1311531.26480.104553
240.0185170.17860.429333
25-0.1641-1.58250.058463
26-0.204977-1.97670.025517
27-0.042141-0.40640.342693
28-0.018103-0.17460.430896
290.0055380.05340.478762
300.0002310.00220.499114
310.1216261.17290.121911
32-0.089373-0.86190.195486
330.0117730.11350.454927
340.0846070.81590.208315
35-0.180095-1.73680.042869
36-0.060019-0.57880.28206


Parameters (Session):
par1 = 36 ; par2 = 1 ; par3 = 0 ; par4 = 0 ; par5 = 12 ; par6 = White Noise ; par7 = 0.95 ;
Parameters (R input):
par1 = 36 ; par2 = 1 ; par3 = 0 ; par4 = 0 ; par5 = 12 ; par6 = White Noise ; par7 = 0.95 ;
R code (references can be found in the software module):
if (par1 == 'Default') {
par1 = 10*log10(length(x))
} else {
par1 <- as.numeric(par1)
}
par2 <- as.numeric(par2)
par3 <- as.numeric(par3)
par4 <- as.numeric(par4)
par5 <- as.numeric(par5)
if (par6 == 'White Noise') par6 <- 'white' else par6 <- 'ma'
par7 <- as.numeric(par7)
if (par2 == 0) {
x <- log(x)
} else {
x <- (x ^ par2 - 1) / par2
}
if (par3 > 0) x <- diff(x,lag=1,difference=par3)
if (par4 > 0) x <- diff(x,lag=par5,difference=par4)
bitmap(file='pic1.png')
racf <- acf(x, par1, main='Autocorrelation', xlab='time lag', ylab='ACF', ci.type=par6, ci=par7, sub=paste('(lambda=',par2,', d=',par3,', D=',par4,', CI=', par7, ', CI type=',par6,')',sep=''))
dev.off()
bitmap(file='pic2.png')
rpacf <- pacf(x,par1,main='Partial Autocorrelation',xlab='lags',ylab='PACF')
dev.off()
(myacf <- c(racf$acf))
(mypacf <- c(rpacf$acf))
lengthx <- length(x)
sqrtn <- sqrt(lengthx)
load(file='createtable')
a<-table.start()
a<-table.row.start(a)
a<-table.element(a,'Autocorrelation Function',4,TRUE)
a<-table.row.end(a)
a<-table.row.start(a)
a<-table.element(a,'Time lag k',header=TRUE)
a<-table.element(a,hyperlink('basics.htm','ACF(k)','click here for more information about the Autocorrelation Function'),header=TRUE)
a<-table.element(a,'T-STAT',header=TRUE)
a<-table.element(a,'P-value',header=TRUE)
a<-table.row.end(a)
for (i in 2:(par1+1)) {
a<-table.row.start(a)
a<-table.element(a,i-1,header=TRUE)
a<-table.element(a,round(myacf[i],6))
mytstat <- myacf[i]*sqrtn
a<-table.element(a,round(mytstat,4))
a<-table.element(a,round(1-pt(abs(mytstat),lengthx),6))
a<-table.row.end(a)
}
a<-table.end(a)
table.save(a,file='mytable.tab')
a<-table.start()
a<-table.row.start(a)
a<-table.element(a,'Partial Autocorrelation Function',4,TRUE)
a<-table.row.end(a)
a<-table.row.start(a)
a<-table.element(a,'Time lag k',header=TRUE)
a<-table.element(a,hyperlink('basics.htm','PACF(k)','click here for more information about the Partial Autocorrelation Function'),header=TRUE)
a<-table.element(a,'T-STAT',header=TRUE)
a<-table.element(a,'P-value',header=TRUE)
a<-table.row.end(a)
for (i in 1:par1) {
a<-table.row.start(a)
a<-table.element(a,i,header=TRUE)
a<-table.element(a,round(mypacf[i],6))
mytstat <- mypacf[i]*sqrtn
a<-table.element(a,round(mytstat,4))
a<-table.element(a,round(1-pt(abs(mytstat),lengthx),6))
a<-table.row.end(a)
}
a<-table.end(a)
table.save(a,file='mytable1.tab')