Free Statistics

of Irreproducible Research!

Author's title

Author*Unverified author*
R Software Modulerwasp_multipleregression.wasp
Title produced by softwareMultiple Regression
Date of computationMon, 21 Dec 2009 06:05:51 -0700
Cite this page as followsStatistical Computations at FreeStatistics.org, Office for Research Development and Education, URL https://freestatistics.org/blog/index.php?v=date/2009/Dec/21/t1261401006a0zshta9n2img1c.htm/, Retrieved Sun, 05 May 2024 10:21:05 +0000
Statistical Computations at FreeStatistics.org, Office for Research Development and Education, URL https://freestatistics.org/blog/index.php?pk=70143, Retrieved Sun, 05 May 2024 10:21:05 +0000
QR Codes:

Original text written by user:
IsPrivate?No (this computation is public)
User-defined keywords
Estimated Impact93
Family? (F = Feedback message, R = changed R code, M = changed R Module, P = changed Parameters, D = changed Data)
-       [Multiple Regression] [] [2009-12-21 13:05:51] [1f2c3943eb1d5c7fe4135bf31d9aaa7b] [Current]
Feedback Forum

Post a new message
Dataseries X:
581	103.5
597	104.6
587	118.6
536	106.3
524	110.7
537	121.6
536	107
533	107.6
528	125.6
516	113.5
502	129.2
506	130.9
518	104.7
534	115.2
528	124.5
478	112.3
469	127.5
490	120.6
493	117.5
508	117.7
517	120.4
514	125
510	131.6
527	121.1
542	114.2
565	112.1
555	127
499	116.8
511	112
526	129.7
532	113.6
549	115.7
561	119.5
557	125.8
566	129.6
588	128
620	112.8
626	101.6
620	123.9
573	118.8
573	109.1
574	130.6
580	112.4
590	111
593	116.2
597	119.8
595	117.2
612	127.3
628	107.7
629	97.5
621	120.1
569	110.6
567	111.3
573	119.8
584	105.5
589	108.7
591	128.7
595	119.5
594	121.1
611	128.4


Summary of computational transaction
Raw Inputview raw input (R code)
Raw Outputview raw output of R engine
Computing time4 seconds
R Server'Gwilym Jenkins' @ 72.249.127.135

\begin{tabular}{lllllllll}
\hline
Summary of computational transaction \tabularnewline
Raw Input & view raw input (R code)  \tabularnewline
Raw Output & view raw output of R engine  \tabularnewline
Computing time & 4 seconds \tabularnewline
R Server & 'Gwilym Jenkins' @ 72.249.127.135 \tabularnewline
\hline
\end{tabular}
%Source: https://freestatistics.org/blog/index.php?pk=70143&T=0

[TABLE]
[ROW][C]Summary of computational transaction[/C][/ROW]
[ROW][C]Raw Input[/C][C]view raw input (R code) [/C][/ROW]
[ROW][C]Raw Output[/C][C]view raw output of R engine [/C][/ROW]
[ROW][C]Computing time[/C][C]4 seconds[/C][/ROW]
[ROW][C]R Server[/C][C]'Gwilym Jenkins' @ 72.249.127.135[/C][/ROW]
[/TABLE]
Source: https://freestatistics.org/blog/index.php?pk=70143&T=0

Globally Unique Identifier (entire table): ba.freestatistics.org/blog/index.php?pk=70143&T=0

As an alternative you can also use a QR Code:  

The GUIDs for individual cells are displayed in the table below:

Summary of computational transaction
Raw Inputview raw input (R code)
Raw Outputview raw output of R engine
Computing time4 seconds
R Server'Gwilym Jenkins' @ 72.249.127.135


Multiple Linear Regression - Estimated Regression Equation
Prod[t] = + 799.47445598441 -2.26997272111808Werkl[t] -15.4298983271748M1[t] -10.0415966195063M2[t] + 18.0761867894057M3[t] -57.1149074568893M4[t] -58.290902316463M5[t] -25.2285475961726M6[t] -51.937549094269M7[t] -42.6129379524887M8[t] -17.4585723206456M9[t] -24.3548984374369M10[t] -16.9687985934948M11[t] + 1.60916321607065t + e[t]

\begin{tabular}{lllllllll}
\hline
Multiple Linear Regression - Estimated Regression Equation \tabularnewline
Prod[t] =  +  799.47445598441 -2.26997272111808Werkl[t] -15.4298983271748M1[t] -10.0415966195063M2[t] +  18.0761867894057M3[t] -57.1149074568893M4[t] -58.290902316463M5[t] -25.2285475961726M6[t] -51.937549094269M7[t] -42.6129379524887M8[t] -17.4585723206456M9[t] -24.3548984374369M10[t] -16.9687985934948M11[t] +  1.60916321607065t  + e[t] \tabularnewline
\hline
\end{tabular}
%Source: https://freestatistics.org/blog/index.php?pk=70143&T=1

[TABLE]
[ROW][C]Multiple Linear Regression - Estimated Regression Equation[/C][/ROW]
[ROW][C]Prod[t] =  +  799.47445598441 -2.26997272111808Werkl[t] -15.4298983271748M1[t] -10.0415966195063M2[t] +  18.0761867894057M3[t] -57.1149074568893M4[t] -58.290902316463M5[t] -25.2285475961726M6[t] -51.937549094269M7[t] -42.6129379524887M8[t] -17.4585723206456M9[t] -24.3548984374369M10[t] -16.9687985934948M11[t] +  1.60916321607065t  + e[t][/C][/ROW]
[/TABLE]
Source: https://freestatistics.org/blog/index.php?pk=70143&T=1

Globally Unique Identifier (entire table): ba.freestatistics.org/blog/index.php?pk=70143&T=1

As an alternative you can also use a QR Code:  

The GUIDs for individual cells are displayed in the table below:

Multiple Linear Regression - Estimated Regression Equation
Prod[t] = + 799.47445598441 -2.26997272111808Werkl[t] -15.4298983271748M1[t] -10.0415966195063M2[t] + 18.0761867894057M3[t] -57.1149074568893M4[t] -58.290902316463M5[t] -25.2285475961726M6[t] -51.937549094269M7[t] -42.6129379524887M8[t] -17.4585723206456M9[t] -24.3548984374369M10[t] -16.9687985934948M11[t] + 1.60916321607065t + e[t]


Multiple Linear Regression - Ordinary Least Squares
VariableParameterS.D.T-STATH0: parameter = 02-tail p-value1-tail p-value
(Intercept)799.4744559844184.5957989.450500
Werkl-2.269972721118080.653062-3.47590.0011220.000561
M1-15.429898327174819.689126-0.78370.4372470.218623
M2-10.041596619506320.6679-0.48590.6293770.314688
M318.076186789405715.6093221.1580.2528260.126413
M4-57.114907456889317.959417-3.18020.0026340.001317
M5-58.29090231646317.552113-3.3210.0017630.000881
M6-25.228547596172615.385714-1.63970.1078820.053941
M7-51.93754909426918.52223-2.80410.0073670.003683
M8-42.612937952488718.163789-2.3460.0233390.01167
M9-17.458572320645615.609036-1.11850.2691640.134582
M10-24.354898437436915.813885-1.54010.1303890.065194
M11-16.968798593494815.263641-1.11170.2720380.136019
t1.609163216070650.1840388.743700

\begin{tabular}{lllllllll}
\hline
Multiple Linear Regression - Ordinary Least Squares \tabularnewline
Variable & Parameter & S.D. & T-STATH0: parameter = 0 & 2-tail p-value & 1-tail p-value \tabularnewline
(Intercept) & 799.47445598441 & 84.595798 & 9.4505 & 0 & 0 \tabularnewline
Werkl & -2.26997272111808 & 0.653062 & -3.4759 & 0.001122 & 0.000561 \tabularnewline
M1 & -15.4298983271748 & 19.689126 & -0.7837 & 0.437247 & 0.218623 \tabularnewline
M2 & -10.0415966195063 & 20.6679 & -0.4859 & 0.629377 & 0.314688 \tabularnewline
M3 & 18.0761867894057 & 15.609322 & 1.158 & 0.252826 & 0.126413 \tabularnewline
M4 & -57.1149074568893 & 17.959417 & -3.1802 & 0.002634 & 0.001317 \tabularnewline
M5 & -58.290902316463 & 17.552113 & -3.321 & 0.001763 & 0.000881 \tabularnewline
M6 & -25.2285475961726 & 15.385714 & -1.6397 & 0.107882 & 0.053941 \tabularnewline
M7 & -51.937549094269 & 18.52223 & -2.8041 & 0.007367 & 0.003683 \tabularnewline
M8 & -42.6129379524887 & 18.163789 & -2.346 & 0.023339 & 0.01167 \tabularnewline
M9 & -17.4585723206456 & 15.609036 & -1.1185 & 0.269164 & 0.134582 \tabularnewline
M10 & -24.3548984374369 & 15.813885 & -1.5401 & 0.130389 & 0.065194 \tabularnewline
M11 & -16.9687985934948 & 15.263641 & -1.1117 & 0.272038 & 0.136019 \tabularnewline
t & 1.60916321607065 & 0.184038 & 8.7437 & 0 & 0 \tabularnewline
\hline
\end{tabular}
%Source: https://freestatistics.org/blog/index.php?pk=70143&T=2

[TABLE]
[ROW][C]Multiple Linear Regression - Ordinary Least Squares[/C][/ROW]
[ROW][C]Variable[/C][C]Parameter[/C][C]S.D.[/C][C]T-STATH0: parameter = 0[/C][C]2-tail p-value[/C][C]1-tail p-value[/C][/ROW]
[ROW][C](Intercept)[/C][C]799.47445598441[/C][C]84.595798[/C][C]9.4505[/C][C]0[/C][C]0[/C][/ROW]
[ROW][C]Werkl[/C][C]-2.26997272111808[/C][C]0.653062[/C][C]-3.4759[/C][C]0.001122[/C][C]0.000561[/C][/ROW]
[ROW][C]M1[/C][C]-15.4298983271748[/C][C]19.689126[/C][C]-0.7837[/C][C]0.437247[/C][C]0.218623[/C][/ROW]
[ROW][C]M2[/C][C]-10.0415966195063[/C][C]20.6679[/C][C]-0.4859[/C][C]0.629377[/C][C]0.314688[/C][/ROW]
[ROW][C]M3[/C][C]18.0761867894057[/C][C]15.609322[/C][C]1.158[/C][C]0.252826[/C][C]0.126413[/C][/ROW]
[ROW][C]M4[/C][C]-57.1149074568893[/C][C]17.959417[/C][C]-3.1802[/C][C]0.002634[/C][C]0.001317[/C][/ROW]
[ROW][C]M5[/C][C]-58.290902316463[/C][C]17.552113[/C][C]-3.321[/C][C]0.001763[/C][C]0.000881[/C][/ROW]
[ROW][C]M6[/C][C]-25.2285475961726[/C][C]15.385714[/C][C]-1.6397[/C][C]0.107882[/C][C]0.053941[/C][/ROW]
[ROW][C]M7[/C][C]-51.937549094269[/C][C]18.52223[/C][C]-2.8041[/C][C]0.007367[/C][C]0.003683[/C][/ROW]
[ROW][C]M8[/C][C]-42.6129379524887[/C][C]18.163789[/C][C]-2.346[/C][C]0.023339[/C][C]0.01167[/C][/ROW]
[ROW][C]M9[/C][C]-17.4585723206456[/C][C]15.609036[/C][C]-1.1185[/C][C]0.269164[/C][C]0.134582[/C][/ROW]
[ROW][C]M10[/C][C]-24.3548984374369[/C][C]15.813885[/C][C]-1.5401[/C][C]0.130389[/C][C]0.065194[/C][/ROW]
[ROW][C]M11[/C][C]-16.9687985934948[/C][C]15.263641[/C][C]-1.1117[/C][C]0.272038[/C][C]0.136019[/C][/ROW]
[ROW][C]t[/C][C]1.60916321607065[/C][C]0.184038[/C][C]8.7437[/C][C]0[/C][C]0[/C][/ROW]
[/TABLE]
Source: https://freestatistics.org/blog/index.php?pk=70143&T=2

Globally Unique Identifier (entire table): ba.freestatistics.org/blog/index.php?pk=70143&T=2

As an alternative you can also use a QR Code:  

The GUIDs for individual cells are displayed in the table below:

Multiple Linear Regression - Ordinary Least Squares
VariableParameterS.D.T-STATH0: parameter = 02-tail p-value1-tail p-value
(Intercept)799.4744559844184.5957989.450500
Werkl-2.269972721118080.653062-3.47590.0011220.000561
M1-15.429898327174819.689126-0.78370.4372470.218623
M2-10.041596619506320.6679-0.48590.6293770.314688
M318.076186789405715.6093221.1580.2528260.126413
M4-57.114907456889317.959417-3.18020.0026340.001317
M5-58.29090231646317.552113-3.3210.0017630.000881
M6-25.228547596172615.385714-1.63970.1078820.053941
M7-51.93754909426918.52223-2.80410.0073670.003683
M8-42.612937952488718.163789-2.3460.0233390.01167
M9-17.458572320645615.609036-1.11850.2691640.134582
M10-24.354898437436915.813885-1.54010.1303890.065194
M11-16.968798593494815.263641-1.11170.2720380.136019
t1.609163216070650.1840388.743700


Multiple Linear Regression - Regression Statistics
Multiple R0.860766387238483
R-squared0.74091877339959
Adjusted R-squared0.667700165882082
F-TEST (value)10.1192688378078
F-TEST (DF numerator)13
F-TEST (DF denominator)46
p-value1.47951073614649e-09
Multiple Linear Regression - Residual Statistics
Residual Standard Deviation24.0872167020129
Sum Squared Residuals26688.9243886876

\begin{tabular}{lllllllll}
\hline
Multiple Linear Regression - Regression Statistics \tabularnewline
Multiple R & 0.860766387238483 \tabularnewline
R-squared & 0.74091877339959 \tabularnewline
Adjusted R-squared & 0.667700165882082 \tabularnewline
F-TEST (value) & 10.1192688378078 \tabularnewline
F-TEST (DF numerator) & 13 \tabularnewline
F-TEST (DF denominator) & 46 \tabularnewline
p-value & 1.47951073614649e-09 \tabularnewline
Multiple Linear Regression - Residual Statistics \tabularnewline
Residual Standard Deviation & 24.0872167020129 \tabularnewline
Sum Squared Residuals & 26688.9243886876 \tabularnewline
\hline
\end{tabular}
%Source: https://freestatistics.org/blog/index.php?pk=70143&T=3

[TABLE]
[ROW][C]Multiple Linear Regression - Regression Statistics[/C][/ROW]
[ROW][C]Multiple R[/C][C]0.860766387238483[/C][/ROW]
[ROW][C]R-squared[/C][C]0.74091877339959[/C][/ROW]
[ROW][C]Adjusted R-squared[/C][C]0.667700165882082[/C][/ROW]
[ROW][C]F-TEST (value)[/C][C]10.1192688378078[/C][/ROW]
[ROW][C]F-TEST (DF numerator)[/C][C]13[/C][/ROW]
[ROW][C]F-TEST (DF denominator)[/C][C]46[/C][/ROW]
[ROW][C]p-value[/C][C]1.47951073614649e-09[/C][/ROW]
[ROW][C]Multiple Linear Regression - Residual Statistics[/C][/ROW]
[ROW][C]Residual Standard Deviation[/C][C]24.0872167020129[/C][/ROW]
[ROW][C]Sum Squared Residuals[/C][C]26688.9243886876[/C][/ROW]
[/TABLE]
Source: https://freestatistics.org/blog/index.php?pk=70143&T=3

Globally Unique Identifier (entire table): ba.freestatistics.org/blog/index.php?pk=70143&T=3

As an alternative you can also use a QR Code:  

The GUIDs for individual cells are displayed in the table below:

Multiple Linear Regression - Regression Statistics
Multiple R0.860766387238483
R-squared0.74091877339959
Adjusted R-squared0.667700165882082
F-TEST (value)10.1192688378078
F-TEST (DF numerator)13
F-TEST (DF denominator)46
p-value1.47951073614649e-09
Multiple Linear Regression - Residual Statistics
Residual Standard Deviation24.0872167020129
Sum Squared Residuals26688.9243886876


Multiple Linear Regression - Actuals, Interpolation, and Residuals
Time or IndexActualsInterpolationForecastResidualsPrediction Error
1581550.71154423758530.2884557624147
2597555.21203916809341.7879608319066
3587553.15936769742333.8406323025773
4536507.49810113695128.5018988630492
5524497.94338952052826.0566104794718
6537507.87220479670229.1277952032979
7536515.91396824320.0860317569997
8533525.485758968187.51424103181953
9528511.38977883596916.6102211640312
10516533.569285860777-17.5692858607769
11502506.925977199236-4.92597719923579
12506521.6449853829-15.6449853829003
13518567.29753556509-49.2975355650901
14534550.460286917089-16.4602869170893
15528559.076487235674-31.0764872356738
16478513.18822340309-35.1882234030901
17469479.117806398592-10.1178063985922
18490529.452136110668-39.452136110668
19493511.389213264108-18.3892132641082
20508521.868993077736-13.8689930777356
21517542.50359557863-25.5035955786305
22514526.774558160767-12.7745581607668
23510520.7880012614-10.7880012614002
24527563.200676642706-36.2006766427055
25542565.042753307316-23.0427533073161
26565576.807160945403-11.8071609454033
27555572.711514025726-17.7115140257264
28499522.283304750906-23.2833047509065
29511533.61234216877-22.6123421687703
30526528.105342941341-2.10534294134123
31532539.552065469317-7.55206546931661
32549545.718897112823.2811028871804
33561563.856529620485-2.85652962048465
34557544.2685385767212.7314614232799
35566544.63790529648421.3620947035158
36588566.84782345983821.1521765401615
37620587.53067370972932.4693262902708
38626619.9518331099916.04816689000898
39620599.0583880540420.9416119459597
40573537.05331790151835.9466820984818
41573559.5052216528613.4947783471394
42574545.37232608518328.6276739148172
43580561.58599132750618.4140086724939
44590575.69772749492214.3022725050776
45593590.6573981930222.34260180697787
46597577.19833349627619.8016665037235
47595592.0955256311962.90447436880373
48612587.74676295746924.2532370425310
49628618.4174931802799.58250681972072
50629648.568679859423-19.568679859423
51621626.994242987137-5.99424298713684
52569574.977052807534-5.97705280753435
53567573.821240259249-6.82124025924866
54573589.197990066106-16.1979900661059
55584596.558761696069-12.5587616960688
56589600.228623346342-11.2286233463419
57591581.5926977718949.40730222810607
58595597.18928390546-2.18928390545971
59594602.552590611684-8.55259061168358
60611604.5597515570876.4402484429131

\begin{tabular}{lllllllll}
\hline
Multiple Linear Regression - Actuals, Interpolation, and Residuals \tabularnewline
Time or Index & Actuals & InterpolationForecast & ResidualsPrediction Error \tabularnewline
1 & 581 & 550.711544237585 & 30.2884557624147 \tabularnewline
2 & 597 & 555.212039168093 & 41.7879608319066 \tabularnewline
3 & 587 & 553.159367697423 & 33.8406323025773 \tabularnewline
4 & 536 & 507.498101136951 & 28.5018988630492 \tabularnewline
5 & 524 & 497.943389520528 & 26.0566104794718 \tabularnewline
6 & 537 & 507.872204796702 & 29.1277952032979 \tabularnewline
7 & 536 & 515.913968243 & 20.0860317569997 \tabularnewline
8 & 533 & 525.48575896818 & 7.51424103181953 \tabularnewline
9 & 528 & 511.389778835969 & 16.6102211640312 \tabularnewline
10 & 516 & 533.569285860777 & -17.5692858607769 \tabularnewline
11 & 502 & 506.925977199236 & -4.92597719923579 \tabularnewline
12 & 506 & 521.6449853829 & -15.6449853829003 \tabularnewline
13 & 518 & 567.29753556509 & -49.2975355650901 \tabularnewline
14 & 534 & 550.460286917089 & -16.4602869170893 \tabularnewline
15 & 528 & 559.076487235674 & -31.0764872356738 \tabularnewline
16 & 478 & 513.18822340309 & -35.1882234030901 \tabularnewline
17 & 469 & 479.117806398592 & -10.1178063985922 \tabularnewline
18 & 490 & 529.452136110668 & -39.452136110668 \tabularnewline
19 & 493 & 511.389213264108 & -18.3892132641082 \tabularnewline
20 & 508 & 521.868993077736 & -13.8689930777356 \tabularnewline
21 & 517 & 542.50359557863 & -25.5035955786305 \tabularnewline
22 & 514 & 526.774558160767 & -12.7745581607668 \tabularnewline
23 & 510 & 520.7880012614 & -10.7880012614002 \tabularnewline
24 & 527 & 563.200676642706 & -36.2006766427055 \tabularnewline
25 & 542 & 565.042753307316 & -23.0427533073161 \tabularnewline
26 & 565 & 576.807160945403 & -11.8071609454033 \tabularnewline
27 & 555 & 572.711514025726 & -17.7115140257264 \tabularnewline
28 & 499 & 522.283304750906 & -23.2833047509065 \tabularnewline
29 & 511 & 533.61234216877 & -22.6123421687703 \tabularnewline
30 & 526 & 528.105342941341 & -2.10534294134123 \tabularnewline
31 & 532 & 539.552065469317 & -7.55206546931661 \tabularnewline
32 & 549 & 545.71889711282 & 3.2811028871804 \tabularnewline
33 & 561 & 563.856529620485 & -2.85652962048465 \tabularnewline
34 & 557 & 544.26853857672 & 12.7314614232799 \tabularnewline
35 & 566 & 544.637905296484 & 21.3620947035158 \tabularnewline
36 & 588 & 566.847823459838 & 21.1521765401615 \tabularnewline
37 & 620 & 587.530673709729 & 32.4693262902708 \tabularnewline
38 & 626 & 619.951833109991 & 6.04816689000898 \tabularnewline
39 & 620 & 599.05838805404 & 20.9416119459597 \tabularnewline
40 & 573 & 537.053317901518 & 35.9466820984818 \tabularnewline
41 & 573 & 559.50522165286 & 13.4947783471394 \tabularnewline
42 & 574 & 545.372326085183 & 28.6276739148172 \tabularnewline
43 & 580 & 561.585991327506 & 18.4140086724939 \tabularnewline
44 & 590 & 575.697727494922 & 14.3022725050776 \tabularnewline
45 & 593 & 590.657398193022 & 2.34260180697787 \tabularnewline
46 & 597 & 577.198333496276 & 19.8016665037235 \tabularnewline
47 & 595 & 592.095525631196 & 2.90447436880373 \tabularnewline
48 & 612 & 587.746762957469 & 24.2532370425310 \tabularnewline
49 & 628 & 618.417493180279 & 9.58250681972072 \tabularnewline
50 & 629 & 648.568679859423 & -19.568679859423 \tabularnewline
51 & 621 & 626.994242987137 & -5.99424298713684 \tabularnewline
52 & 569 & 574.977052807534 & -5.97705280753435 \tabularnewline
53 & 567 & 573.821240259249 & -6.82124025924866 \tabularnewline
54 & 573 & 589.197990066106 & -16.1979900661059 \tabularnewline
55 & 584 & 596.558761696069 & -12.5587616960688 \tabularnewline
56 & 589 & 600.228623346342 & -11.2286233463419 \tabularnewline
57 & 591 & 581.592697771894 & 9.40730222810607 \tabularnewline
58 & 595 & 597.18928390546 & -2.18928390545971 \tabularnewline
59 & 594 & 602.552590611684 & -8.55259061168358 \tabularnewline
60 & 611 & 604.559751557087 & 6.4402484429131 \tabularnewline
\hline
\end{tabular}
%Source: https://freestatistics.org/blog/index.php?pk=70143&T=4

[TABLE]
[ROW][C]Multiple Linear Regression - Actuals, Interpolation, and Residuals[/C][/ROW]
[ROW][C]Time or Index[/C][C]Actuals[/C][C]InterpolationForecast[/C][C]ResidualsPrediction Error[/C][/ROW]
[ROW][C]1[/C][C]581[/C][C]550.711544237585[/C][C]30.2884557624147[/C][/ROW]
[ROW][C]2[/C][C]597[/C][C]555.212039168093[/C][C]41.7879608319066[/C][/ROW]
[ROW][C]3[/C][C]587[/C][C]553.159367697423[/C][C]33.8406323025773[/C][/ROW]
[ROW][C]4[/C][C]536[/C][C]507.498101136951[/C][C]28.5018988630492[/C][/ROW]
[ROW][C]5[/C][C]524[/C][C]497.943389520528[/C][C]26.0566104794718[/C][/ROW]
[ROW][C]6[/C][C]537[/C][C]507.872204796702[/C][C]29.1277952032979[/C][/ROW]
[ROW][C]7[/C][C]536[/C][C]515.913968243[/C][C]20.0860317569997[/C][/ROW]
[ROW][C]8[/C][C]533[/C][C]525.48575896818[/C][C]7.51424103181953[/C][/ROW]
[ROW][C]9[/C][C]528[/C][C]511.389778835969[/C][C]16.6102211640312[/C][/ROW]
[ROW][C]10[/C][C]516[/C][C]533.569285860777[/C][C]-17.5692858607769[/C][/ROW]
[ROW][C]11[/C][C]502[/C][C]506.925977199236[/C][C]-4.92597719923579[/C][/ROW]
[ROW][C]12[/C][C]506[/C][C]521.6449853829[/C][C]-15.6449853829003[/C][/ROW]
[ROW][C]13[/C][C]518[/C][C]567.29753556509[/C][C]-49.2975355650901[/C][/ROW]
[ROW][C]14[/C][C]534[/C][C]550.460286917089[/C][C]-16.4602869170893[/C][/ROW]
[ROW][C]15[/C][C]528[/C][C]559.076487235674[/C][C]-31.0764872356738[/C][/ROW]
[ROW][C]16[/C][C]478[/C][C]513.18822340309[/C][C]-35.1882234030901[/C][/ROW]
[ROW][C]17[/C][C]469[/C][C]479.117806398592[/C][C]-10.1178063985922[/C][/ROW]
[ROW][C]18[/C][C]490[/C][C]529.452136110668[/C][C]-39.452136110668[/C][/ROW]
[ROW][C]19[/C][C]493[/C][C]511.389213264108[/C][C]-18.3892132641082[/C][/ROW]
[ROW][C]20[/C][C]508[/C][C]521.868993077736[/C][C]-13.8689930777356[/C][/ROW]
[ROW][C]21[/C][C]517[/C][C]542.50359557863[/C][C]-25.5035955786305[/C][/ROW]
[ROW][C]22[/C][C]514[/C][C]526.774558160767[/C][C]-12.7745581607668[/C][/ROW]
[ROW][C]23[/C][C]510[/C][C]520.7880012614[/C][C]-10.7880012614002[/C][/ROW]
[ROW][C]24[/C][C]527[/C][C]563.200676642706[/C][C]-36.2006766427055[/C][/ROW]
[ROW][C]25[/C][C]542[/C][C]565.042753307316[/C][C]-23.0427533073161[/C][/ROW]
[ROW][C]26[/C][C]565[/C][C]576.807160945403[/C][C]-11.8071609454033[/C][/ROW]
[ROW][C]27[/C][C]555[/C][C]572.711514025726[/C][C]-17.7115140257264[/C][/ROW]
[ROW][C]28[/C][C]499[/C][C]522.283304750906[/C][C]-23.2833047509065[/C][/ROW]
[ROW][C]29[/C][C]511[/C][C]533.61234216877[/C][C]-22.6123421687703[/C][/ROW]
[ROW][C]30[/C][C]526[/C][C]528.105342941341[/C][C]-2.10534294134123[/C][/ROW]
[ROW][C]31[/C][C]532[/C][C]539.552065469317[/C][C]-7.55206546931661[/C][/ROW]
[ROW][C]32[/C][C]549[/C][C]545.71889711282[/C][C]3.2811028871804[/C][/ROW]
[ROW][C]33[/C][C]561[/C][C]563.856529620485[/C][C]-2.85652962048465[/C][/ROW]
[ROW][C]34[/C][C]557[/C][C]544.26853857672[/C][C]12.7314614232799[/C][/ROW]
[ROW][C]35[/C][C]566[/C][C]544.637905296484[/C][C]21.3620947035158[/C][/ROW]
[ROW][C]36[/C][C]588[/C][C]566.847823459838[/C][C]21.1521765401615[/C][/ROW]
[ROW][C]37[/C][C]620[/C][C]587.530673709729[/C][C]32.4693262902708[/C][/ROW]
[ROW][C]38[/C][C]626[/C][C]619.951833109991[/C][C]6.04816689000898[/C][/ROW]
[ROW][C]39[/C][C]620[/C][C]599.05838805404[/C][C]20.9416119459597[/C][/ROW]
[ROW][C]40[/C][C]573[/C][C]537.053317901518[/C][C]35.9466820984818[/C][/ROW]
[ROW][C]41[/C][C]573[/C][C]559.50522165286[/C][C]13.4947783471394[/C][/ROW]
[ROW][C]42[/C][C]574[/C][C]545.372326085183[/C][C]28.6276739148172[/C][/ROW]
[ROW][C]43[/C][C]580[/C][C]561.585991327506[/C][C]18.4140086724939[/C][/ROW]
[ROW][C]44[/C][C]590[/C][C]575.697727494922[/C][C]14.3022725050776[/C][/ROW]
[ROW][C]45[/C][C]593[/C][C]590.657398193022[/C][C]2.34260180697787[/C][/ROW]
[ROW][C]46[/C][C]597[/C][C]577.198333496276[/C][C]19.8016665037235[/C][/ROW]
[ROW][C]47[/C][C]595[/C][C]592.095525631196[/C][C]2.90447436880373[/C][/ROW]
[ROW][C]48[/C][C]612[/C][C]587.746762957469[/C][C]24.2532370425310[/C][/ROW]
[ROW][C]49[/C][C]628[/C][C]618.417493180279[/C][C]9.58250681972072[/C][/ROW]
[ROW][C]50[/C][C]629[/C][C]648.568679859423[/C][C]-19.568679859423[/C][/ROW]
[ROW][C]51[/C][C]621[/C][C]626.994242987137[/C][C]-5.99424298713684[/C][/ROW]
[ROW][C]52[/C][C]569[/C][C]574.977052807534[/C][C]-5.97705280753435[/C][/ROW]
[ROW][C]53[/C][C]567[/C][C]573.821240259249[/C][C]-6.82124025924866[/C][/ROW]
[ROW][C]54[/C][C]573[/C][C]589.197990066106[/C][C]-16.1979900661059[/C][/ROW]
[ROW][C]55[/C][C]584[/C][C]596.558761696069[/C][C]-12.5587616960688[/C][/ROW]
[ROW][C]56[/C][C]589[/C][C]600.228623346342[/C][C]-11.2286233463419[/C][/ROW]
[ROW][C]57[/C][C]591[/C][C]581.592697771894[/C][C]9.40730222810607[/C][/ROW]
[ROW][C]58[/C][C]595[/C][C]597.18928390546[/C][C]-2.18928390545971[/C][/ROW]
[ROW][C]59[/C][C]594[/C][C]602.552590611684[/C][C]-8.55259061168358[/C][/ROW]
[ROW][C]60[/C][C]611[/C][C]604.559751557087[/C][C]6.4402484429131[/C][/ROW]
[/TABLE]
Source: https://freestatistics.org/blog/index.php?pk=70143&T=4

Globally Unique Identifier (entire table): ba.freestatistics.org/blog/index.php?pk=70143&T=4

As an alternative you can also use a QR Code:  

The GUIDs for individual cells are displayed in the table below:

Multiple Linear Regression - Actuals, Interpolation, and Residuals
Time or IndexActualsInterpolationForecastResidualsPrediction Error
1581550.71154423758530.2884557624147
2597555.21203916809341.7879608319066
3587553.15936769742333.8406323025773
4536507.49810113695128.5018988630492
5524497.94338952052826.0566104794718
6537507.87220479670229.1277952032979
7536515.91396824320.0860317569997
8533525.485758968187.51424103181953
9528511.38977883596916.6102211640312
10516533.569285860777-17.5692858607769
11502506.925977199236-4.92597719923579
12506521.6449853829-15.6449853829003
13518567.29753556509-49.2975355650901
14534550.460286917089-16.4602869170893
15528559.076487235674-31.0764872356738
16478513.18822340309-35.1882234030901
17469479.117806398592-10.1178063985922
18490529.452136110668-39.452136110668
19493511.389213264108-18.3892132641082
20508521.868993077736-13.8689930777356
21517542.50359557863-25.5035955786305
22514526.774558160767-12.7745581607668
23510520.7880012614-10.7880012614002
24527563.200676642706-36.2006766427055
25542565.042753307316-23.0427533073161
26565576.807160945403-11.8071609454033
27555572.711514025726-17.7115140257264
28499522.283304750906-23.2833047509065
29511533.61234216877-22.6123421687703
30526528.105342941341-2.10534294134123
31532539.552065469317-7.55206546931661
32549545.718897112823.2811028871804
33561563.856529620485-2.85652962048465
34557544.2685385767212.7314614232799
35566544.63790529648421.3620947035158
36588566.84782345983821.1521765401615
37620587.53067370972932.4693262902708
38626619.9518331099916.04816689000898
39620599.0583880540420.9416119459597
40573537.05331790151835.9466820984818
41573559.5052216528613.4947783471394
42574545.37232608518328.6276739148172
43580561.58599132750618.4140086724939
44590575.69772749492214.3022725050776
45593590.6573981930222.34260180697787
46597577.19833349627619.8016665037235
47595592.0955256311962.90447436880373
48612587.74676295746924.2532370425310
49628618.4174931802799.58250681972072
50629648.568679859423-19.568679859423
51621626.994242987137-5.99424298713684
52569574.977052807534-5.97705280753435
53567573.821240259249-6.82124025924866
54573589.197990066106-16.1979900661059
55584596.558761696069-12.5587616960688
56589600.228623346342-11.2286233463419
57591581.5926977718949.40730222810607
58595597.18928390546-2.18928390545971
59594602.552590611684-8.55259061168358
60611604.5597515570876.4402484429131


Goldfeld-Quandt test for Heteroskedasticity
p-valuesAlternative Hypothesis
breakpoint indexgreater2-sidedless
170.002766151105308280.005532302210616560.997233848894692
180.00883516175592980.01767032351185960.99116483824407
190.01132623395838460.02265246791676920.988673766041615
200.06260694889627690.1252138977925540.937393051103723
210.1549976697560100.3099953395120200.84500233024399
220.3825068209729400.7650136419458790.61749317902706
230.5507486739720110.8985026520559790.449251326027989
240.6259832484594610.7480335030810780.374016751540539
250.8319961728034340.3360076543931330.168003827196566
260.843378218706090.3132435625878210.156621781293910
270.8837525202577940.2324949594844130.116247479742206
280.9503613507946650.09927729841067070.0496386492053354
290.9720677816980.05586443660399870.0279322183019994
300.987218848751140.02556230249771910.0127811512488595
310.9952132190821170.009573561835766840.00478678091788342
320.9980073921911130.003985215617774780.00199260780888739
330.998741053833560.002517892332881830.00125894616644092
340.9999215312277650.0001569375444708677.84687722354333e-05
350.9999900694200691.98611598630301e-059.93057993151506e-06
360.9999999953389429.32211631474562e-094.66105815737281e-09
370.999999998601922.79616176650075e-091.39808088325037e-09
380.9999999913415131.73169750771443e-088.65848753857217e-09
390.9999999155518441.68896312635276e-078.44481563176382e-08
400.9999995933267048.13346592182642e-074.06673296091321e-07
410.9999990051134441.98977311308084e-069.94886556540421e-07
420.9999906992650171.86014699657421e-059.30073498287107e-06
430.9999962446433487.51071330340949e-063.75535665170474e-06

\begin{tabular}{lllllllll}
\hline
Goldfeld-Quandt test for Heteroskedasticity \tabularnewline
p-values & Alternative Hypothesis \tabularnewline
breakpoint index & greater & 2-sided & less \tabularnewline
17 & 0.00276615110530828 & 0.00553230221061656 & 0.997233848894692 \tabularnewline
18 & 0.0088351617559298 & 0.0176703235118596 & 0.99116483824407 \tabularnewline
19 & 0.0113262339583846 & 0.0226524679167692 & 0.988673766041615 \tabularnewline
20 & 0.0626069488962769 & 0.125213897792554 & 0.937393051103723 \tabularnewline
21 & 0.154997669756010 & 0.309995339512020 & 0.84500233024399 \tabularnewline
22 & 0.382506820972940 & 0.765013641945879 & 0.61749317902706 \tabularnewline
23 & 0.550748673972011 & 0.898502652055979 & 0.449251326027989 \tabularnewline
24 & 0.625983248459461 & 0.748033503081078 & 0.374016751540539 \tabularnewline
25 & 0.831996172803434 & 0.336007654393133 & 0.168003827196566 \tabularnewline
26 & 0.84337821870609 & 0.313243562587821 & 0.156621781293910 \tabularnewline
27 & 0.883752520257794 & 0.232494959484413 & 0.116247479742206 \tabularnewline
28 & 0.950361350794665 & 0.0992772984106707 & 0.0496386492053354 \tabularnewline
29 & 0.972067781698 & 0.0558644366039987 & 0.0279322183019994 \tabularnewline
30 & 0.98721884875114 & 0.0255623024977191 & 0.0127811512488595 \tabularnewline
31 & 0.995213219082117 & 0.00957356183576684 & 0.00478678091788342 \tabularnewline
32 & 0.998007392191113 & 0.00398521561777478 & 0.00199260780888739 \tabularnewline
33 & 0.99874105383356 & 0.00251789233288183 & 0.00125894616644092 \tabularnewline
34 & 0.999921531227765 & 0.000156937544470867 & 7.84687722354333e-05 \tabularnewline
35 & 0.999990069420069 & 1.98611598630301e-05 & 9.93057993151506e-06 \tabularnewline
36 & 0.999999995338942 & 9.32211631474562e-09 & 4.66105815737281e-09 \tabularnewline
37 & 0.99999999860192 & 2.79616176650075e-09 & 1.39808088325037e-09 \tabularnewline
38 & 0.999999991341513 & 1.73169750771443e-08 & 8.65848753857217e-09 \tabularnewline
39 & 0.999999915551844 & 1.68896312635276e-07 & 8.44481563176382e-08 \tabularnewline
40 & 0.999999593326704 & 8.13346592182642e-07 & 4.06673296091321e-07 \tabularnewline
41 & 0.999999005113444 & 1.98977311308084e-06 & 9.94886556540421e-07 \tabularnewline
42 & 0.999990699265017 & 1.86014699657421e-05 & 9.30073498287107e-06 \tabularnewline
43 & 0.999996244643348 & 7.51071330340949e-06 & 3.75535665170474e-06 \tabularnewline
\hline
\end{tabular}
%Source: https://freestatistics.org/blog/index.php?pk=70143&T=5

[TABLE]
[ROW][C]Goldfeld-Quandt test for Heteroskedasticity[/C][/ROW]
[ROW][C]p-values[/C][C]Alternative Hypothesis[/C][/ROW]
[ROW][C]breakpoint index[/C][C]greater[/C][C]2-sided[/C][C]less[/C][/ROW]
[ROW][C]17[/C][C]0.00276615110530828[/C][C]0.00553230221061656[/C][C]0.997233848894692[/C][/ROW]
[ROW][C]18[/C][C]0.0088351617559298[/C][C]0.0176703235118596[/C][C]0.99116483824407[/C][/ROW]
[ROW][C]19[/C][C]0.0113262339583846[/C][C]0.0226524679167692[/C][C]0.988673766041615[/C][/ROW]
[ROW][C]20[/C][C]0.0626069488962769[/C][C]0.125213897792554[/C][C]0.937393051103723[/C][/ROW]
[ROW][C]21[/C][C]0.154997669756010[/C][C]0.309995339512020[/C][C]0.84500233024399[/C][/ROW]
[ROW][C]22[/C][C]0.382506820972940[/C][C]0.765013641945879[/C][C]0.61749317902706[/C][/ROW]
[ROW][C]23[/C][C]0.550748673972011[/C][C]0.898502652055979[/C][C]0.449251326027989[/C][/ROW]
[ROW][C]24[/C][C]0.625983248459461[/C][C]0.748033503081078[/C][C]0.374016751540539[/C][/ROW]
[ROW][C]25[/C][C]0.831996172803434[/C][C]0.336007654393133[/C][C]0.168003827196566[/C][/ROW]
[ROW][C]26[/C][C]0.84337821870609[/C][C]0.313243562587821[/C][C]0.156621781293910[/C][/ROW]
[ROW][C]27[/C][C]0.883752520257794[/C][C]0.232494959484413[/C][C]0.116247479742206[/C][/ROW]
[ROW][C]28[/C][C]0.950361350794665[/C][C]0.0992772984106707[/C][C]0.0496386492053354[/C][/ROW]
[ROW][C]29[/C][C]0.972067781698[/C][C]0.0558644366039987[/C][C]0.0279322183019994[/C][/ROW]
[ROW][C]30[/C][C]0.98721884875114[/C][C]0.0255623024977191[/C][C]0.0127811512488595[/C][/ROW]
[ROW][C]31[/C][C]0.995213219082117[/C][C]0.00957356183576684[/C][C]0.00478678091788342[/C][/ROW]
[ROW][C]32[/C][C]0.998007392191113[/C][C]0.00398521561777478[/C][C]0.00199260780888739[/C][/ROW]
[ROW][C]33[/C][C]0.99874105383356[/C][C]0.00251789233288183[/C][C]0.00125894616644092[/C][/ROW]
[ROW][C]34[/C][C]0.999921531227765[/C][C]0.000156937544470867[/C][C]7.84687722354333e-05[/C][/ROW]
[ROW][C]35[/C][C]0.999990069420069[/C][C]1.98611598630301e-05[/C][C]9.93057993151506e-06[/C][/ROW]
[ROW][C]36[/C][C]0.999999995338942[/C][C]9.32211631474562e-09[/C][C]4.66105815737281e-09[/C][/ROW]
[ROW][C]37[/C][C]0.99999999860192[/C][C]2.79616176650075e-09[/C][C]1.39808088325037e-09[/C][/ROW]
[ROW][C]38[/C][C]0.999999991341513[/C][C]1.73169750771443e-08[/C][C]8.65848753857217e-09[/C][/ROW]
[ROW][C]39[/C][C]0.999999915551844[/C][C]1.68896312635276e-07[/C][C]8.44481563176382e-08[/C][/ROW]
[ROW][C]40[/C][C]0.999999593326704[/C][C]8.13346592182642e-07[/C][C]4.06673296091321e-07[/C][/ROW]
[ROW][C]41[/C][C]0.999999005113444[/C][C]1.98977311308084e-06[/C][C]9.94886556540421e-07[/C][/ROW]
[ROW][C]42[/C][C]0.999990699265017[/C][C]1.86014699657421e-05[/C][C]9.30073498287107e-06[/C][/ROW]
[ROW][C]43[/C][C]0.999996244643348[/C][C]7.51071330340949e-06[/C][C]3.75535665170474e-06[/C][/ROW]
[/TABLE]
Source: https://freestatistics.org/blog/index.php?pk=70143&T=5

Globally Unique Identifier (entire table): ba.freestatistics.org/blog/index.php?pk=70143&T=5

As an alternative you can also use a QR Code:  

The GUIDs for individual cells are displayed in the table below:

Goldfeld-Quandt test for Heteroskedasticity
p-valuesAlternative Hypothesis
breakpoint indexgreater2-sidedless
170.002766151105308280.005532302210616560.997233848894692
180.00883516175592980.01767032351185960.99116483824407
190.01132623395838460.02265246791676920.988673766041615
200.06260694889627690.1252138977925540.937393051103723
210.1549976697560100.3099953395120200.84500233024399
220.3825068209729400.7650136419458790.61749317902706
230.5507486739720110.8985026520559790.449251326027989
240.6259832484594610.7480335030810780.374016751540539
250.8319961728034340.3360076543931330.168003827196566
260.843378218706090.3132435625878210.156621781293910
270.8837525202577940.2324949594844130.116247479742206
280.9503613507946650.09927729841067070.0496386492053354
290.9720677816980.05586443660399870.0279322183019994
300.987218848751140.02556230249771910.0127811512488595
310.9952132190821170.009573561835766840.00478678091788342
320.9980073921911130.003985215617774780.00199260780888739
330.998741053833560.002517892332881830.00125894616644092
340.9999215312277650.0001569375444708677.84687722354333e-05
350.9999900694200691.98611598630301e-059.93057993151506e-06
360.9999999953389429.32211631474562e-094.66105815737281e-09
370.999999998601922.79616176650075e-091.39808088325037e-09
380.9999999913415131.73169750771443e-088.65848753857217e-09
390.9999999155518441.68896312635276e-078.44481563176382e-08
400.9999995933267048.13346592182642e-074.06673296091321e-07
410.9999990051134441.98977311308084e-069.94886556540421e-07
420.9999906992650171.86014699657421e-059.30073498287107e-06
430.9999962446433487.51071330340949e-063.75535665170474e-06


Meta Analysis of Goldfeld-Quandt test for Heteroskedasticity
Description# significant tests% significant testsOK/NOK
1% type I error level140.518518518518518NOK
5% type I error level170.62962962962963NOK
10% type I error level190.703703703703704NOK

\begin{tabular}{lllllllll}
\hline
Meta Analysis of Goldfeld-Quandt test for Heteroskedasticity \tabularnewline
Description & # significant tests & % significant tests & OK/NOK \tabularnewline
1% type I error level & 14 & 0.518518518518518 & NOK \tabularnewline
5% type I error level & 17 & 0.62962962962963 & NOK \tabularnewline
10% type I error level & 19 & 0.703703703703704 & NOK \tabularnewline
\hline
\end{tabular}
%Source: https://freestatistics.org/blog/index.php?pk=70143&T=6

[TABLE]
[ROW][C]Meta Analysis of Goldfeld-Quandt test for Heteroskedasticity[/C][/ROW]
[ROW][C]Description[/C][C]# significant tests[/C][C]% significant tests[/C][C]OK/NOK[/C][/ROW]
[ROW][C]1% type I error level[/C][C]14[/C][C]0.518518518518518[/C][C]NOK[/C][/ROW]
[ROW][C]5% type I error level[/C][C]17[/C][C]0.62962962962963[/C][C]NOK[/C][/ROW]
[ROW][C]10% type I error level[/C][C]19[/C][C]0.703703703703704[/C][C]NOK[/C][/ROW]
[/TABLE]
Source: https://freestatistics.org/blog/index.php?pk=70143&T=6

Globally Unique Identifier (entire table): ba.freestatistics.org/blog/index.php?pk=70143&T=6

As an alternative you can also use a QR Code:  

The GUIDs for individual cells are displayed in the table below:

Meta Analysis of Goldfeld-Quandt test for Heteroskedasticity
Description# significant tests% significant testsOK/NOK
1% type I error level140.518518518518518NOK
5% type I error level170.62962962962963NOK
10% type I error level190.703703703703704NOK


Parameters (Session):
par1 = 1 ; par2 = Include Monthly Dummies ; par3 = Linear Trend ;
Parameters (R input):
par1 = 1 ; par2 = Include Monthly Dummies ; par3 = Linear Trend ;
R code (references can be found in the software module):
library(lattice)
library(lmtest)
n25 <- 25 #minimum number of obs. for Goldfeld-Quandt test
par1 <- as.numeric(par1)
x <- t(y)
k <- length(x[1,])
n <- length(x[,1])
x1 <- cbind(x[,par1], x[,1:k!=par1])
mycolnames <- c(colnames(x)[par1], colnames(x)[1:k!=par1])
colnames(x1) <- mycolnames #colnames(x)[par1]
x <- x1
if (par3 == 'First Differences'){
x2 <- array(0, dim=c(n-1,k), dimnames=list(1:(n-1), paste('(1-B)',colnames(x),sep='')))
for (i in 1:n-1) {
for (j in 1:k) {
x2[i,j] <- x[i+1,j] - x[i,j]
}
}
x <- x2
}
if (par2 == 'Include Monthly Dummies'){
x2 <- array(0, dim=c(n,11), dimnames=list(1:n, paste('M', seq(1:11), sep ='')))
for (i in 1:11){
x2[seq(i,n,12),i] <- 1
}
x <- cbind(x, x2)
}
if (par2 == 'Include Quarterly Dummies'){
x2 <- array(0, dim=c(n,3), dimnames=list(1:n, paste('Q', seq(1:3), sep ='')))
for (i in 1:3){
x2[seq(i,n,4),i] <- 1
}
x <- cbind(x, x2)
}
k <- length(x[1,])
if (par3 == 'Linear Trend'){
x <- cbind(x, c(1:n))
colnames(x)[k+1] <- 't'
}
x
k <- length(x[1,])
df <- as.data.frame(x)
(mylm <- lm(df))
(mysum <- summary(mylm))
if (n > n25) {
kp3 <- k + 3
nmkm3 <- n - k - 3
gqarr <- array(NA, dim=c(nmkm3-kp3+1,3))
numgqtests <- 0
numsignificant1 <- 0
numsignificant5 <- 0
numsignificant10 <- 0
for (mypoint in kp3:nmkm3) {
j <- 0
numgqtests <- numgqtests + 1
for (myalt in c('greater', 'two.sided', 'less')) {
j <- j + 1
gqarr[mypoint-kp3+1,j] <- gqtest(mylm, point=mypoint, alternative=myalt)$p.value
}
if (gqarr[mypoint-kp3+1,2] < 0.01) numsignificant1 <- numsignificant1 + 1
if (gqarr[mypoint-kp3+1,2] < 0.05) numsignificant5 <- numsignificant5 + 1
if (gqarr[mypoint-kp3+1,2] < 0.10) numsignificant10 <- numsignificant10 + 1
}
gqarr
}
bitmap(file='test0.png')
plot(x[,1], type='l', main='Actuals and Interpolation', ylab='value of Actuals and Interpolation (dots)', xlab='time or index')
points(x[,1]-mysum$resid)
grid()
dev.off()
bitmap(file='test1.png')
plot(mysum$resid, type='b', pch=19, main='Residuals', ylab='value of Residuals', xlab='time or index')
grid()
dev.off()
bitmap(file='test2.png')
hist(mysum$resid, main='Residual Histogram', xlab='values of Residuals')
grid()
dev.off()
bitmap(file='test3.png')
densityplot(~mysum$resid,col='black',main='Residual Density Plot', xlab='values of Residuals')
dev.off()
bitmap(file='test4.png')
qqnorm(mysum$resid, main='Residual Normal Q-Q Plot')
qqline(mysum$resid)
grid()
dev.off()
(myerror <- as.ts(mysum$resid))
bitmap(file='test5.png')
dum <- cbind(lag(myerror,k=1),myerror)
dum
dum1 <- dum[2:length(myerror),]
dum1
z <- as.data.frame(dum1)
z
plot(z,main=paste('Residual Lag plot, lowess, and regression line'), ylab='values of Residuals', xlab='lagged values of Residuals')
lines(lowess(z))
abline(lm(z))
grid()
dev.off()
bitmap(file='test6.png')
acf(mysum$resid, lag.max=length(mysum$resid)/2, main='Residual Autocorrelation Function')
grid()
dev.off()
bitmap(file='test7.png')
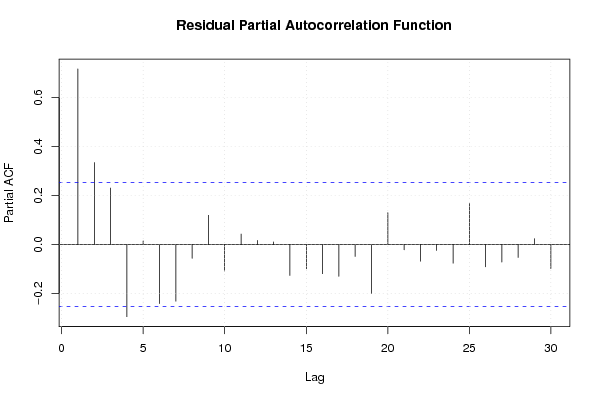
pacf(mysum$resid, lag.max=length(mysum$resid)/2, main='Residual Partial Autocorrelation Function')
grid()
dev.off()
bitmap(file='test8.png')
opar <- par(mfrow = c(2,2), oma = c(0, 0, 1.1, 0))
plot(mylm, las = 1, sub='Residual Diagnostics')
par(opar)
dev.off()
if (n > n25) {
bitmap(file='test9.png')
plot(kp3:nmkm3,gqarr[,2], main='Goldfeld-Quandt test',ylab='2-sided p-value',xlab='breakpoint')
grid()
dev.off()
}
load(file='createtable')
a<-table.start()
a<-table.row.start(a)
a<-table.element(a, 'Multiple Linear Regression - Estimated Regression Equation', 1, TRUE)
a<-table.row.end(a)
myeq <- colnames(x)[1]
myeq <- paste(myeq, '[t] = ', sep='')
for (i in 1:k){
if (mysum$coefficients[i,1] > 0) myeq <- paste(myeq, '+', '')
myeq <- paste(myeq, mysum$coefficients[i,1], sep=' ')
if (rownames(mysum$coefficients)[i] != '(Intercept)') {
myeq <- paste(myeq, rownames(mysum$coefficients)[i], sep='')
if (rownames(mysum$coefficients)[i] != 't') myeq <- paste(myeq, '[t]', sep='')
}
}
myeq <- paste(myeq, ' + e[t]')
a<-table.row.start(a)
a<-table.element(a, myeq)
a<-table.row.end(a)
a<-table.end(a)
table.save(a,file='mytable1.tab')
a<-table.start()
a<-table.row.start(a)
a<-table.element(a,hyperlink('ols1.htm','Multiple Linear Regression - Ordinary Least Squares',''), 6, TRUE)
a<-table.row.end(a)
a<-table.row.start(a)
a<-table.element(a,'Variable',header=TRUE)
a<-table.element(a,'Parameter',header=TRUE)
a<-table.element(a,'S.D.',header=TRUE)
a<-table.element(a,'T-STAT
H0: parameter = 0',header=TRUE)
a<-table.element(a,'2-tail p-value',header=TRUE)
a<-table.element(a,'1-tail p-value',header=TRUE)
a<-table.row.end(a)
for (i in 1:k){
a<-table.row.start(a)
a<-table.element(a,rownames(mysum$coefficients)[i],header=TRUE)
a<-table.element(a,mysum$coefficients[i,1])
a<-table.element(a, round(mysum$coefficients[i,2],6))
a<-table.element(a, round(mysum$coefficients[i,3],4))
a<-table.element(a, round(mysum$coefficients[i,4],6))
a<-table.element(a, round(mysum$coefficients[i,4]/2,6))
a<-table.row.end(a)
}
a<-table.end(a)
table.save(a,file='mytable2.tab')
a<-table.start()
a<-table.row.start(a)
a<-table.element(a, 'Multiple Linear Regression - Regression Statistics', 2, TRUE)
a<-table.row.end(a)
a<-table.row.start(a)
a<-table.element(a, 'Multiple R',1,TRUE)
a<-table.element(a, sqrt(mysum$r.squared))
a<-table.row.end(a)
a<-table.row.start(a)
a<-table.element(a, 'R-squared',1,TRUE)
a<-table.element(a, mysum$r.squared)
a<-table.row.end(a)
a<-table.row.start(a)
a<-table.element(a, 'Adjusted R-squared',1,TRUE)
a<-table.element(a, mysum$adj.r.squared)
a<-table.row.end(a)
a<-table.row.start(a)
a<-table.element(a, 'F-TEST (value)',1,TRUE)
a<-table.element(a, mysum$fstatistic[1])
a<-table.row.end(a)
a<-table.row.start(a)
a<-table.element(a, 'F-TEST (DF numerator)',1,TRUE)
a<-table.element(a, mysum$fstatistic[2])
a<-table.row.end(a)
a<-table.row.start(a)
a<-table.element(a, 'F-TEST (DF denominator)',1,TRUE)
a<-table.element(a, mysum$fstatistic[3])
a<-table.row.end(a)
a<-table.row.start(a)
a<-table.element(a, 'p-value',1,TRUE)
a<-table.element(a, 1-pf(mysum$fstatistic[1],mysum$fstatistic[2],mysum$fstatistic[3]))
a<-table.row.end(a)
a<-table.row.start(a)
a<-table.element(a, 'Multiple Linear Regression - Residual Statistics', 2, TRUE)
a<-table.row.end(a)
a<-table.row.start(a)
a<-table.element(a, 'Residual Standard Deviation',1,TRUE)
a<-table.element(a, mysum$sigma)
a<-table.row.end(a)
a<-table.row.start(a)
a<-table.element(a, 'Sum Squared Residuals',1,TRUE)
a<-table.element(a, sum(myerror*myerror))
a<-table.row.end(a)
a<-table.end(a)
table.save(a,file='mytable3.tab')
a<-table.start()
a<-table.row.start(a)
a<-table.element(a, 'Multiple Linear Regression - Actuals, Interpolation, and Residuals', 4, TRUE)
a<-table.row.end(a)
a<-table.row.start(a)
a<-table.element(a, 'Time or Index', 1, TRUE)
a<-table.element(a, 'Actuals', 1, TRUE)
a<-table.element(a, 'Interpolation
Forecast', 1, TRUE)
a<-table.element(a, 'Residuals
Prediction Error', 1, TRUE)
a<-table.row.end(a)
for (i in 1:n) {
a<-table.row.start(a)
a<-table.element(a,i, 1, TRUE)
a<-table.element(a,x[i])
a<-table.element(a,x[i]-mysum$resid[i])
a<-table.element(a,mysum$resid[i])
a<-table.row.end(a)
}
a<-table.end(a)
table.save(a,file='mytable4.tab')
if (n > n25) {
a<-table.start()
a<-table.row.start(a)
a<-table.element(a,'Goldfeld-Quandt test for Heteroskedasticity',4,TRUE)
a<-table.row.end(a)
a<-table.row.start(a)
a<-table.element(a,'p-values',header=TRUE)
a<-table.element(a,'Alternative Hypothesis',3,header=TRUE)
a<-table.row.end(a)
a<-table.row.start(a)
a<-table.element(a,'breakpoint index',header=TRUE)
a<-table.element(a,'greater',header=TRUE)
a<-table.element(a,'2-sided',header=TRUE)
a<-table.element(a,'less',header=TRUE)
a<-table.row.end(a)
for (mypoint in kp3:nmkm3) {
a<-table.row.start(a)
a<-table.element(a,mypoint,header=TRUE)
a<-table.element(a,gqarr[mypoint-kp3+1,1])
a<-table.element(a,gqarr[mypoint-kp3+1,2])
a<-table.element(a,gqarr[mypoint-kp3+1,3])
a<-table.row.end(a)
}
a<-table.end(a)
table.save(a,file='mytable5.tab')
a<-table.start()
a<-table.row.start(a)
a<-table.element(a,'Meta Analysis of Goldfeld-Quandt test for Heteroskedasticity',4,TRUE)
a<-table.row.end(a)
a<-table.row.start(a)
a<-table.element(a,'Description',header=TRUE)
a<-table.element(a,'# significant tests',header=TRUE)
a<-table.element(a,'% significant tests',header=TRUE)
a<-table.element(a,'OK/NOK',header=TRUE)
a<-table.row.end(a)
a<-table.row.start(a)
a<-table.element(a,'1% type I error level',header=TRUE)
a<-table.element(a,numsignificant1)
a<-table.element(a,numsignificant1/numgqtests)
if (numsignificant1/numgqtests < 0.01) dum <- 'OK' else dum <- 'NOK'
a<-table.element(a,dum)
a<-table.row.end(a)
a<-table.row.start(a)
a<-table.element(a,'5% type I error level',header=TRUE)
a<-table.element(a,numsignificant5)
a<-table.element(a,numsignificant5/numgqtests)
if (numsignificant5/numgqtests < 0.05) dum <- 'OK' else dum <- 'NOK'
a<-table.element(a,dum)
a<-table.row.end(a)
a<-table.row.start(a)
a<-table.element(a,'10% type I error level',header=TRUE)
a<-table.element(a,numsignificant10)
a<-table.element(a,numsignificant10/numgqtests)
if (numsignificant10/numgqtests < 0.1) dum <- 'OK' else dum <- 'NOK'
a<-table.element(a,dum)
a<-table.row.end(a)
a<-table.end(a)
table.save(a,file='mytable6.tab')
}