| Multiple Linear Regression - Estimated Regression Equation |
| Y[t] = -0.292849249941967 + 0.0134244026370332X[t] + 1.08350167270624Y1[t] -0.133309614940154Y2[t] -0.137399955322172M1[t] -0.0238083435085413M2[t] -0.0357127578837311M3[t] -0.044701180135979M4[t] -0.0788911693856083M5[t] + 0.0109118261505348M6[t] -0.0355533832106162M7[t] -0.0810949181381833M8[t] -0.0331665972168241M9[t] + 0.103802503434295M10[t] -0.0288910987831445M11[t] + 0.00270333617091151t + e[t] |
| Multiple Linear Regression - Ordinary Least Squares | |||||
| Variable | Parameter | S.D. | T-STAT H0: parameter = 0 | 2-tail p-value | 1-tail p-value |
| (Intercept) | -0.292849249941967 | 0.45343 | -0.6459 | 0.522063 | 0.261031 |
| X | 0.0134244026370332 | 0.008012 | 1.6756 | 0.101622 | 0.050811 |
| Y1 | 1.08350167270624 | 0.081233 | 13.3382 | 0 | 0 |
| Y2 | -0.133309614940154 | 0.112632 | -1.1836 | 0.243564 | 0.121782 |
| M1 | -0.137399955322172 | 0.275986 | -0.4979 | 0.621315 | 0.310658 |
| M2 | -0.0238083435085413 | 0.275796 | -0.0863 | 0.931638 | 0.465819 |
| M3 | -0.0357127578837311 | 0.275814 | -0.1295 | 0.897626 | 0.448813 |
| M4 | -0.044701180135979 | 0.276692 | -0.1616 | 0.872469 | 0.436235 |
| M5 | -0.0788911693856083 | 0.275954 | -0.2859 | 0.776441 | 0.388221 |
| M6 | 0.0109118261505348 | 0.276434 | 0.0395 | 0.968709 | 0.484355 |
| M7 | -0.0355533832106162 | 0.276285 | -0.1287 | 0.898253 | 0.449126 |
| M8 | -0.0810949181381833 | 0.276625 | -0.2932 | 0.770916 | 0.385458 |
| M9 | -0.0331665972168241 | 0.290904 | -0.114 | 0.909799 | 0.454899 |
| M10 | 0.103802503434295 | 0.290052 | 0.3579 | 0.722318 | 0.361159 |
| M11 | -0.0288910987831445 | 0.290153 | -0.0996 | 0.921181 | 0.460591 |
| t | 0.00270333617091151 | 0.004263 | 0.6341 | 0.529645 | 0.264823 |
| Multiple Linear Regression - Regression Statistics | |
| Multiple R | 0.967121489718825 |
| R-squared | 0.935323975875959 |
| Adjusted R-squared | 0.911070466829444 |
| F-TEST (value) | 38.5644804668107 |
| F-TEST (DF numerator) | 15 |
| F-TEST (DF denominator) | 40 |
| p-value | 0 |
| Multiple Linear Regression - Residual Statistics | |
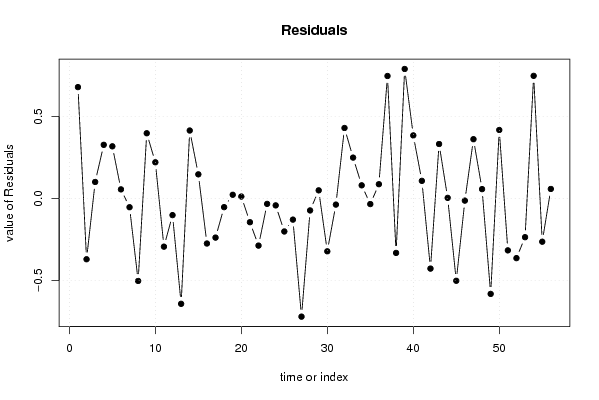
| Residual Standard Deviation | 0.410025249215748 |
| Sum Squared Residuals | 6.72482819977743 |
| Multiple Linear Regression - Actuals, Interpolation, and Residuals | |||
| Time or Index | Actuals | Interpolation Forecast | Residuals Prediction Error |
| 1 | 3.2 | 2.52181716115134 | 0.678182838848662 |
| 2 | 2.8 | 3.17027898135704 | -0.370278981357045 |
| 3 | 2.8 | 2.69957942967552 | 0.100420570324478 |
| 4 | 3 | 2.67334462192467 | 0.326655378075332 |
| 5 | 3.1 | 2.7825064140712 | 0.317493585928802 |
| 6 | 3.1 | 3.04474140060716 | 0.0552585993928412 |
| 7 | 3 | 3.05333469770135 | -0.0533346977013491 |
| 8 | 2.4 | 2.90233321396010 | -0.502333213960105 |
| 9 | 2.7 | 2.30295730857165 | 0.397042691428352 |
| 10 | 3 | 2.77976220957888 | 0.220237790421119 |
| 11 | 2.7 | 2.99352316789305 | -0.293523167893054 |
| 12 | 2.7 | 2.80153191421858 | -0.101531914218584 |
| 13 | 2 | 2.64160925348601 | -0.641609253486014 |
| 14 | 2.4 | 1.98630895136821 | 0.413691048631793 |
| 15 | 2.6 | 2.45318630725588 | 0.146813692744122 |
| 16 | 2.4 | 2.67434107782542 | -0.274341077825417 |
| 17 | 2.3 | 2.53826498435541 | -0.238264984355405 |
| 18 | 2.4 | 2.45298801965133 | -0.0529880196513338 |
| 19 | 2.5 | 2.47748998810665 | 0.0225100118933455 |
| 20 | 2.6 | 2.5884580433005 | 0.0115419566994995 |
| 21 | 2.6 | 2.74466154599297 | -0.144661545992971 |
| 22 | 2.6 | 2.88711230448543 | -0.287112304485426 |
| 23 | 2.7 | 2.73305155483526 | -0.033051554835256 |
| 24 | 2.8 | 2.84221347213778 | -0.0422134721377779 |
| 25 | 2.6 | 2.80110017735640 | -0.201100177356405 |
| 26 | 2.6 | 2.72888603633747 | -0.128886036337468 |
| 27 | 2 | 2.71977839927621 | -0.719778399276208 |
| 28 | 2 | 2.07288283256007 | -0.0728828325600675 |
| 29 | 2.1 | 2.05060637904124 | 0.0493936209587626 |
| 30 | 1.9 | 2.22192919221744 | -0.321929192217443 |
| 31 | 2 | 2.03742543265894 | -0.0374254326589376 |
| 32 | 2.5 | 2.07071883484403 | 0.429281165155973 |
| 33 | 2.9 | 2.65111280705911 | 0.248887192940894 |
| 34 | 3.3 | 3.21997170988649 | 0.0800282901135123 |
| 35 | 3.5 | 3.5342150761751 | -0.0342150761751004 |
| 36 | 3.8 | 3.71317015767292 | 0.0868298423270787 |
| 37 | 4.6 | 3.85422751514858 | 0.745772484851418 |
| 38 | 4.4 | 4.73164478503763 | -0.331644785037625 |
| 39 | 5.3 | 4.51130001563295 | 0.788699984367051 |
| 40 | 5.8 | 5.41600962575852 | 0.383990374241477 |
| 41 | 5.9 | 5.79277731180674 | 0.107222688193265 |
| 42 | 5.6 | 6.02700793509096 | -0.427007935090962 |
| 43 | 5.8 | 5.46841001293014 | 0.331589987069861 |
| 44 | 5.5 | 5.49641336568616 | 0.00358663431384228 |
| 45 | 4.6 | 5.10126833837627 | -0.501268338376275 |
| 46 | 4.2 | 4.21315377604920 | -0.0131537760492046 |
| 47 | 4 | 3.63921020109659 | 0.36078979890341 |
| 48 | 3.5 | 3.44308445597072 | 0.0569155440292828 |
| 49 | 2.3 | 2.88124589285766 | -0.581245892857662 |
| 50 | 2.2 | 1.78288124589966 | 0.417118754100345 |
| 51 | 1.4 | 1.71615584815944 | -0.316155848159444 |
| 52 | 0.6 | 0.963421841931324 | -0.363421841931324 |
| 53 | 0 | 0.235844910725424 | -0.235844910725424 |
| 54 | 0.5 | -0.246666547566898 | 0.746666547566898 |
| 55 | 0.1 | 0.36333986860292 | -0.26333986860292 |
| 56 | 0.1 | 0.0420765422092107 | 0.0579234577907893 |
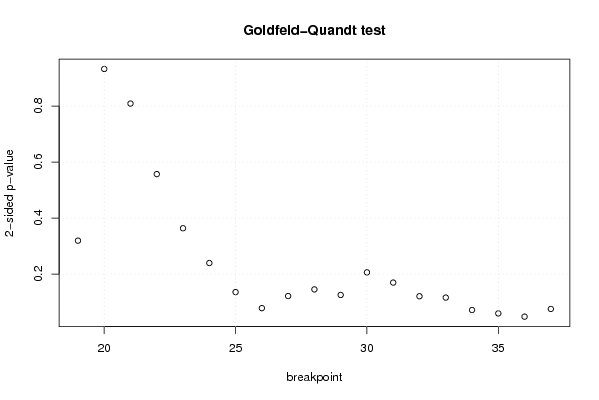
| Goldfeld-Quandt test for Heteroskedasticity | |||
| p-values | Alternative Hypothesis | ||
| breakpoint index | greater | 2-sided | less |
| 19 | 0.159726064873817 | 0.319452129747634 | 0.840273935126183 |
| 20 | 0.466394852519498 | 0.932789705038995 | 0.533605147480502 |
| 21 | 0.404551097718805 | 0.809102195437609 | 0.595448902281196 |
| 22 | 0.278577470349728 | 0.557154940699455 | 0.721422529650272 |
| 23 | 0.181884435691012 | 0.363768871382024 | 0.818115564308988 |
| 24 | 0.119796319490527 | 0.239592638981055 | 0.880203680509473 |
| 25 | 0.0678598887717862 | 0.135719777543572 | 0.932140111228214 |
| 26 | 0.0391944554640345 | 0.078388910928069 | 0.960805544535966 |
| 27 | 0.060765165905267 | 0.121530331810534 | 0.939234834094733 |
| 28 | 0.0726587429840925 | 0.145317485968185 | 0.927341257015908 |
| 29 | 0.062739085672566 | 0.125478171345132 | 0.937260914327434 |
| 30 | 0.103109844610781 | 0.206219689221562 | 0.896890155389219 |
| 31 | 0.0848180143884671 | 0.169636028776934 | 0.915181985611533 |
| 32 | 0.0604213967120436 | 0.120842793424087 | 0.939578603287956 |
| 33 | 0.0580151615352357 | 0.116030323070471 | 0.941984838464764 |
| 34 | 0.0358185585759848 | 0.0716371171519696 | 0.964181441424015 |
| 35 | 0.0297551638814811 | 0.0595103277629621 | 0.97024483611852 |
| 36 | 0.0239739836268635 | 0.047947967253727 | 0.976026016373136 |
| 37 | 0.0377367601647321 | 0.0754735203294642 | 0.962263239835268 |
| Meta Analysis of Goldfeld-Quandt test for Heteroskedasticity | |||
| Description | # significant tests | % significant tests | OK/NOK |
| 1% type I error level | 0 | 0 | OK |
| 5% type I error level | 1 | 0.0526315789473684 | NOK |
| 10% type I error level | 5 | 0.263157894736842 | NOK |