Free Statistics

of Irreproducible Research!

Author's title

Author*Unverified author*
R Software Modulerwasp_multipleregression.wasp
Title produced by softwareMultiple Regression
Date of computationMon, 21 Dec 2009 05:18:08 -0700
Cite this page as followsStatistical Computations at FreeStatistics.org, Office for Research Development and Education, URL https://freestatistics.org/blog/index.php?v=date/2009/Dec/21/t1261398160n7jh4eenbwvtgzc.htm/, Retrieved Sun, 05 May 2024 09:41:19 +0000
Statistical Computations at FreeStatistics.org, Office for Research Development and Education, URL https://freestatistics.org/blog/index.php?pk=70127, Retrieved Sun, 05 May 2024 09:41:19 +0000
QR Codes:

Original text written by user:
IsPrivate?No (this computation is public)
User-defined keywords
Estimated Impact183
Family? (F = Feedback message, R = changed R code, M = changed R Module, P = changed Parameters, D = changed Data)
-     [Multiple Regression] [Dow Jones and Dummy] [2008-12-13 13:10:09] [a1024b375232228f065c2de1e1d1e03d]
-    D  [Multiple Regression] [Bel20 dummy febr] [2008-12-17 09:21:24] [1dc7b54f2fa28720a65b8f3f53c2ed9f]
- RM        [Multiple Regression] [] [2009-12-21 12:18:08] [ce16745b5fa1a53fd3d9c8db848c7076] [Current]
-   P         [Multiple Regression] [] [2009-12-21 13:27:31] [8eb28aba8de3868ee2c810eecf1cb9a8]
Feedback Forum

Post a new message
Dataseries X:
2350.44	0
2440.25	0
2408.64	0
2472.81	0
2407.6	0
2454.62	0
2448.05	0
2497.84	0
2645.64	0
2756.76	0
2849.27	0
2921.44	0
2981.85	0
3080.58	0
3106.22	0
3119.31	0
3061.26	0
3097.31	0
3161.69	0
3257.16	0
3277.01	0
3295.32	0
3363.99	0
3494.17	0
3667.03	0
3813.06	0
3917.96	0
3895.51	0
3801.06	0
3570.12	0
3701.61	0
3862.27	0
3970.1	0
4138.52	0
4199.75	0
4290.89	0
4443.91	0
4502.64	1
4356.98	1
4591.27	1
4696.96	1
4621.4	1
4562.84	1
4202.52	1
4296.49	1
4435.23	1
4105.18	1
4116.68	1
3844.49	1
3720.98	1
3674.4	1
3857.62	1
3801.06	1
3504.37	1
3032.6	1
3047.03	1
2962.34	1
2197.82	1
2014.45	1


Summary of computational transaction
Raw Inputview raw input (R code)
Raw Outputview raw output of R engine
Computing time4 seconds
R Server'Gwilym Jenkins' @ 72.249.127.135

\begin{tabular}{lllllllll}
\hline
Summary of computational transaction \tabularnewline
Raw Input & view raw input (R code)  \tabularnewline
Raw Output & view raw output of R engine  \tabularnewline
Computing time & 4 seconds \tabularnewline
R Server & 'Gwilym Jenkins' @ 72.249.127.135 \tabularnewline
\hline
\end{tabular}
%Source: https://freestatistics.org/blog/index.php?pk=70127&T=0

[TABLE]
[ROW][C]Summary of computational transaction[/C][/ROW]
[ROW][C]Raw Input[/C][C]view raw input (R code) [/C][/ROW]
[ROW][C]Raw Output[/C][C]view raw output of R engine [/C][/ROW]
[ROW][C]Computing time[/C][C]4 seconds[/C][/ROW]
[ROW][C]R Server[/C][C]'Gwilym Jenkins' @ 72.249.127.135[/C][/ROW]
[/TABLE]
Source: https://freestatistics.org/blog/index.php?pk=70127&T=0

Globally Unique Identifier (entire table): ba.freestatistics.org/blog/index.php?pk=70127&T=0

As an alternative you can also use a QR Code:  

The GUIDs for individual cells are displayed in the table below:

Summary of computational transaction
Raw Inputview raw input (R code)
Raw Outputview raw output of R engine
Computing time4 seconds
R Server'Gwilym Jenkins' @ 72.249.127.135


Multiple Linear Regression - Estimated Regression Equation
Bel20[t] = + 3249.21675675676 + 575.571879606879Dummy[t] + e[t]

\begin{tabular}{lllllllll}
\hline
Multiple Linear Regression - Estimated Regression Equation \tabularnewline
Bel20[t] =  +  3249.21675675676 +  575.571879606879Dummy[t]  + e[t] \tabularnewline
\hline
\end{tabular}
%Source: https://freestatistics.org/blog/index.php?pk=70127&T=1

[TABLE]
[ROW][C]Multiple Linear Regression - Estimated Regression Equation[/C][/ROW]
[ROW][C]Bel20[t] =  +  3249.21675675676 +  575.571879606879Dummy[t]  + e[t][/C][/ROW]
[/TABLE]
Source: https://freestatistics.org/blog/index.php?pk=70127&T=1

Globally Unique Identifier (entire table): ba.freestatistics.org/blog/index.php?pk=70127&T=1

As an alternative you can also use a QR Code:  

The GUIDs for individual cells are displayed in the table below:

Multiple Linear Regression - Estimated Regression Equation
Bel20[t] = + 3249.21675675676 + 575.571879606879Dummy[t] + e[t]


Multiple Linear Regression - Ordinary Least Squares
VariableParameterS.D.T-STATH0: parameter = 02-tail p-value1-tail p-value
(Intercept)3249.21675675676110.50510729.403300
Dummy575.571879606879180.9660113.18060.0023780.001189

\begin{tabular}{lllllllll}
\hline
Multiple Linear Regression - Ordinary Least Squares \tabularnewline
Variable & Parameter & S.D. & T-STATH0: parameter = 0 & 2-tail p-value & 1-tail p-value \tabularnewline
(Intercept) & 3249.21675675676 & 110.505107 & 29.4033 & 0 & 0 \tabularnewline
Dummy & 575.571879606879 & 180.966011 & 3.1806 & 0.002378 & 0.001189 \tabularnewline
\hline
\end{tabular}
%Source: https://freestatistics.org/blog/index.php?pk=70127&T=2

[TABLE]
[ROW][C]Multiple Linear Regression - Ordinary Least Squares[/C][/ROW]
[ROW][C]Variable[/C][C]Parameter[/C][C]S.D.[/C][C]T-STATH0: parameter = 0[/C][C]2-tail p-value[/C][C]1-tail p-value[/C][/ROW]
[ROW][C](Intercept)[/C][C]3249.21675675676[/C][C]110.505107[/C][C]29.4033[/C][C]0[/C][C]0[/C][/ROW]
[ROW][C]Dummy[/C][C]575.571879606879[/C][C]180.966011[/C][C]3.1806[/C][C]0.002378[/C][C]0.001189[/C][/ROW]
[/TABLE]
Source: https://freestatistics.org/blog/index.php?pk=70127&T=2

Globally Unique Identifier (entire table): ba.freestatistics.org/blog/index.php?pk=70127&T=2

As an alternative you can also use a QR Code:  

The GUIDs for individual cells are displayed in the table below:

Multiple Linear Regression - Ordinary Least Squares
VariableParameterS.D.T-STATH0: parameter = 02-tail p-value1-tail p-value
(Intercept)3249.21675675676110.50510729.403300
Dummy575.571879606879180.9660113.18060.0023780.001189


Multiple Linear Regression - Regression Statistics
Multiple R0.388230633971951
R-squared0.150723025154263
Adjusted R-squared0.135823429104337
F-TEST (value)10.1159135220326
F-TEST (DF numerator)1
F-TEST (DF denominator)57
p-value0.00237838263792423
Multiple Linear Regression - Residual Statistics
Residual Standard Deviation672.176322477571
Sum Squared Residuals25753797.4844699

\begin{tabular}{lllllllll}
\hline
Multiple Linear Regression - Regression Statistics \tabularnewline
Multiple R & 0.388230633971951 \tabularnewline
R-squared & 0.150723025154263 \tabularnewline
Adjusted R-squared & 0.135823429104337 \tabularnewline
F-TEST (value) & 10.1159135220326 \tabularnewline
F-TEST (DF numerator) & 1 \tabularnewline
F-TEST (DF denominator) & 57 \tabularnewline
p-value & 0.00237838263792423 \tabularnewline
Multiple Linear Regression - Residual Statistics \tabularnewline
Residual Standard Deviation & 672.176322477571 \tabularnewline
Sum Squared Residuals & 25753797.4844699 \tabularnewline
\hline
\end{tabular}
%Source: https://freestatistics.org/blog/index.php?pk=70127&T=3

[TABLE]
[ROW][C]Multiple Linear Regression - Regression Statistics[/C][/ROW]
[ROW][C]Multiple R[/C][C]0.388230633971951[/C][/ROW]
[ROW][C]R-squared[/C][C]0.150723025154263[/C][/ROW]
[ROW][C]Adjusted R-squared[/C][C]0.135823429104337[/C][/ROW]
[ROW][C]F-TEST (value)[/C][C]10.1159135220326[/C][/ROW]
[ROW][C]F-TEST (DF numerator)[/C][C]1[/C][/ROW]
[ROW][C]F-TEST (DF denominator)[/C][C]57[/C][/ROW]
[ROW][C]p-value[/C][C]0.00237838263792423[/C][/ROW]
[ROW][C]Multiple Linear Regression - Residual Statistics[/C][/ROW]
[ROW][C]Residual Standard Deviation[/C][C]672.176322477571[/C][/ROW]
[ROW][C]Sum Squared Residuals[/C][C]25753797.4844699[/C][/ROW]
[/TABLE]
Source: https://freestatistics.org/blog/index.php?pk=70127&T=3

Globally Unique Identifier (entire table): ba.freestatistics.org/blog/index.php?pk=70127&T=3

As an alternative you can also use a QR Code:  

The GUIDs for individual cells are displayed in the table below:

Multiple Linear Regression - Regression Statistics
Multiple R0.388230633971951
R-squared0.150723025154263
Adjusted R-squared0.135823429104337
F-TEST (value)10.1159135220326
F-TEST (DF numerator)1
F-TEST (DF denominator)57
p-value0.00237838263792423
Multiple Linear Regression - Residual Statistics
Residual Standard Deviation672.176322477571
Sum Squared Residuals25753797.4844699


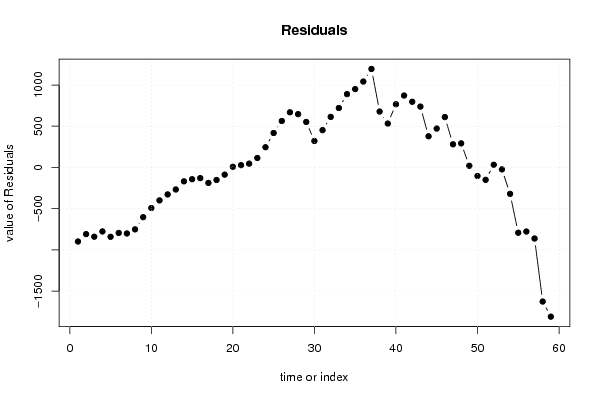
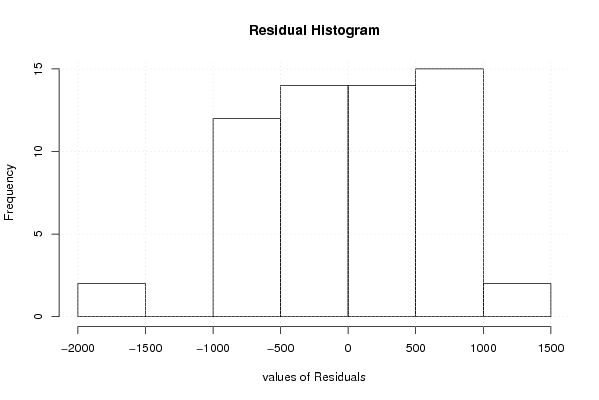
Multiple Linear Regression - Actuals, Interpolation, and Residuals
Time or IndexActualsInterpolationForecastResidualsPrediction Error
12350.443249.21675675675-898.776756756754
22440.253249.21675675676-808.966756756756
32408.643249.21675675676-840.576756756757
42472.813249.21675675676-776.406756756757
52407.63249.21675675676-841.616756756757
62454.623249.21675675676-794.596756756757
72448.053249.21675675676-801.166756756757
82497.843249.21675675676-751.376756756757
92645.643249.21675675676-603.576756756757
102756.763249.21675675676-492.456756756757
112849.273249.21675675676-399.946756756757
122921.443249.21675675676-327.776756756757
132981.853249.21675675676-267.366756756757
143080.583249.21675675676-168.636756756757
153106.223249.21675675676-142.996756756757
163119.313249.21675675676-129.906756756757
173061.263249.21675675676-187.956756756757
183097.313249.21675675676-151.906756756757
193161.693249.21675675676-87.5267567567569
203257.163249.216756756767.94324324324292
213277.013249.2167567567627.7932432432433
223295.323249.2167567567646.1032432432432
233363.993249.21675675676114.773243243243
243494.173249.21675675676244.953243243243
253667.033249.21675675676417.813243243243
263813.063249.21675675676563.843243243243
273917.963249.21675675676668.743243243243
283895.513249.21675675676646.293243243243
293801.063249.21675675676551.843243243243
303570.123249.21675675676320.903243243243
313701.613249.21675675676452.393243243243
323862.273249.21675675676613.053243243243
333970.13249.21675675676720.883243243243
344138.523249.21675675676889.303243243244
354199.753249.21675675676950.533243243243
364290.893249.216756756761041.67324324324
374443.913249.216756756761194.69324324324
384502.643824.78863636364677.851363636364
394356.983824.78863636364532.191363636363
404591.273824.78863636364766.481363636364
414696.963824.78863636364872.171363636364
424621.43824.78863636364796.611363636363
434562.843824.78863636364738.051363636364
444202.523824.78863636364377.731363636364
454296.493824.78863636364471.701363636363
464435.233824.78863636364610.441363636363
474105.183824.78863636364280.391363636364
484116.683824.78863636364291.891363636364
493844.493824.7886363636419.7013636363634
503720.983824.78863636364-103.808636363636
513674.43824.78863636364-150.388636363636
523857.623824.7886363636432.8313636363635
533801.063824.78863636364-23.7286363636364
543504.373824.78863636364-320.418636363636
553032.63824.78863636364-792.188636363637
563047.033824.78863636364-777.758636363636
572962.343824.78863636364-862.448636363636
582197.823824.78863636364-1626.96863636364
592014.453824.78863636364-1810.33863636364

\begin{tabular}{lllllllll}
\hline
Multiple Linear Regression - Actuals, Interpolation, and Residuals \tabularnewline
Time or Index & Actuals & InterpolationForecast & ResidualsPrediction Error \tabularnewline
1 & 2350.44 & 3249.21675675675 & -898.776756756754 \tabularnewline
2 & 2440.25 & 3249.21675675676 & -808.966756756756 \tabularnewline
3 & 2408.64 & 3249.21675675676 & -840.576756756757 \tabularnewline
4 & 2472.81 & 3249.21675675676 & -776.406756756757 \tabularnewline
5 & 2407.6 & 3249.21675675676 & -841.616756756757 \tabularnewline
6 & 2454.62 & 3249.21675675676 & -794.596756756757 \tabularnewline
7 & 2448.05 & 3249.21675675676 & -801.166756756757 \tabularnewline
8 & 2497.84 & 3249.21675675676 & -751.376756756757 \tabularnewline
9 & 2645.64 & 3249.21675675676 & -603.576756756757 \tabularnewline
10 & 2756.76 & 3249.21675675676 & -492.456756756757 \tabularnewline
11 & 2849.27 & 3249.21675675676 & -399.946756756757 \tabularnewline
12 & 2921.44 & 3249.21675675676 & -327.776756756757 \tabularnewline
13 & 2981.85 & 3249.21675675676 & -267.366756756757 \tabularnewline
14 & 3080.58 & 3249.21675675676 & -168.636756756757 \tabularnewline
15 & 3106.22 & 3249.21675675676 & -142.996756756757 \tabularnewline
16 & 3119.31 & 3249.21675675676 & -129.906756756757 \tabularnewline
17 & 3061.26 & 3249.21675675676 & -187.956756756757 \tabularnewline
18 & 3097.31 & 3249.21675675676 & -151.906756756757 \tabularnewline
19 & 3161.69 & 3249.21675675676 & -87.5267567567569 \tabularnewline
20 & 3257.16 & 3249.21675675676 & 7.94324324324292 \tabularnewline
21 & 3277.01 & 3249.21675675676 & 27.7932432432433 \tabularnewline
22 & 3295.32 & 3249.21675675676 & 46.1032432432432 \tabularnewline
23 & 3363.99 & 3249.21675675676 & 114.773243243243 \tabularnewline
24 & 3494.17 & 3249.21675675676 & 244.953243243243 \tabularnewline
25 & 3667.03 & 3249.21675675676 & 417.813243243243 \tabularnewline
26 & 3813.06 & 3249.21675675676 & 563.843243243243 \tabularnewline
27 & 3917.96 & 3249.21675675676 & 668.743243243243 \tabularnewline
28 & 3895.51 & 3249.21675675676 & 646.293243243243 \tabularnewline
29 & 3801.06 & 3249.21675675676 & 551.843243243243 \tabularnewline
30 & 3570.12 & 3249.21675675676 & 320.903243243243 \tabularnewline
31 & 3701.61 & 3249.21675675676 & 452.393243243243 \tabularnewline
32 & 3862.27 & 3249.21675675676 & 613.053243243243 \tabularnewline
33 & 3970.1 & 3249.21675675676 & 720.883243243243 \tabularnewline
34 & 4138.52 & 3249.21675675676 & 889.303243243244 \tabularnewline
35 & 4199.75 & 3249.21675675676 & 950.533243243243 \tabularnewline
36 & 4290.89 & 3249.21675675676 & 1041.67324324324 \tabularnewline
37 & 4443.91 & 3249.21675675676 & 1194.69324324324 \tabularnewline
38 & 4502.64 & 3824.78863636364 & 677.851363636364 \tabularnewline
39 & 4356.98 & 3824.78863636364 & 532.191363636363 \tabularnewline
40 & 4591.27 & 3824.78863636364 & 766.481363636364 \tabularnewline
41 & 4696.96 & 3824.78863636364 & 872.171363636364 \tabularnewline
42 & 4621.4 & 3824.78863636364 & 796.611363636363 \tabularnewline
43 & 4562.84 & 3824.78863636364 & 738.051363636364 \tabularnewline
44 & 4202.52 & 3824.78863636364 & 377.731363636364 \tabularnewline
45 & 4296.49 & 3824.78863636364 & 471.701363636363 \tabularnewline
46 & 4435.23 & 3824.78863636364 & 610.441363636363 \tabularnewline
47 & 4105.18 & 3824.78863636364 & 280.391363636364 \tabularnewline
48 & 4116.68 & 3824.78863636364 & 291.891363636364 \tabularnewline
49 & 3844.49 & 3824.78863636364 & 19.7013636363634 \tabularnewline
50 & 3720.98 & 3824.78863636364 & -103.808636363636 \tabularnewline
51 & 3674.4 & 3824.78863636364 & -150.388636363636 \tabularnewline
52 & 3857.62 & 3824.78863636364 & 32.8313636363635 \tabularnewline
53 & 3801.06 & 3824.78863636364 & -23.7286363636364 \tabularnewline
54 & 3504.37 & 3824.78863636364 & -320.418636363636 \tabularnewline
55 & 3032.6 & 3824.78863636364 & -792.188636363637 \tabularnewline
56 & 3047.03 & 3824.78863636364 & -777.758636363636 \tabularnewline
57 & 2962.34 & 3824.78863636364 & -862.448636363636 \tabularnewline
58 & 2197.82 & 3824.78863636364 & -1626.96863636364 \tabularnewline
59 & 2014.45 & 3824.78863636364 & -1810.33863636364 \tabularnewline
\hline
\end{tabular}
%Source: https://freestatistics.org/blog/index.php?pk=70127&T=4

[TABLE]
[ROW][C]Multiple Linear Regression - Actuals, Interpolation, and Residuals[/C][/ROW]
[ROW][C]Time or Index[/C][C]Actuals[/C][C]InterpolationForecast[/C][C]ResidualsPrediction Error[/C][/ROW]
[ROW][C]1[/C][C]2350.44[/C][C]3249.21675675675[/C][C]-898.776756756754[/C][/ROW]
[ROW][C]2[/C][C]2440.25[/C][C]3249.21675675676[/C][C]-808.966756756756[/C][/ROW]
[ROW][C]3[/C][C]2408.64[/C][C]3249.21675675676[/C][C]-840.576756756757[/C][/ROW]
[ROW][C]4[/C][C]2472.81[/C][C]3249.21675675676[/C][C]-776.406756756757[/C][/ROW]
[ROW][C]5[/C][C]2407.6[/C][C]3249.21675675676[/C][C]-841.616756756757[/C][/ROW]
[ROW][C]6[/C][C]2454.62[/C][C]3249.21675675676[/C][C]-794.596756756757[/C][/ROW]
[ROW][C]7[/C][C]2448.05[/C][C]3249.21675675676[/C][C]-801.166756756757[/C][/ROW]
[ROW][C]8[/C][C]2497.84[/C][C]3249.21675675676[/C][C]-751.376756756757[/C][/ROW]
[ROW][C]9[/C][C]2645.64[/C][C]3249.21675675676[/C][C]-603.576756756757[/C][/ROW]
[ROW][C]10[/C][C]2756.76[/C][C]3249.21675675676[/C][C]-492.456756756757[/C][/ROW]
[ROW][C]11[/C][C]2849.27[/C][C]3249.21675675676[/C][C]-399.946756756757[/C][/ROW]
[ROW][C]12[/C][C]2921.44[/C][C]3249.21675675676[/C][C]-327.776756756757[/C][/ROW]
[ROW][C]13[/C][C]2981.85[/C][C]3249.21675675676[/C][C]-267.366756756757[/C][/ROW]
[ROW][C]14[/C][C]3080.58[/C][C]3249.21675675676[/C][C]-168.636756756757[/C][/ROW]
[ROW][C]15[/C][C]3106.22[/C][C]3249.21675675676[/C][C]-142.996756756757[/C][/ROW]
[ROW][C]16[/C][C]3119.31[/C][C]3249.21675675676[/C][C]-129.906756756757[/C][/ROW]
[ROW][C]17[/C][C]3061.26[/C][C]3249.21675675676[/C][C]-187.956756756757[/C][/ROW]
[ROW][C]18[/C][C]3097.31[/C][C]3249.21675675676[/C][C]-151.906756756757[/C][/ROW]
[ROW][C]19[/C][C]3161.69[/C][C]3249.21675675676[/C][C]-87.5267567567569[/C][/ROW]
[ROW][C]20[/C][C]3257.16[/C][C]3249.21675675676[/C][C]7.94324324324292[/C][/ROW]
[ROW][C]21[/C][C]3277.01[/C][C]3249.21675675676[/C][C]27.7932432432433[/C][/ROW]
[ROW][C]22[/C][C]3295.32[/C][C]3249.21675675676[/C][C]46.1032432432432[/C][/ROW]
[ROW][C]23[/C][C]3363.99[/C][C]3249.21675675676[/C][C]114.773243243243[/C][/ROW]
[ROW][C]24[/C][C]3494.17[/C][C]3249.21675675676[/C][C]244.953243243243[/C][/ROW]
[ROW][C]25[/C][C]3667.03[/C][C]3249.21675675676[/C][C]417.813243243243[/C][/ROW]
[ROW][C]26[/C][C]3813.06[/C][C]3249.21675675676[/C][C]563.843243243243[/C][/ROW]
[ROW][C]27[/C][C]3917.96[/C][C]3249.21675675676[/C][C]668.743243243243[/C][/ROW]
[ROW][C]28[/C][C]3895.51[/C][C]3249.21675675676[/C][C]646.293243243243[/C][/ROW]
[ROW][C]29[/C][C]3801.06[/C][C]3249.21675675676[/C][C]551.843243243243[/C][/ROW]
[ROW][C]30[/C][C]3570.12[/C][C]3249.21675675676[/C][C]320.903243243243[/C][/ROW]
[ROW][C]31[/C][C]3701.61[/C][C]3249.21675675676[/C][C]452.393243243243[/C][/ROW]
[ROW][C]32[/C][C]3862.27[/C][C]3249.21675675676[/C][C]613.053243243243[/C][/ROW]
[ROW][C]33[/C][C]3970.1[/C][C]3249.21675675676[/C][C]720.883243243243[/C][/ROW]
[ROW][C]34[/C][C]4138.52[/C][C]3249.21675675676[/C][C]889.303243243244[/C][/ROW]
[ROW][C]35[/C][C]4199.75[/C][C]3249.21675675676[/C][C]950.533243243243[/C][/ROW]
[ROW][C]36[/C][C]4290.89[/C][C]3249.21675675676[/C][C]1041.67324324324[/C][/ROW]
[ROW][C]37[/C][C]4443.91[/C][C]3249.21675675676[/C][C]1194.69324324324[/C][/ROW]
[ROW][C]38[/C][C]4502.64[/C][C]3824.78863636364[/C][C]677.851363636364[/C][/ROW]
[ROW][C]39[/C][C]4356.98[/C][C]3824.78863636364[/C][C]532.191363636363[/C][/ROW]
[ROW][C]40[/C][C]4591.27[/C][C]3824.78863636364[/C][C]766.481363636364[/C][/ROW]
[ROW][C]41[/C][C]4696.96[/C][C]3824.78863636364[/C][C]872.171363636364[/C][/ROW]
[ROW][C]42[/C][C]4621.4[/C][C]3824.78863636364[/C][C]796.611363636363[/C][/ROW]
[ROW][C]43[/C][C]4562.84[/C][C]3824.78863636364[/C][C]738.051363636364[/C][/ROW]
[ROW][C]44[/C][C]4202.52[/C][C]3824.78863636364[/C][C]377.731363636364[/C][/ROW]
[ROW][C]45[/C][C]4296.49[/C][C]3824.78863636364[/C][C]471.701363636363[/C][/ROW]
[ROW][C]46[/C][C]4435.23[/C][C]3824.78863636364[/C][C]610.441363636363[/C][/ROW]
[ROW][C]47[/C][C]4105.18[/C][C]3824.78863636364[/C][C]280.391363636364[/C][/ROW]
[ROW][C]48[/C][C]4116.68[/C][C]3824.78863636364[/C][C]291.891363636364[/C][/ROW]
[ROW][C]49[/C][C]3844.49[/C][C]3824.78863636364[/C][C]19.7013636363634[/C][/ROW]
[ROW][C]50[/C][C]3720.98[/C][C]3824.78863636364[/C][C]-103.808636363636[/C][/ROW]
[ROW][C]51[/C][C]3674.4[/C][C]3824.78863636364[/C][C]-150.388636363636[/C][/ROW]
[ROW][C]52[/C][C]3857.62[/C][C]3824.78863636364[/C][C]32.8313636363635[/C][/ROW]
[ROW][C]53[/C][C]3801.06[/C][C]3824.78863636364[/C][C]-23.7286363636364[/C][/ROW]
[ROW][C]54[/C][C]3504.37[/C][C]3824.78863636364[/C][C]-320.418636363636[/C][/ROW]
[ROW][C]55[/C][C]3032.6[/C][C]3824.78863636364[/C][C]-792.188636363637[/C][/ROW]
[ROW][C]56[/C][C]3047.03[/C][C]3824.78863636364[/C][C]-777.758636363636[/C][/ROW]
[ROW][C]57[/C][C]2962.34[/C][C]3824.78863636364[/C][C]-862.448636363636[/C][/ROW]
[ROW][C]58[/C][C]2197.82[/C][C]3824.78863636364[/C][C]-1626.96863636364[/C][/ROW]
[ROW][C]59[/C][C]2014.45[/C][C]3824.78863636364[/C][C]-1810.33863636364[/C][/ROW]
[/TABLE]
Source: https://freestatistics.org/blog/index.php?pk=70127&T=4

Globally Unique Identifier (entire table): ba.freestatistics.org/blog/index.php?pk=70127&T=4

As an alternative you can also use a QR Code:  

The GUIDs for individual cells are displayed in the table below:

Multiple Linear Regression - Actuals, Interpolation, and Residuals
Time or IndexActualsInterpolationForecastResidualsPrediction Error
12350.443249.21675675675-898.776756756754
22440.253249.21675675676-808.966756756756
32408.643249.21675675676-840.576756756757
42472.813249.21675675676-776.406756756757
52407.63249.21675675676-841.616756756757
62454.623249.21675675676-794.596756756757
72448.053249.21675675676-801.166756756757
82497.843249.21675675676-751.376756756757
92645.643249.21675675676-603.576756756757
102756.763249.21675675676-492.456756756757
112849.273249.21675675676-399.946756756757
122921.443249.21675675676-327.776756756757
132981.853249.21675675676-267.366756756757
143080.583249.21675675676-168.636756756757
153106.223249.21675675676-142.996756756757
163119.313249.21675675676-129.906756756757
173061.263249.21675675676-187.956756756757
183097.313249.21675675676-151.906756756757
193161.693249.21675675676-87.5267567567569
203257.163249.216756756767.94324324324292
213277.013249.2167567567627.7932432432433
223295.323249.2167567567646.1032432432432
233363.993249.21675675676114.773243243243
243494.173249.21675675676244.953243243243
253667.033249.21675675676417.813243243243
263813.063249.21675675676563.843243243243
273917.963249.21675675676668.743243243243
283895.513249.21675675676646.293243243243
293801.063249.21675675676551.843243243243
303570.123249.21675675676320.903243243243
313701.613249.21675675676452.393243243243
323862.273249.21675675676613.053243243243
333970.13249.21675675676720.883243243243
344138.523249.21675675676889.303243243244
354199.753249.21675675676950.533243243243
364290.893249.216756756761041.67324324324
374443.913249.216756756761194.69324324324
384502.643824.78863636364677.851363636364
394356.983824.78863636364532.191363636363
404591.273824.78863636364766.481363636364
414696.963824.78863636364872.171363636364
424621.43824.78863636364796.611363636363
434562.843824.78863636364738.051363636364
444202.523824.78863636364377.731363636364
454296.493824.78863636364471.701363636363
464435.233824.78863636364610.441363636363
474105.183824.78863636364280.391363636364
484116.683824.78863636364291.891363636364
493844.493824.7886363636419.7013636363634
503720.983824.78863636364-103.808636363636
513674.43824.78863636364-150.388636363636
523857.623824.7886363636432.8313636363635
533801.063824.78863636364-23.7286363636364
543504.373824.78863636364-320.418636363636
553032.63824.78863636364-792.188636363637
563047.033824.78863636364-777.758636363636
572962.343824.78863636364-862.448636363636
582197.823824.78863636364-1626.96863636364
592014.453824.78863636364-1810.33863636364


Goldfeld-Quandt test for Heteroskedasticity
p-valuesAlternative Hypothesis
breakpoint indexgreater2-sidedless
50.0007420199348284890.001484039869656980.999257980065172
66.93450392656692e-050.0001386900785313380.999930654960734
75.74360322489835e-061.14872064497967e-050.999994256396775
81.22675566242444e-062.45351132484888e-060.999998773244338
99.1462552397515e-061.82925104795030e-050.99999085374476
104.53917504165671e-059.07835008331342e-050.999954608249583
110.0001440285300728700.0002880570601457390.999855971469927
120.0003263667915498120.0006527335830996250.99967363320845
130.0005988129302786820.001197625860557360.999401187069721
140.001216599605320630.002433199210641260.99878340039468
150.001838659744099280.003677319488198560.9981613402559
160.002286044124416380.004572088248832770.997713955875584
170.002105875512450530.004211751024901070.99789412448755
180.002017432077243340.004034864154486680.997982567922757
190.002145377317032320.004290754634064650.997854622682968
200.002693032401771480.005386064803542970.997306967598228
210.003196481334561570.006392962669123130.996803518665438
220.003653705198435560.007307410396871120.996346294801564
230.004485615137351520.008971230274703050.995514384862648
240.006567218917225910.01313443783445180.993432781082774
250.01192386841706540.02384773683413070.988076131582935
260.02302042926114090.04604085852228180.97697957073886
270.04116615644940150.08233231289880310.958833843550599
280.05675757319175310.1135151463835060.943242426808247
290.06237400292352250.1247480058470450.937625997076478
300.05673898778218050.1134779755643610.94326101221782
310.05484657643848810.1096931528769760.945153423561512
320.05764685538408010.1152937107681600.94235314461592
330.06305552940643610.1261110588128720.936944470593564
340.07456309301243660.1491261860248730.925436906987563
350.08561718429514350.1712343685902870.914382815704857
360.09792204146395250.1958440829279050.902077958536047
370.1160353829932070.2320707659864150.883964617006793
380.09840360429378250.1968072085875650.901596395706218
390.0784914361344260.1569828722688520.921508563865574
400.0737102448621850.147420489724370.926289755137815
410.08101128381779530.1620225676355910.918988716182205
420.0894367537846220.1788735075692440.910563246215378
430.1021191249587170.2042382499174340.897880875041283
440.09294917072327830.1858983414465570.907050829276722
450.0948740119932730.1897480239865460.905125988006727
460.1260701648646610.2521403297293220.873929835135339
470.1314831147899540.2629662295799070.868516885210046
480.1523001037543240.3046002075086490.847699896245676
490.1489750920026130.2979501840052270.851024907997387
500.1381998758398910.2763997516797810.86180012416011
510.1280332074166160.2560664148332310.871966792583384
520.166865461377920.333730922755840.83313453862208
530.2669447567940420.5338895135880830.733055243205958
540.3550453542959360.7100907085918720.644954645704064

\begin{tabular}{lllllllll}
\hline
Goldfeld-Quandt test for Heteroskedasticity \tabularnewline
p-values & Alternative Hypothesis \tabularnewline
breakpoint index & greater & 2-sided & less \tabularnewline
5 & 0.000742019934828489 & 0.00148403986965698 & 0.999257980065172 \tabularnewline
6 & 6.93450392656692e-05 & 0.000138690078531338 & 0.999930654960734 \tabularnewline
7 & 5.74360322489835e-06 & 1.14872064497967e-05 & 0.999994256396775 \tabularnewline
8 & 1.22675566242444e-06 & 2.45351132484888e-06 & 0.999998773244338 \tabularnewline
9 & 9.1462552397515e-06 & 1.82925104795030e-05 & 0.99999085374476 \tabularnewline
10 & 4.53917504165671e-05 & 9.07835008331342e-05 & 0.999954608249583 \tabularnewline
11 & 0.000144028530072870 & 0.000288057060145739 & 0.999855971469927 \tabularnewline
12 & 0.000326366791549812 & 0.000652733583099625 & 0.99967363320845 \tabularnewline
13 & 0.000598812930278682 & 0.00119762586055736 & 0.999401187069721 \tabularnewline
14 & 0.00121659960532063 & 0.00243319921064126 & 0.99878340039468 \tabularnewline
15 & 0.00183865974409928 & 0.00367731948819856 & 0.9981613402559 \tabularnewline
16 & 0.00228604412441638 & 0.00457208824883277 & 0.997713955875584 \tabularnewline
17 & 0.00210587551245053 & 0.00421175102490107 & 0.99789412448755 \tabularnewline
18 & 0.00201743207724334 & 0.00403486415448668 & 0.997982567922757 \tabularnewline
19 & 0.00214537731703232 & 0.00429075463406465 & 0.997854622682968 \tabularnewline
20 & 0.00269303240177148 & 0.00538606480354297 & 0.997306967598228 \tabularnewline
21 & 0.00319648133456157 & 0.00639296266912313 & 0.996803518665438 \tabularnewline
22 & 0.00365370519843556 & 0.00730741039687112 & 0.996346294801564 \tabularnewline
23 & 0.00448561513735152 & 0.00897123027470305 & 0.995514384862648 \tabularnewline
24 & 0.00656721891722591 & 0.0131344378344518 & 0.993432781082774 \tabularnewline
25 & 0.0119238684170654 & 0.0238477368341307 & 0.988076131582935 \tabularnewline
26 & 0.0230204292611409 & 0.0460408585222818 & 0.97697957073886 \tabularnewline
27 & 0.0411661564494015 & 0.0823323128988031 & 0.958833843550599 \tabularnewline
28 & 0.0567575731917531 & 0.113515146383506 & 0.943242426808247 \tabularnewline
29 & 0.0623740029235225 & 0.124748005847045 & 0.937625997076478 \tabularnewline
30 & 0.0567389877821805 & 0.113477975564361 & 0.94326101221782 \tabularnewline
31 & 0.0548465764384881 & 0.109693152876976 & 0.945153423561512 \tabularnewline
32 & 0.0576468553840801 & 0.115293710768160 & 0.94235314461592 \tabularnewline
33 & 0.0630555294064361 & 0.126111058812872 & 0.936944470593564 \tabularnewline
34 & 0.0745630930124366 & 0.149126186024873 & 0.925436906987563 \tabularnewline
35 & 0.0856171842951435 & 0.171234368590287 & 0.914382815704857 \tabularnewline
36 & 0.0979220414639525 & 0.195844082927905 & 0.902077958536047 \tabularnewline
37 & 0.116035382993207 & 0.232070765986415 & 0.883964617006793 \tabularnewline
38 & 0.0984036042937825 & 0.196807208587565 & 0.901596395706218 \tabularnewline
39 & 0.078491436134426 & 0.156982872268852 & 0.921508563865574 \tabularnewline
40 & 0.073710244862185 & 0.14742048972437 & 0.926289755137815 \tabularnewline
41 & 0.0810112838177953 & 0.162022567635591 & 0.918988716182205 \tabularnewline
42 & 0.089436753784622 & 0.178873507569244 & 0.910563246215378 \tabularnewline
43 & 0.102119124958717 & 0.204238249917434 & 0.897880875041283 \tabularnewline
44 & 0.0929491707232783 & 0.185898341446557 & 0.907050829276722 \tabularnewline
45 & 0.094874011993273 & 0.189748023986546 & 0.905125988006727 \tabularnewline
46 & 0.126070164864661 & 0.252140329729322 & 0.873929835135339 \tabularnewline
47 & 0.131483114789954 & 0.262966229579907 & 0.868516885210046 \tabularnewline
48 & 0.152300103754324 & 0.304600207508649 & 0.847699896245676 \tabularnewline
49 & 0.148975092002613 & 0.297950184005227 & 0.851024907997387 \tabularnewline
50 & 0.138199875839891 & 0.276399751679781 & 0.86180012416011 \tabularnewline
51 & 0.128033207416616 & 0.256066414833231 & 0.871966792583384 \tabularnewline
52 & 0.16686546137792 & 0.33373092275584 & 0.83313453862208 \tabularnewline
53 & 0.266944756794042 & 0.533889513588083 & 0.733055243205958 \tabularnewline
54 & 0.355045354295936 & 0.710090708591872 & 0.644954645704064 \tabularnewline
\hline
\end{tabular}
%Source: https://freestatistics.org/blog/index.php?pk=70127&T=5

[TABLE]
[ROW][C]Goldfeld-Quandt test for Heteroskedasticity[/C][/ROW]
[ROW][C]p-values[/C][C]Alternative Hypothesis[/C][/ROW]
[ROW][C]breakpoint index[/C][C]greater[/C][C]2-sided[/C][C]less[/C][/ROW]
[ROW][C]5[/C][C]0.000742019934828489[/C][C]0.00148403986965698[/C][C]0.999257980065172[/C][/ROW]
[ROW][C]6[/C][C]6.93450392656692e-05[/C][C]0.000138690078531338[/C][C]0.999930654960734[/C][/ROW]
[ROW][C]7[/C][C]5.74360322489835e-06[/C][C]1.14872064497967e-05[/C][C]0.999994256396775[/C][/ROW]
[ROW][C]8[/C][C]1.22675566242444e-06[/C][C]2.45351132484888e-06[/C][C]0.999998773244338[/C][/ROW]
[ROW][C]9[/C][C]9.1462552397515e-06[/C][C]1.82925104795030e-05[/C][C]0.99999085374476[/C][/ROW]
[ROW][C]10[/C][C]4.53917504165671e-05[/C][C]9.07835008331342e-05[/C][C]0.999954608249583[/C][/ROW]
[ROW][C]11[/C][C]0.000144028530072870[/C][C]0.000288057060145739[/C][C]0.999855971469927[/C][/ROW]
[ROW][C]12[/C][C]0.000326366791549812[/C][C]0.000652733583099625[/C][C]0.99967363320845[/C][/ROW]
[ROW][C]13[/C][C]0.000598812930278682[/C][C]0.00119762586055736[/C][C]0.999401187069721[/C][/ROW]
[ROW][C]14[/C][C]0.00121659960532063[/C][C]0.00243319921064126[/C][C]0.99878340039468[/C][/ROW]
[ROW][C]15[/C][C]0.00183865974409928[/C][C]0.00367731948819856[/C][C]0.9981613402559[/C][/ROW]
[ROW][C]16[/C][C]0.00228604412441638[/C][C]0.00457208824883277[/C][C]0.997713955875584[/C][/ROW]
[ROW][C]17[/C][C]0.00210587551245053[/C][C]0.00421175102490107[/C][C]0.99789412448755[/C][/ROW]
[ROW][C]18[/C][C]0.00201743207724334[/C][C]0.00403486415448668[/C][C]0.997982567922757[/C][/ROW]
[ROW][C]19[/C][C]0.00214537731703232[/C][C]0.00429075463406465[/C][C]0.997854622682968[/C][/ROW]
[ROW][C]20[/C][C]0.00269303240177148[/C][C]0.00538606480354297[/C][C]0.997306967598228[/C][/ROW]
[ROW][C]21[/C][C]0.00319648133456157[/C][C]0.00639296266912313[/C][C]0.996803518665438[/C][/ROW]
[ROW][C]22[/C][C]0.00365370519843556[/C][C]0.00730741039687112[/C][C]0.996346294801564[/C][/ROW]
[ROW][C]23[/C][C]0.00448561513735152[/C][C]0.00897123027470305[/C][C]0.995514384862648[/C][/ROW]
[ROW][C]24[/C][C]0.00656721891722591[/C][C]0.0131344378344518[/C][C]0.993432781082774[/C][/ROW]
[ROW][C]25[/C][C]0.0119238684170654[/C][C]0.0238477368341307[/C][C]0.988076131582935[/C][/ROW]
[ROW][C]26[/C][C]0.0230204292611409[/C][C]0.0460408585222818[/C][C]0.97697957073886[/C][/ROW]
[ROW][C]27[/C][C]0.0411661564494015[/C][C]0.0823323128988031[/C][C]0.958833843550599[/C][/ROW]
[ROW][C]28[/C][C]0.0567575731917531[/C][C]0.113515146383506[/C][C]0.943242426808247[/C][/ROW]
[ROW][C]29[/C][C]0.0623740029235225[/C][C]0.124748005847045[/C][C]0.937625997076478[/C][/ROW]
[ROW][C]30[/C][C]0.0567389877821805[/C][C]0.113477975564361[/C][C]0.94326101221782[/C][/ROW]
[ROW][C]31[/C][C]0.0548465764384881[/C][C]0.109693152876976[/C][C]0.945153423561512[/C][/ROW]
[ROW][C]32[/C][C]0.0576468553840801[/C][C]0.115293710768160[/C][C]0.94235314461592[/C][/ROW]
[ROW][C]33[/C][C]0.0630555294064361[/C][C]0.126111058812872[/C][C]0.936944470593564[/C][/ROW]
[ROW][C]34[/C][C]0.0745630930124366[/C][C]0.149126186024873[/C][C]0.925436906987563[/C][/ROW]
[ROW][C]35[/C][C]0.0856171842951435[/C][C]0.171234368590287[/C][C]0.914382815704857[/C][/ROW]
[ROW][C]36[/C][C]0.0979220414639525[/C][C]0.195844082927905[/C][C]0.902077958536047[/C][/ROW]
[ROW][C]37[/C][C]0.116035382993207[/C][C]0.232070765986415[/C][C]0.883964617006793[/C][/ROW]
[ROW][C]38[/C][C]0.0984036042937825[/C][C]0.196807208587565[/C][C]0.901596395706218[/C][/ROW]
[ROW][C]39[/C][C]0.078491436134426[/C][C]0.156982872268852[/C][C]0.921508563865574[/C][/ROW]
[ROW][C]40[/C][C]0.073710244862185[/C][C]0.14742048972437[/C][C]0.926289755137815[/C][/ROW]
[ROW][C]41[/C][C]0.0810112838177953[/C][C]0.162022567635591[/C][C]0.918988716182205[/C][/ROW]
[ROW][C]42[/C][C]0.089436753784622[/C][C]0.178873507569244[/C][C]0.910563246215378[/C][/ROW]
[ROW][C]43[/C][C]0.102119124958717[/C][C]0.204238249917434[/C][C]0.897880875041283[/C][/ROW]
[ROW][C]44[/C][C]0.0929491707232783[/C][C]0.185898341446557[/C][C]0.907050829276722[/C][/ROW]
[ROW][C]45[/C][C]0.094874011993273[/C][C]0.189748023986546[/C][C]0.905125988006727[/C][/ROW]
[ROW][C]46[/C][C]0.126070164864661[/C][C]0.252140329729322[/C][C]0.873929835135339[/C][/ROW]
[ROW][C]47[/C][C]0.131483114789954[/C][C]0.262966229579907[/C][C]0.868516885210046[/C][/ROW]
[ROW][C]48[/C][C]0.152300103754324[/C][C]0.304600207508649[/C][C]0.847699896245676[/C][/ROW]
[ROW][C]49[/C][C]0.148975092002613[/C][C]0.297950184005227[/C][C]0.851024907997387[/C][/ROW]
[ROW][C]50[/C][C]0.138199875839891[/C][C]0.276399751679781[/C][C]0.86180012416011[/C][/ROW]
[ROW][C]51[/C][C]0.128033207416616[/C][C]0.256066414833231[/C][C]0.871966792583384[/C][/ROW]
[ROW][C]52[/C][C]0.16686546137792[/C][C]0.33373092275584[/C][C]0.83313453862208[/C][/ROW]
[ROW][C]53[/C][C]0.266944756794042[/C][C]0.533889513588083[/C][C]0.733055243205958[/C][/ROW]
[ROW][C]54[/C][C]0.355045354295936[/C][C]0.710090708591872[/C][C]0.644954645704064[/C][/ROW]
[/TABLE]
Source: https://freestatistics.org/blog/index.php?pk=70127&T=5

Globally Unique Identifier (entire table): ba.freestatistics.org/blog/index.php?pk=70127&T=5

As an alternative you can also use a QR Code:  

The GUIDs for individual cells are displayed in the table below:

Goldfeld-Quandt test for Heteroskedasticity
p-valuesAlternative Hypothesis
breakpoint indexgreater2-sidedless
50.0007420199348284890.001484039869656980.999257980065172
66.93450392656692e-050.0001386900785313380.999930654960734
75.74360322489835e-061.14872064497967e-050.999994256396775
81.22675566242444e-062.45351132484888e-060.999998773244338
99.1462552397515e-061.82925104795030e-050.99999085374476
104.53917504165671e-059.07835008331342e-050.999954608249583
110.0001440285300728700.0002880570601457390.999855971469927
120.0003263667915498120.0006527335830996250.99967363320845
130.0005988129302786820.001197625860557360.999401187069721
140.001216599605320630.002433199210641260.99878340039468
150.001838659744099280.003677319488198560.9981613402559
160.002286044124416380.004572088248832770.997713955875584
170.002105875512450530.004211751024901070.99789412448755
180.002017432077243340.004034864154486680.997982567922757
190.002145377317032320.004290754634064650.997854622682968
200.002693032401771480.005386064803542970.997306967598228
210.003196481334561570.006392962669123130.996803518665438
220.003653705198435560.007307410396871120.996346294801564
230.004485615137351520.008971230274703050.995514384862648
240.006567218917225910.01313443783445180.993432781082774
250.01192386841706540.02384773683413070.988076131582935
260.02302042926114090.04604085852228180.97697957073886
270.04116615644940150.08233231289880310.958833843550599
280.05675757319175310.1135151463835060.943242426808247
290.06237400292352250.1247480058470450.937625997076478
300.05673898778218050.1134779755643610.94326101221782
310.05484657643848810.1096931528769760.945153423561512
320.05764685538408010.1152937107681600.94235314461592
330.06305552940643610.1261110588128720.936944470593564
340.07456309301243660.1491261860248730.925436906987563
350.08561718429514350.1712343685902870.914382815704857
360.09792204146395250.1958440829279050.902077958536047
370.1160353829932070.2320707659864150.883964617006793
380.09840360429378250.1968072085875650.901596395706218
390.0784914361344260.1569828722688520.921508563865574
400.0737102448621850.147420489724370.926289755137815
410.08101128381779530.1620225676355910.918988716182205
420.0894367537846220.1788735075692440.910563246215378
430.1021191249587170.2042382499174340.897880875041283
440.09294917072327830.1858983414465570.907050829276722
450.0948740119932730.1897480239865460.905125988006727
460.1260701648646610.2521403297293220.873929835135339
470.1314831147899540.2629662295799070.868516885210046
480.1523001037543240.3046002075086490.847699896245676
490.1489750920026130.2979501840052270.851024907997387
500.1381998758398910.2763997516797810.86180012416011
510.1280332074166160.2560664148332310.871966792583384
520.166865461377920.333730922755840.83313453862208
530.2669447567940420.5338895135880830.733055243205958
540.3550453542959360.7100907085918720.644954645704064


Meta Analysis of Goldfeld-Quandt test for Heteroskedasticity
Description# significant tests% significant testsOK/NOK
1% type I error level190.38NOK
5% type I error level220.44NOK
10% type I error level230.46NOK

\begin{tabular}{lllllllll}
\hline
Meta Analysis of Goldfeld-Quandt test for Heteroskedasticity \tabularnewline
Description & # significant tests & % significant tests & OK/NOK \tabularnewline
1% type I error level & 19 & 0.38 & NOK \tabularnewline
5% type I error level & 22 & 0.44 & NOK \tabularnewline
10% type I error level & 23 & 0.46 & NOK \tabularnewline
\hline
\end{tabular}
%Source: https://freestatistics.org/blog/index.php?pk=70127&T=6

[TABLE]
[ROW][C]Meta Analysis of Goldfeld-Quandt test for Heteroskedasticity[/C][/ROW]
[ROW][C]Description[/C][C]# significant tests[/C][C]% significant tests[/C][C]OK/NOK[/C][/ROW]
[ROW][C]1% type I error level[/C][C]19[/C][C]0.38[/C][C]NOK[/C][/ROW]
[ROW][C]5% type I error level[/C][C]22[/C][C]0.44[/C][C]NOK[/C][/ROW]
[ROW][C]10% type I error level[/C][C]23[/C][C]0.46[/C][C]NOK[/C][/ROW]
[/TABLE]
Source: https://freestatistics.org/blog/index.php?pk=70127&T=6

Globally Unique Identifier (entire table): ba.freestatistics.org/blog/index.php?pk=70127&T=6

As an alternative you can also use a QR Code:  

The GUIDs for individual cells are displayed in the table below:

Meta Analysis of Goldfeld-Quandt test for Heteroskedasticity
Description# significant tests% significant testsOK/NOK
1% type I error level190.38NOK
5% type I error level220.44NOK
10% type I error level230.46NOK


Parameters (Session):
par1 = 1 ; par2 = Do not include Seasonal Dummies ; par3 = No Linear Trend ;
Parameters (R input):
par1 = 1 ; par2 = Do not include Seasonal Dummies ; par3 = No Linear Trend ;
R code (references can be found in the software module):
library(lattice)
library(lmtest)
n25 <- 25 #minimum number of obs. for Goldfeld-Quandt test
par1 <- as.numeric(par1)
x <- t(y)
k <- length(x[1,])
n <- length(x[,1])
x1 <- cbind(x[,par1], x[,1:k!=par1])
mycolnames <- c(colnames(x)[par1], colnames(x)[1:k!=par1])
colnames(x1) <- mycolnames #colnames(x)[par1]
x <- x1
if (par3 == 'First Differences'){
x2 <- array(0, dim=c(n-1,k), dimnames=list(1:(n-1), paste('(1-B)',colnames(x),sep='')))
for (i in 1:n-1) {
for (j in 1:k) {
x2[i,j] <- x[i+1,j] - x[i,j]
}
}
x <- x2
}
if (par2 == 'Include Monthly Dummies'){
x2 <- array(0, dim=c(n,11), dimnames=list(1:n, paste('M', seq(1:11), sep ='')))
for (i in 1:11){
x2[seq(i,n,12),i] <- 1
}
x <- cbind(x, x2)
}
if (par2 == 'Include Quarterly Dummies'){
x2 <- array(0, dim=c(n,3), dimnames=list(1:n, paste('Q', seq(1:3), sep ='')))
for (i in 1:3){
x2[seq(i,n,4),i] <- 1
}
x <- cbind(x, x2)
}
k <- length(x[1,])
if (par3 == 'Linear Trend'){
x <- cbind(x, c(1:n))
colnames(x)[k+1] <- 't'
}
x
k <- length(x[1,])
df <- as.data.frame(x)
(mylm <- lm(df))
(mysum <- summary(mylm))
if (n > n25) {
kp3 <- k + 3
nmkm3 <- n - k - 3
gqarr <- array(NA, dim=c(nmkm3-kp3+1,3))
numgqtests <- 0
numsignificant1 <- 0
numsignificant5 <- 0
numsignificant10 <- 0
for (mypoint in kp3:nmkm3) {
j <- 0
numgqtests <- numgqtests + 1
for (myalt in c('greater', 'two.sided', 'less')) {
j <- j + 1
gqarr[mypoint-kp3+1,j] <- gqtest(mylm, point=mypoint, alternative=myalt)$p.value
}
if (gqarr[mypoint-kp3+1,2] < 0.01) numsignificant1 <- numsignificant1 + 1
if (gqarr[mypoint-kp3+1,2] < 0.05) numsignificant5 <- numsignificant5 + 1
if (gqarr[mypoint-kp3+1,2] < 0.10) numsignificant10 <- numsignificant10 + 1
}
gqarr
}
bitmap(file='test0.png')
plot(x[,1], type='l', main='Actuals and Interpolation', ylab='value of Actuals and Interpolation (dots)', xlab='time or index')
points(x[,1]-mysum$resid)
grid()
dev.off()
bitmap(file='test1.png')
plot(mysum$resid, type='b', pch=19, main='Residuals', ylab='value of Residuals', xlab='time or index')
grid()
dev.off()
bitmap(file='test2.png')
hist(mysum$resid, main='Residual Histogram', xlab='values of Residuals')
grid()
dev.off()
bitmap(file='test3.png')
densityplot(~mysum$resid,col='black',main='Residual Density Plot', xlab='values of Residuals')
dev.off()
bitmap(file='test4.png')
qqnorm(mysum$resid, main='Residual Normal Q-Q Plot')
qqline(mysum$resid)
grid()
dev.off()
(myerror <- as.ts(mysum$resid))
bitmap(file='test5.png')
dum <- cbind(lag(myerror,k=1),myerror)
dum
dum1 <- dum[2:length(myerror),]
dum1
z <- as.data.frame(dum1)
z
plot(z,main=paste('Residual Lag plot, lowess, and regression line'), ylab='values of Residuals', xlab='lagged values of Residuals')
lines(lowess(z))
abline(lm(z))
grid()
dev.off()
bitmap(file='test6.png')
acf(mysum$resid, lag.max=length(mysum$resid)/2, main='Residual Autocorrelation Function')
grid()
dev.off()
bitmap(file='test7.png')
pacf(mysum$resid, lag.max=length(mysum$resid)/2, main='Residual Partial Autocorrelation Function')
grid()
dev.off()
bitmap(file='test8.png')
opar <- par(mfrow = c(2,2), oma = c(0, 0, 1.1, 0))
plot(mylm, las = 1, sub='Residual Diagnostics')
par(opar)
dev.off()
if (n > n25) {
bitmap(file='test9.png')
plot(kp3:nmkm3,gqarr[,2], main='Goldfeld-Quandt test',ylab='2-sided p-value',xlab='breakpoint')
grid()
dev.off()
}
load(file='createtable')
a<-table.start()
a<-table.row.start(a)
a<-table.element(a, 'Multiple Linear Regression - Estimated Regression Equation', 1, TRUE)
a<-table.row.end(a)
myeq <- colnames(x)[1]
myeq <- paste(myeq, '[t] = ', sep='')
for (i in 1:k){
if (mysum$coefficients[i,1] > 0) myeq <- paste(myeq, '+', '')
myeq <- paste(myeq, mysum$coefficients[i,1], sep=' ')
if (rownames(mysum$coefficients)[i] != '(Intercept)') {
myeq <- paste(myeq, rownames(mysum$coefficients)[i], sep='')
if (rownames(mysum$coefficients)[i] != 't') myeq <- paste(myeq, '[t]', sep='')
}
}
myeq <- paste(myeq, ' + e[t]')
a<-table.row.start(a)
a<-table.element(a, myeq)
a<-table.row.end(a)
a<-table.end(a)
table.save(a,file='mytable1.tab')
a<-table.start()
a<-table.row.start(a)
a<-table.element(a,hyperlink('ols1.htm','Multiple Linear Regression - Ordinary Least Squares',''), 6, TRUE)
a<-table.row.end(a)
a<-table.row.start(a)
a<-table.element(a,'Variable',header=TRUE)
a<-table.element(a,'Parameter',header=TRUE)
a<-table.element(a,'S.D.',header=TRUE)
a<-table.element(a,'T-STAT
H0: parameter = 0',header=TRUE)
a<-table.element(a,'2-tail p-value',header=TRUE)
a<-table.element(a,'1-tail p-value',header=TRUE)
a<-table.row.end(a)
for (i in 1:k){
a<-table.row.start(a)
a<-table.element(a,rownames(mysum$coefficients)[i],header=TRUE)
a<-table.element(a,mysum$coefficients[i,1])
a<-table.element(a, round(mysum$coefficients[i,2],6))
a<-table.element(a, round(mysum$coefficients[i,3],4))
a<-table.element(a, round(mysum$coefficients[i,4],6))
a<-table.element(a, round(mysum$coefficients[i,4]/2,6))
a<-table.row.end(a)
}
a<-table.end(a)
table.save(a,file='mytable2.tab')
a<-table.start()
a<-table.row.start(a)
a<-table.element(a, 'Multiple Linear Regression - Regression Statistics', 2, TRUE)
a<-table.row.end(a)
a<-table.row.start(a)
a<-table.element(a, 'Multiple R',1,TRUE)
a<-table.element(a, sqrt(mysum$r.squared))
a<-table.row.end(a)
a<-table.row.start(a)
a<-table.element(a, 'R-squared',1,TRUE)
a<-table.element(a, mysum$r.squared)
a<-table.row.end(a)
a<-table.row.start(a)
a<-table.element(a, 'Adjusted R-squared',1,TRUE)
a<-table.element(a, mysum$adj.r.squared)
a<-table.row.end(a)
a<-table.row.start(a)
a<-table.element(a, 'F-TEST (value)',1,TRUE)
a<-table.element(a, mysum$fstatistic[1])
a<-table.row.end(a)
a<-table.row.start(a)
a<-table.element(a, 'F-TEST (DF numerator)',1,TRUE)
a<-table.element(a, mysum$fstatistic[2])
a<-table.row.end(a)
a<-table.row.start(a)
a<-table.element(a, 'F-TEST (DF denominator)',1,TRUE)
a<-table.element(a, mysum$fstatistic[3])
a<-table.row.end(a)
a<-table.row.start(a)
a<-table.element(a, 'p-value',1,TRUE)
a<-table.element(a, 1-pf(mysum$fstatistic[1],mysum$fstatistic[2],mysum$fstatistic[3]))
a<-table.row.end(a)
a<-table.row.start(a)
a<-table.element(a, 'Multiple Linear Regression - Residual Statistics', 2, TRUE)
a<-table.row.end(a)
a<-table.row.start(a)
a<-table.element(a, 'Residual Standard Deviation',1,TRUE)
a<-table.element(a, mysum$sigma)
a<-table.row.end(a)
a<-table.row.start(a)
a<-table.element(a, 'Sum Squared Residuals',1,TRUE)
a<-table.element(a, sum(myerror*myerror))
a<-table.row.end(a)
a<-table.end(a)
table.save(a,file='mytable3.tab')
a<-table.start()
a<-table.row.start(a)
a<-table.element(a, 'Multiple Linear Regression - Actuals, Interpolation, and Residuals', 4, TRUE)
a<-table.row.end(a)
a<-table.row.start(a)
a<-table.element(a, 'Time or Index', 1, TRUE)
a<-table.element(a, 'Actuals', 1, TRUE)
a<-table.element(a, 'Interpolation
Forecast', 1, TRUE)
a<-table.element(a, 'Residuals
Prediction Error', 1, TRUE)
a<-table.row.end(a)
for (i in 1:n) {
a<-table.row.start(a)
a<-table.element(a,i, 1, TRUE)
a<-table.element(a,x[i])
a<-table.element(a,x[i]-mysum$resid[i])
a<-table.element(a,mysum$resid[i])
a<-table.row.end(a)
}
a<-table.end(a)
table.save(a,file='mytable4.tab')
if (n > n25) {
a<-table.start()
a<-table.row.start(a)
a<-table.element(a,'Goldfeld-Quandt test for Heteroskedasticity',4,TRUE)
a<-table.row.end(a)
a<-table.row.start(a)
a<-table.element(a,'p-values',header=TRUE)
a<-table.element(a,'Alternative Hypothesis',3,header=TRUE)
a<-table.row.end(a)
a<-table.row.start(a)
a<-table.element(a,'breakpoint index',header=TRUE)
a<-table.element(a,'greater',header=TRUE)
a<-table.element(a,'2-sided',header=TRUE)
a<-table.element(a,'less',header=TRUE)
a<-table.row.end(a)
for (mypoint in kp3:nmkm3) {
a<-table.row.start(a)
a<-table.element(a,mypoint,header=TRUE)
a<-table.element(a,gqarr[mypoint-kp3+1,1])
a<-table.element(a,gqarr[mypoint-kp3+1,2])
a<-table.element(a,gqarr[mypoint-kp3+1,3])
a<-table.row.end(a)
}
a<-table.end(a)
table.save(a,file='mytable5.tab')
a<-table.start()
a<-table.row.start(a)
a<-table.element(a,'Meta Analysis of Goldfeld-Quandt test for Heteroskedasticity',4,TRUE)
a<-table.row.end(a)
a<-table.row.start(a)
a<-table.element(a,'Description',header=TRUE)
a<-table.element(a,'# significant tests',header=TRUE)
a<-table.element(a,'% significant tests',header=TRUE)
a<-table.element(a,'OK/NOK',header=TRUE)
a<-table.row.end(a)
a<-table.row.start(a)
a<-table.element(a,'1% type I error level',header=TRUE)
a<-table.element(a,numsignificant1)
a<-table.element(a,numsignificant1/numgqtests)
if (numsignificant1/numgqtests < 0.01) dum <- 'OK' else dum <- 'NOK'
a<-table.element(a,dum)
a<-table.row.end(a)
a<-table.row.start(a)
a<-table.element(a,'5% type I error level',header=TRUE)
a<-table.element(a,numsignificant5)
a<-table.element(a,numsignificant5/numgqtests)
if (numsignificant5/numgqtests < 0.05) dum <- 'OK' else dum <- 'NOK'
a<-table.element(a,dum)
a<-table.row.end(a)
a<-table.row.start(a)
a<-table.element(a,'10% type I error level',header=TRUE)
a<-table.element(a,numsignificant10)
a<-table.element(a,numsignificant10/numgqtests)
if (numsignificant10/numgqtests < 0.1) dum <- 'OK' else dum <- 'NOK'
a<-table.element(a,dum)
a<-table.row.end(a)
a<-table.end(a)
table.save(a,file='mytable6.tab')
}