Free Statistics

of Irreproducible Research!

Author's title

Author*The author of this computation has been verified*
R Software Modulerwasp_autocorrelation.wasp
Title produced by software(Partial) Autocorrelation Function
Date of computationMon, 21 Dec 2009 05:19:04 -0700
Cite this page as followsStatistical Computations at FreeStatistics.org, Office for Research Development and Education, URL https://freestatistics.org/blog/index.php?v=date/2009/Dec/21/t1261398010zhf2mdrbvonu167.htm/, Retrieved Sun, 05 May 2024 15:20:27 +0000
Statistical Computations at FreeStatistics.org, Office for Research Development and Education, URL https://freestatistics.org/blog/index.php?pk=70125, Retrieved Sun, 05 May 2024 15:20:27 +0000
QR Codes:

Original text written by user:
IsPrivate?No (this computation is public)
User-defined keywords
Estimated Impact129
Family? (F = Feedback message, R = changed R code, M = changed R Module, P = changed Parameters, D = changed Data)
-     [(Partial) Autocorrelation Function] [Partial autocorre...] [2008-12-09 20:18:51] [12d343c4448a5f9e527bb31caeac580b]
-   P   [(Partial) Autocorrelation Function] [Partial autocorre...] [2008-12-09 20:27:26] [12d343c4448a5f9e527bb31caeac580b]
- RMPD      [(Partial) Autocorrelation Function] [] [2009-12-21 12:19:04] [4f2ce09ae9ed345cd87786097de0b173] [Current]
Feedback Forum

Post a new message
Dataseries X:
3030.29
2803.47
2767.63
2882.6
2863.36
2897.06
3012.61
3142.95
3032.93
3045.78
3110.52
3013.24
2987.1
2995.55
2833.18
2848.96
2794.83
2845.26
2915.02
2892.63
2604.42
2641.65
2659.81
2638.53
2720.25
2745.88
2735.7
2811.7
2799.43
2555.28
2304.98
2214.95
2065.81
1940.49
2042
1995.37
1946.81
1765.9
1635.25
1833.42
1910.43
1959.67
1969.6
2061.41
2093.48
2120.88
2174.56
2196.72
2350.44
2440.25
2408.64
2472.81
2407.6
2454.62
2448.05
2497.84
2645.64
2756.76
2849.27
2921.44
2981.85
3080.58
3106.22
3119.31
3061.26
3097.31
3161.69
3257.16
3277.01
3295.32
3363.99
3494.17
3667.03
3813.06
3917.96
3895.51
3801.06
3570.12
3701.61
3862.27
3970.1
4138.52
4199.75
4290.89
4443.91
4502.64
4356.98
4591.27
4696.96
4621.4
4562.84
4202.52
4296.49
4435.23
4105.18
4116.68
3844.49
3720.98
3674.4
3857.62
3801.06
3504.37
3032.6
3047.03
2962.34
2197.82
2014.45
1862.83
1905.41
1810.99
1670.07
1864.44
2052.02
2029.6
2070.83
2293.41
2443.27
2513.17
2466.92


Summary of computational transaction
Raw Inputview raw input (R code)
Raw Outputview raw output of R engine
Computing time1 seconds
R Server'Gwilym Jenkins' @ 72.249.127.135

\begin{tabular}{lllllllll}
\hline
Summary of computational transaction \tabularnewline
Raw Input & view raw input (R code)  \tabularnewline
Raw Output & view raw output of R engine  \tabularnewline
Computing time & 1 seconds \tabularnewline
R Server & 'Gwilym Jenkins' @ 72.249.127.135 \tabularnewline
\hline
\end{tabular}
%Source: https://freestatistics.org/blog/index.php?pk=70125&T=0

[TABLE]
[ROW][C]Summary of computational transaction[/C][/ROW]
[ROW][C]Raw Input[/C][C]view raw input (R code) [/C][/ROW]
[ROW][C]Raw Output[/C][C]view raw output of R engine [/C][/ROW]
[ROW][C]Computing time[/C][C]1 seconds[/C][/ROW]
[ROW][C]R Server[/C][C]'Gwilym Jenkins' @ 72.249.127.135[/C][/ROW]
[/TABLE]
Source: https://freestatistics.org/blog/index.php?pk=70125&T=0

Globally Unique Identifier (entire table): ba.freestatistics.org/blog/index.php?pk=70125&T=0

As an alternative you can also use a QR Code:  

The GUIDs for individual cells are displayed in the table below:

Summary of computational transaction
Raw Inputview raw input (R code)
Raw Outputview raw output of R engine
Computing time1 seconds
R Server'Gwilym Jenkins' @ 72.249.127.135


Autocorrelation Function
Time lag kACF(k)T-STATP-value
10.98065910.69770
20.95177210.38260
30.91997710.03580
40.8795429.59470
50.8311119.06640
60.7755858.46060
70.7199517.85370
80.6633237.2360
90.6009156.55520
100.5371895.860
110.4776915.2110
120.4154484.5327e-06
130.352993.85079.6e-05
140.2926573.19250.000902
150.2359942.57440.005634
160.1795521.95870.026245
170.1210211.32020.094654
180.0674960.73630.231501
190.0192530.210.417004
20-0.028732-0.31340.377252
21-0.073658-0.80350.211639
22-0.114661-1.25080.106731
23-0.151651-1.65430.050349
24-0.18225-1.98810.024548
25-0.210553-2.29690.011687
26-0.234918-2.56270.005817
27-0.255925-2.79180.003054
28-0.276462-3.01580.001567
29-0.295439-3.22290.000819
30-0.312485-3.40880.000446
31-0.327879-3.57670.000252
32-0.342292-3.7340.000145
33-0.358321-3.90887.7e-05
34-0.372107-4.05924.4e-05
35-0.383807-4.18682.7e-05
36-0.392013-4.27641.9e-05
37-0.399594-4.35911.4e-05
38-0.405615-4.42471.1e-05
39-0.409545-4.46769e-06
40-0.413786-4.51398e-06
41-0.417314-4.55246e-06
42-0.420514-4.58736e-06
43-0.420657-4.58886e-06
44-0.417242-4.55166e-06
45-0.413178-4.50728e-06
46-0.407918-4.44991e-05
47-0.400895-4.37321.3e-05
48-0.391748-4.27351.9e-05
49-0.381008-4.15633.1e-05
50-0.367273-4.00655.4e-05
51-0.350672-3.82540.000105
52-0.331393-3.61510.000221
53-0.308979-3.37060.000506
54-0.28651-3.12550.001115
55-0.263208-2.87130.002421
56-0.237915-2.59530.005319
57-0.212501-2.31810.011076
58-0.185621-2.02490.022558
59-0.15797-1.72320.04372
60-0.130236-1.42070.079008

\begin{tabular}{lllllllll}
\hline
Autocorrelation Function \tabularnewline
Time lag k & ACF(k) & T-STAT & P-value \tabularnewline
1 & 0.980659 & 10.6977 & 0 \tabularnewline
2 & 0.951772 & 10.3826 & 0 \tabularnewline
3 & 0.919977 & 10.0358 & 0 \tabularnewline
4 & 0.879542 & 9.5947 & 0 \tabularnewline
5 & 0.831111 & 9.0664 & 0 \tabularnewline
6 & 0.775585 & 8.4606 & 0 \tabularnewline
7 & 0.719951 & 7.8537 & 0 \tabularnewline
8 & 0.663323 & 7.236 & 0 \tabularnewline
9 & 0.600915 & 6.5552 & 0 \tabularnewline
10 & 0.537189 & 5.86 & 0 \tabularnewline
11 & 0.477691 & 5.211 & 0 \tabularnewline
12 & 0.415448 & 4.532 & 7e-06 \tabularnewline
13 & 0.35299 & 3.8507 & 9.6e-05 \tabularnewline
14 & 0.292657 & 3.1925 & 0.000902 \tabularnewline
15 & 0.235994 & 2.5744 & 0.005634 \tabularnewline
16 & 0.179552 & 1.9587 & 0.026245 \tabularnewline
17 & 0.121021 & 1.3202 & 0.094654 \tabularnewline
18 & 0.067496 & 0.7363 & 0.231501 \tabularnewline
19 & 0.019253 & 0.21 & 0.417004 \tabularnewline
20 & -0.028732 & -0.3134 & 0.377252 \tabularnewline
21 & -0.073658 & -0.8035 & 0.211639 \tabularnewline
22 & -0.114661 & -1.2508 & 0.106731 \tabularnewline
23 & -0.151651 & -1.6543 & 0.050349 \tabularnewline
24 & -0.18225 & -1.9881 & 0.024548 \tabularnewline
25 & -0.210553 & -2.2969 & 0.011687 \tabularnewline
26 & -0.234918 & -2.5627 & 0.005817 \tabularnewline
27 & -0.255925 & -2.7918 & 0.003054 \tabularnewline
28 & -0.276462 & -3.0158 & 0.001567 \tabularnewline
29 & -0.295439 & -3.2229 & 0.000819 \tabularnewline
30 & -0.312485 & -3.4088 & 0.000446 \tabularnewline
31 & -0.327879 & -3.5767 & 0.000252 \tabularnewline
32 & -0.342292 & -3.734 & 0.000145 \tabularnewline
33 & -0.358321 & -3.9088 & 7.7e-05 \tabularnewline
34 & -0.372107 & -4.0592 & 4.4e-05 \tabularnewline
35 & -0.383807 & -4.1868 & 2.7e-05 \tabularnewline
36 & -0.392013 & -4.2764 & 1.9e-05 \tabularnewline
37 & -0.399594 & -4.3591 & 1.4e-05 \tabularnewline
38 & -0.405615 & -4.4247 & 1.1e-05 \tabularnewline
39 & -0.409545 & -4.4676 & 9e-06 \tabularnewline
40 & -0.413786 & -4.5139 & 8e-06 \tabularnewline
41 & -0.417314 & -4.5524 & 6e-06 \tabularnewline
42 & -0.420514 & -4.5873 & 6e-06 \tabularnewline
43 & -0.420657 & -4.5888 & 6e-06 \tabularnewline
44 & -0.417242 & -4.5516 & 6e-06 \tabularnewline
45 & -0.413178 & -4.5072 & 8e-06 \tabularnewline
46 & -0.407918 & -4.4499 & 1e-05 \tabularnewline
47 & -0.400895 & -4.3732 & 1.3e-05 \tabularnewline
48 & -0.391748 & -4.2735 & 1.9e-05 \tabularnewline
49 & -0.381008 & -4.1563 & 3.1e-05 \tabularnewline
50 & -0.367273 & -4.0065 & 5.4e-05 \tabularnewline
51 & -0.350672 & -3.8254 & 0.000105 \tabularnewline
52 & -0.331393 & -3.6151 & 0.000221 \tabularnewline
53 & -0.308979 & -3.3706 & 0.000506 \tabularnewline
54 & -0.28651 & -3.1255 & 0.001115 \tabularnewline
55 & -0.263208 & -2.8713 & 0.002421 \tabularnewline
56 & -0.237915 & -2.5953 & 0.005319 \tabularnewline
57 & -0.212501 & -2.3181 & 0.011076 \tabularnewline
58 & -0.185621 & -2.0249 & 0.022558 \tabularnewline
59 & -0.15797 & -1.7232 & 0.04372 \tabularnewline
60 & -0.130236 & -1.4207 & 0.079008 \tabularnewline
\hline
\end{tabular}
%Source: https://freestatistics.org/blog/index.php?pk=70125&T=1

[TABLE]
[ROW][C]Autocorrelation Function[/C][/ROW]
[ROW][C]Time lag k[/C][C]ACF(k)[/C][C]T-STAT[/C][C]P-value[/C][/ROW]
[ROW][C]1[/C][C]0.980659[/C][C]10.6977[/C][C]0[/C][/ROW]
[ROW][C]2[/C][C]0.951772[/C][C]10.3826[/C][C]0[/C][/ROW]
[ROW][C]3[/C][C]0.919977[/C][C]10.0358[/C][C]0[/C][/ROW]
[ROW][C]4[/C][C]0.879542[/C][C]9.5947[/C][C]0[/C][/ROW]
[ROW][C]5[/C][C]0.831111[/C][C]9.0664[/C][C]0[/C][/ROW]
[ROW][C]6[/C][C]0.775585[/C][C]8.4606[/C][C]0[/C][/ROW]
[ROW][C]7[/C][C]0.719951[/C][C]7.8537[/C][C]0[/C][/ROW]
[ROW][C]8[/C][C]0.663323[/C][C]7.236[/C][C]0[/C][/ROW]
[ROW][C]9[/C][C]0.600915[/C][C]6.5552[/C][C]0[/C][/ROW]
[ROW][C]10[/C][C]0.537189[/C][C]5.86[/C][C]0[/C][/ROW]
[ROW][C]11[/C][C]0.477691[/C][C]5.211[/C][C]0[/C][/ROW]
[ROW][C]12[/C][C]0.415448[/C][C]4.532[/C][C]7e-06[/C][/ROW]
[ROW][C]13[/C][C]0.35299[/C][C]3.8507[/C][C]9.6e-05[/C][/ROW]
[ROW][C]14[/C][C]0.292657[/C][C]3.1925[/C][C]0.000902[/C][/ROW]
[ROW][C]15[/C][C]0.235994[/C][C]2.5744[/C][C]0.005634[/C][/ROW]
[ROW][C]16[/C][C]0.179552[/C][C]1.9587[/C][C]0.026245[/C][/ROW]
[ROW][C]17[/C][C]0.121021[/C][C]1.3202[/C][C]0.094654[/C][/ROW]
[ROW][C]18[/C][C]0.067496[/C][C]0.7363[/C][C]0.231501[/C][/ROW]
[ROW][C]19[/C][C]0.019253[/C][C]0.21[/C][C]0.417004[/C][/ROW]
[ROW][C]20[/C][C]-0.028732[/C][C]-0.3134[/C][C]0.377252[/C][/ROW]
[ROW][C]21[/C][C]-0.073658[/C][C]-0.8035[/C][C]0.211639[/C][/ROW]
[ROW][C]22[/C][C]-0.114661[/C][C]-1.2508[/C][C]0.106731[/C][/ROW]
[ROW][C]23[/C][C]-0.151651[/C][C]-1.6543[/C][C]0.050349[/C][/ROW]
[ROW][C]24[/C][C]-0.18225[/C][C]-1.9881[/C][C]0.024548[/C][/ROW]
[ROW][C]25[/C][C]-0.210553[/C][C]-2.2969[/C][C]0.011687[/C][/ROW]
[ROW][C]26[/C][C]-0.234918[/C][C]-2.5627[/C][C]0.005817[/C][/ROW]
[ROW][C]27[/C][C]-0.255925[/C][C]-2.7918[/C][C]0.003054[/C][/ROW]
[ROW][C]28[/C][C]-0.276462[/C][C]-3.0158[/C][C]0.001567[/C][/ROW]
[ROW][C]29[/C][C]-0.295439[/C][C]-3.2229[/C][C]0.000819[/C][/ROW]
[ROW][C]30[/C][C]-0.312485[/C][C]-3.4088[/C][C]0.000446[/C][/ROW]
[ROW][C]31[/C][C]-0.327879[/C][C]-3.5767[/C][C]0.000252[/C][/ROW]
[ROW][C]32[/C][C]-0.342292[/C][C]-3.734[/C][C]0.000145[/C][/ROW]
[ROW][C]33[/C][C]-0.358321[/C][C]-3.9088[/C][C]7.7e-05[/C][/ROW]
[ROW][C]34[/C][C]-0.372107[/C][C]-4.0592[/C][C]4.4e-05[/C][/ROW]
[ROW][C]35[/C][C]-0.383807[/C][C]-4.1868[/C][C]2.7e-05[/C][/ROW]
[ROW][C]36[/C][C]-0.392013[/C][C]-4.2764[/C][C]1.9e-05[/C][/ROW]
[ROW][C]37[/C][C]-0.399594[/C][C]-4.3591[/C][C]1.4e-05[/C][/ROW]
[ROW][C]38[/C][C]-0.405615[/C][C]-4.4247[/C][C]1.1e-05[/C][/ROW]
[ROW][C]39[/C][C]-0.409545[/C][C]-4.4676[/C][C]9e-06[/C][/ROW]
[ROW][C]40[/C][C]-0.413786[/C][C]-4.5139[/C][C]8e-06[/C][/ROW]
[ROW][C]41[/C][C]-0.417314[/C][C]-4.5524[/C][C]6e-06[/C][/ROW]
[ROW][C]42[/C][C]-0.420514[/C][C]-4.5873[/C][C]6e-06[/C][/ROW]
[ROW][C]43[/C][C]-0.420657[/C][C]-4.5888[/C][C]6e-06[/C][/ROW]
[ROW][C]44[/C][C]-0.417242[/C][C]-4.5516[/C][C]6e-06[/C][/ROW]
[ROW][C]45[/C][C]-0.413178[/C][C]-4.5072[/C][C]8e-06[/C][/ROW]
[ROW][C]46[/C][C]-0.407918[/C][C]-4.4499[/C][C]1e-05[/C][/ROW]
[ROW][C]47[/C][C]-0.400895[/C][C]-4.3732[/C][C]1.3e-05[/C][/ROW]
[ROW][C]48[/C][C]-0.391748[/C][C]-4.2735[/C][C]1.9e-05[/C][/ROW]
[ROW][C]49[/C][C]-0.381008[/C][C]-4.1563[/C][C]3.1e-05[/C][/ROW]
[ROW][C]50[/C][C]-0.367273[/C][C]-4.0065[/C][C]5.4e-05[/C][/ROW]
[ROW][C]51[/C][C]-0.350672[/C][C]-3.8254[/C][C]0.000105[/C][/ROW]
[ROW][C]52[/C][C]-0.331393[/C][C]-3.6151[/C][C]0.000221[/C][/ROW]
[ROW][C]53[/C][C]-0.308979[/C][C]-3.3706[/C][C]0.000506[/C][/ROW]
[ROW][C]54[/C][C]-0.28651[/C][C]-3.1255[/C][C]0.001115[/C][/ROW]
[ROW][C]55[/C][C]-0.263208[/C][C]-2.8713[/C][C]0.002421[/C][/ROW]
[ROW][C]56[/C][C]-0.237915[/C][C]-2.5953[/C][C]0.005319[/C][/ROW]
[ROW][C]57[/C][C]-0.212501[/C][C]-2.3181[/C][C]0.011076[/C][/ROW]
[ROW][C]58[/C][C]-0.185621[/C][C]-2.0249[/C][C]0.022558[/C][/ROW]
[ROW][C]59[/C][C]-0.15797[/C][C]-1.7232[/C][C]0.04372[/C][/ROW]
[ROW][C]60[/C][C]-0.130236[/C][C]-1.4207[/C][C]0.079008[/C][/ROW]
[/TABLE]
Source: https://freestatistics.org/blog/index.php?pk=70125&T=1

Globally Unique Identifier (entire table): ba.freestatistics.org/blog/index.php?pk=70125&T=1

As an alternative you can also use a QR Code:  

The GUIDs for individual cells are displayed in the table below:

Autocorrelation Function
Time lag kACF(k)T-STATP-value
10.98065910.69770
20.95177210.38260
30.91997710.03580
40.8795429.59470
50.8311119.06640
60.7755858.46060
70.7199517.85370
80.6633237.2360
90.6009156.55520
100.5371895.860
110.4776915.2110
120.4154484.5327e-06
130.352993.85079.6e-05
140.2926573.19250.000902
150.2359942.57440.005634
160.1795521.95870.026245
170.1210211.32020.094654
180.0674960.73630.231501
190.0192530.210.417004
20-0.028732-0.31340.377252
21-0.073658-0.80350.211639
22-0.114661-1.25080.106731
23-0.151651-1.65430.050349
24-0.18225-1.98810.024548
25-0.210553-2.29690.011687
26-0.234918-2.56270.005817
27-0.255925-2.79180.003054
28-0.276462-3.01580.001567
29-0.295439-3.22290.000819
30-0.312485-3.40880.000446
31-0.327879-3.57670.000252
32-0.342292-3.7340.000145
33-0.358321-3.90887.7e-05
34-0.372107-4.05924.4e-05
35-0.383807-4.18682.7e-05
36-0.392013-4.27641.9e-05
37-0.399594-4.35911.4e-05
38-0.405615-4.42471.1e-05
39-0.409545-4.46769e-06
40-0.413786-4.51398e-06
41-0.417314-4.55246e-06
42-0.420514-4.58736e-06
43-0.420657-4.58886e-06
44-0.417242-4.55166e-06
45-0.413178-4.50728e-06
46-0.407918-4.44991e-05
47-0.400895-4.37321.3e-05
48-0.391748-4.27351.9e-05
49-0.381008-4.15633.1e-05
50-0.367273-4.00655.4e-05
51-0.350672-3.82540.000105
52-0.331393-3.61510.000221
53-0.308979-3.37060.000506
54-0.28651-3.12550.001115
55-0.263208-2.87130.002421
56-0.237915-2.59530.005319
57-0.212501-2.31810.011076
58-0.185621-2.02490.022558
59-0.15797-1.72320.04372
60-0.130236-1.42070.079008


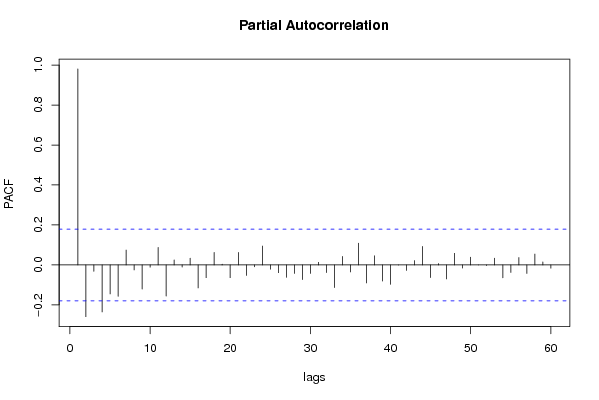
Partial Autocorrelation Function
Time lag kPACF(k)T-STATP-value
10.98065910.69770
2-0.258946-2.82480.002775
3-0.03192-0.34820.364149
4-0.235326-2.56710.005747
5-0.145525-1.58750.057527
6-0.15737-1.71670.044317
70.0742660.81010.209736
8-0.02522-0.27510.391851
9-0.120966-1.31960.094754
10-0.011109-0.12120.451874
110.0872390.95170.171598
12-0.156169-1.70360.045532
130.0247520.270.393808
14-0.010646-0.11610.453872
150.0338160.36890.356432
16-0.115432-1.25920.105209
17-0.06405-0.69870.243051
180.0626940.68390.24768
190.0035130.03830.484749
20-0.063797-0.69590.24391
210.0621750.67820.249465
22-0.052777-0.57570.282941
23-0.009684-0.10560.458024
240.0944031.02980.152593
25-0.021653-0.23620.406841
26-0.038651-0.42160.337029
27-0.061797-0.67410.250769
28-0.04284-0.46730.320558
29-0.073395-0.80060.212467
30-0.042728-0.46610.320994
310.0131530.14350.443077
32-0.038512-0.42010.33758
33-0.113553-1.23870.108944
340.042360.46210.322429
35-0.034939-0.38110.351888
360.1084391.18290.119597
37-0.090446-0.98670.162907
380.0453410.49460.310895
39-0.080635-0.87960.190419
40-0.0972-1.06030.145571
41-0.000757-0.00830.496712
42-0.027698-0.30210.381534
430.0219040.23890.405782
440.0926241.01040.157174
45-0.063185-0.68930.245999
460.0067940.07410.47052
47-0.069922-0.76280.22356
480.0582730.63570.2631
49-0.015816-0.17250.431655
500.0387060.42220.336808
516.8e-057e-040.499705
52-0.003042-0.03320.486792
530.0337620.36830.356651
54-0.064434-0.70290.241748
55-0.03783-0.41270.340293
560.0364560.39770.345786
57-0.042485-0.46350.321941
580.0545030.59460.276634
590.014630.15960.436733
60-0.016354-0.17840.429357

\begin{tabular}{lllllllll}
\hline
Partial Autocorrelation Function \tabularnewline
Time lag k & PACF(k) & T-STAT & P-value \tabularnewline
1 & 0.980659 & 10.6977 & 0 \tabularnewline
2 & -0.258946 & -2.8248 & 0.002775 \tabularnewline
3 & -0.03192 & -0.3482 & 0.364149 \tabularnewline
4 & -0.235326 & -2.5671 & 0.005747 \tabularnewline
5 & -0.145525 & -1.5875 & 0.057527 \tabularnewline
6 & -0.15737 & -1.7167 & 0.044317 \tabularnewline
7 & 0.074266 & 0.8101 & 0.209736 \tabularnewline
8 & -0.02522 & -0.2751 & 0.391851 \tabularnewline
9 & -0.120966 & -1.3196 & 0.094754 \tabularnewline
10 & -0.011109 & -0.1212 & 0.451874 \tabularnewline
11 & 0.087239 & 0.9517 & 0.171598 \tabularnewline
12 & -0.156169 & -1.7036 & 0.045532 \tabularnewline
13 & 0.024752 & 0.27 & 0.393808 \tabularnewline
14 & -0.010646 & -0.1161 & 0.453872 \tabularnewline
15 & 0.033816 & 0.3689 & 0.356432 \tabularnewline
16 & -0.115432 & -1.2592 & 0.105209 \tabularnewline
17 & -0.06405 & -0.6987 & 0.243051 \tabularnewline
18 & 0.062694 & 0.6839 & 0.24768 \tabularnewline
19 & 0.003513 & 0.0383 & 0.484749 \tabularnewline
20 & -0.063797 & -0.6959 & 0.24391 \tabularnewline
21 & 0.062175 & 0.6782 & 0.249465 \tabularnewline
22 & -0.052777 & -0.5757 & 0.282941 \tabularnewline
23 & -0.009684 & -0.1056 & 0.458024 \tabularnewline
24 & 0.094403 & 1.0298 & 0.152593 \tabularnewline
25 & -0.021653 & -0.2362 & 0.406841 \tabularnewline
26 & -0.038651 & -0.4216 & 0.337029 \tabularnewline
27 & -0.061797 & -0.6741 & 0.250769 \tabularnewline
28 & -0.04284 & -0.4673 & 0.320558 \tabularnewline
29 & -0.073395 & -0.8006 & 0.212467 \tabularnewline
30 & -0.042728 & -0.4661 & 0.320994 \tabularnewline
31 & 0.013153 & 0.1435 & 0.443077 \tabularnewline
32 & -0.038512 & -0.4201 & 0.33758 \tabularnewline
33 & -0.113553 & -1.2387 & 0.108944 \tabularnewline
34 & 0.04236 & 0.4621 & 0.322429 \tabularnewline
35 & -0.034939 & -0.3811 & 0.351888 \tabularnewline
36 & 0.108439 & 1.1829 & 0.119597 \tabularnewline
37 & -0.090446 & -0.9867 & 0.162907 \tabularnewline
38 & 0.045341 & 0.4946 & 0.310895 \tabularnewline
39 & -0.080635 & -0.8796 & 0.190419 \tabularnewline
40 & -0.0972 & -1.0603 & 0.145571 \tabularnewline
41 & -0.000757 & -0.0083 & 0.496712 \tabularnewline
42 & -0.027698 & -0.3021 & 0.381534 \tabularnewline
43 & 0.021904 & 0.2389 & 0.405782 \tabularnewline
44 & 0.092624 & 1.0104 & 0.157174 \tabularnewline
45 & -0.063185 & -0.6893 & 0.245999 \tabularnewline
46 & 0.006794 & 0.0741 & 0.47052 \tabularnewline
47 & -0.069922 & -0.7628 & 0.22356 \tabularnewline
48 & 0.058273 & 0.6357 & 0.2631 \tabularnewline
49 & -0.015816 & -0.1725 & 0.431655 \tabularnewline
50 & 0.038706 & 0.4222 & 0.336808 \tabularnewline
51 & 6.8e-05 & 7e-04 & 0.499705 \tabularnewline
52 & -0.003042 & -0.0332 & 0.486792 \tabularnewline
53 & 0.033762 & 0.3683 & 0.356651 \tabularnewline
54 & -0.064434 & -0.7029 & 0.241748 \tabularnewline
55 & -0.03783 & -0.4127 & 0.340293 \tabularnewline
56 & 0.036456 & 0.3977 & 0.345786 \tabularnewline
57 & -0.042485 & -0.4635 & 0.321941 \tabularnewline
58 & 0.054503 & 0.5946 & 0.276634 \tabularnewline
59 & 0.01463 & 0.1596 & 0.436733 \tabularnewline
60 & -0.016354 & -0.1784 & 0.429357 \tabularnewline
\hline
\end{tabular}
%Source: https://freestatistics.org/blog/index.php?pk=70125&T=2

[TABLE]
[ROW][C]Partial Autocorrelation Function[/C][/ROW]
[ROW][C]Time lag k[/C][C]PACF(k)[/C][C]T-STAT[/C][C]P-value[/C][/ROW]
[ROW][C]1[/C][C]0.980659[/C][C]10.6977[/C][C]0[/C][/ROW]
[ROW][C]2[/C][C]-0.258946[/C][C]-2.8248[/C][C]0.002775[/C][/ROW]
[ROW][C]3[/C][C]-0.03192[/C][C]-0.3482[/C][C]0.364149[/C][/ROW]
[ROW][C]4[/C][C]-0.235326[/C][C]-2.5671[/C][C]0.005747[/C][/ROW]
[ROW][C]5[/C][C]-0.145525[/C][C]-1.5875[/C][C]0.057527[/C][/ROW]
[ROW][C]6[/C][C]-0.15737[/C][C]-1.7167[/C][C]0.044317[/C][/ROW]
[ROW][C]7[/C][C]0.074266[/C][C]0.8101[/C][C]0.209736[/C][/ROW]
[ROW][C]8[/C][C]-0.02522[/C][C]-0.2751[/C][C]0.391851[/C][/ROW]
[ROW][C]9[/C][C]-0.120966[/C][C]-1.3196[/C][C]0.094754[/C][/ROW]
[ROW][C]10[/C][C]-0.011109[/C][C]-0.1212[/C][C]0.451874[/C][/ROW]
[ROW][C]11[/C][C]0.087239[/C][C]0.9517[/C][C]0.171598[/C][/ROW]
[ROW][C]12[/C][C]-0.156169[/C][C]-1.7036[/C][C]0.045532[/C][/ROW]
[ROW][C]13[/C][C]0.024752[/C][C]0.27[/C][C]0.393808[/C][/ROW]
[ROW][C]14[/C][C]-0.010646[/C][C]-0.1161[/C][C]0.453872[/C][/ROW]
[ROW][C]15[/C][C]0.033816[/C][C]0.3689[/C][C]0.356432[/C][/ROW]
[ROW][C]16[/C][C]-0.115432[/C][C]-1.2592[/C][C]0.105209[/C][/ROW]
[ROW][C]17[/C][C]-0.06405[/C][C]-0.6987[/C][C]0.243051[/C][/ROW]
[ROW][C]18[/C][C]0.062694[/C][C]0.6839[/C][C]0.24768[/C][/ROW]
[ROW][C]19[/C][C]0.003513[/C][C]0.0383[/C][C]0.484749[/C][/ROW]
[ROW][C]20[/C][C]-0.063797[/C][C]-0.6959[/C][C]0.24391[/C][/ROW]
[ROW][C]21[/C][C]0.062175[/C][C]0.6782[/C][C]0.249465[/C][/ROW]
[ROW][C]22[/C][C]-0.052777[/C][C]-0.5757[/C][C]0.282941[/C][/ROW]
[ROW][C]23[/C][C]-0.009684[/C][C]-0.1056[/C][C]0.458024[/C][/ROW]
[ROW][C]24[/C][C]0.094403[/C][C]1.0298[/C][C]0.152593[/C][/ROW]
[ROW][C]25[/C][C]-0.021653[/C][C]-0.2362[/C][C]0.406841[/C][/ROW]
[ROW][C]26[/C][C]-0.038651[/C][C]-0.4216[/C][C]0.337029[/C][/ROW]
[ROW][C]27[/C][C]-0.061797[/C][C]-0.6741[/C][C]0.250769[/C][/ROW]
[ROW][C]28[/C][C]-0.04284[/C][C]-0.4673[/C][C]0.320558[/C][/ROW]
[ROW][C]29[/C][C]-0.073395[/C][C]-0.8006[/C][C]0.212467[/C][/ROW]
[ROW][C]30[/C][C]-0.042728[/C][C]-0.4661[/C][C]0.320994[/C][/ROW]
[ROW][C]31[/C][C]0.013153[/C][C]0.1435[/C][C]0.443077[/C][/ROW]
[ROW][C]32[/C][C]-0.038512[/C][C]-0.4201[/C][C]0.33758[/C][/ROW]
[ROW][C]33[/C][C]-0.113553[/C][C]-1.2387[/C][C]0.108944[/C][/ROW]
[ROW][C]34[/C][C]0.04236[/C][C]0.4621[/C][C]0.322429[/C][/ROW]
[ROW][C]35[/C][C]-0.034939[/C][C]-0.3811[/C][C]0.351888[/C][/ROW]
[ROW][C]36[/C][C]0.108439[/C][C]1.1829[/C][C]0.119597[/C][/ROW]
[ROW][C]37[/C][C]-0.090446[/C][C]-0.9867[/C][C]0.162907[/C][/ROW]
[ROW][C]38[/C][C]0.045341[/C][C]0.4946[/C][C]0.310895[/C][/ROW]
[ROW][C]39[/C][C]-0.080635[/C][C]-0.8796[/C][C]0.190419[/C][/ROW]
[ROW][C]40[/C][C]-0.0972[/C][C]-1.0603[/C][C]0.145571[/C][/ROW]
[ROW][C]41[/C][C]-0.000757[/C][C]-0.0083[/C][C]0.496712[/C][/ROW]
[ROW][C]42[/C][C]-0.027698[/C][C]-0.3021[/C][C]0.381534[/C][/ROW]
[ROW][C]43[/C][C]0.021904[/C][C]0.2389[/C][C]0.405782[/C][/ROW]
[ROW][C]44[/C][C]0.092624[/C][C]1.0104[/C][C]0.157174[/C][/ROW]
[ROW][C]45[/C][C]-0.063185[/C][C]-0.6893[/C][C]0.245999[/C][/ROW]
[ROW][C]46[/C][C]0.006794[/C][C]0.0741[/C][C]0.47052[/C][/ROW]
[ROW][C]47[/C][C]-0.069922[/C][C]-0.7628[/C][C]0.22356[/C][/ROW]
[ROW][C]48[/C][C]0.058273[/C][C]0.6357[/C][C]0.2631[/C][/ROW]
[ROW][C]49[/C][C]-0.015816[/C][C]-0.1725[/C][C]0.431655[/C][/ROW]
[ROW][C]50[/C][C]0.038706[/C][C]0.4222[/C][C]0.336808[/C][/ROW]
[ROW][C]51[/C][C]6.8e-05[/C][C]7e-04[/C][C]0.499705[/C][/ROW]
[ROW][C]52[/C][C]-0.003042[/C][C]-0.0332[/C][C]0.486792[/C][/ROW]
[ROW][C]53[/C][C]0.033762[/C][C]0.3683[/C][C]0.356651[/C][/ROW]
[ROW][C]54[/C][C]-0.064434[/C][C]-0.7029[/C][C]0.241748[/C][/ROW]
[ROW][C]55[/C][C]-0.03783[/C][C]-0.4127[/C][C]0.340293[/C][/ROW]
[ROW][C]56[/C][C]0.036456[/C][C]0.3977[/C][C]0.345786[/C][/ROW]
[ROW][C]57[/C][C]-0.042485[/C][C]-0.4635[/C][C]0.321941[/C][/ROW]
[ROW][C]58[/C][C]0.054503[/C][C]0.5946[/C][C]0.276634[/C][/ROW]
[ROW][C]59[/C][C]0.01463[/C][C]0.1596[/C][C]0.436733[/C][/ROW]
[ROW][C]60[/C][C]-0.016354[/C][C]-0.1784[/C][C]0.429357[/C][/ROW]
[/TABLE]
Source: https://freestatistics.org/blog/index.php?pk=70125&T=2

Globally Unique Identifier (entire table): ba.freestatistics.org/blog/index.php?pk=70125&T=2

As an alternative you can also use a QR Code:  

The GUIDs for individual cells are displayed in the table below:

Partial Autocorrelation Function
Time lag kPACF(k)T-STATP-value
10.98065910.69770
2-0.258946-2.82480.002775
3-0.03192-0.34820.364149
4-0.235326-2.56710.005747
5-0.145525-1.58750.057527
6-0.15737-1.71670.044317
70.0742660.81010.209736
8-0.02522-0.27510.391851
9-0.120966-1.31960.094754
10-0.011109-0.12120.451874
110.0872390.95170.171598
12-0.156169-1.70360.045532
130.0247520.270.393808
14-0.010646-0.11610.453872
150.0338160.36890.356432
16-0.115432-1.25920.105209
17-0.06405-0.69870.243051
180.0626940.68390.24768
190.0035130.03830.484749
20-0.063797-0.69590.24391
210.0621750.67820.249465
22-0.052777-0.57570.282941
23-0.009684-0.10560.458024
240.0944031.02980.152593
25-0.021653-0.23620.406841
26-0.038651-0.42160.337029
27-0.061797-0.67410.250769
28-0.04284-0.46730.320558
29-0.073395-0.80060.212467
30-0.042728-0.46610.320994
310.0131530.14350.443077
32-0.038512-0.42010.33758
33-0.113553-1.23870.108944
340.042360.46210.322429
35-0.034939-0.38110.351888
360.1084391.18290.119597
37-0.090446-0.98670.162907
380.0453410.49460.310895
39-0.080635-0.87960.190419
40-0.0972-1.06030.145571
41-0.000757-0.00830.496712
42-0.027698-0.30210.381534
430.0219040.23890.405782
440.0926241.01040.157174
45-0.063185-0.68930.245999
460.0067940.07410.47052
47-0.069922-0.76280.22356
480.0582730.63570.2631
49-0.015816-0.17250.431655
500.0387060.42220.336808
516.8e-057e-040.499705
52-0.003042-0.03320.486792
530.0337620.36830.356651
54-0.064434-0.70290.241748
55-0.03783-0.41270.340293
560.0364560.39770.345786
57-0.042485-0.46350.321941
580.0545030.59460.276634
590.014630.15960.436733
60-0.016354-0.17840.429357


Parameters (Session):
par1 = 60 ; par2 = 1 ; par3 = 0 ; par4 = 0 ; par5 = 12 ; par6 = White Noise ; par7 = 0.95 ;
Parameters (R input):
par1 = 60 ; par2 = 1 ; par3 = 0 ; par4 = 0 ; par5 = 12 ; par6 = White Noise ; par7 = 0.95 ;
R code (references can be found in the software module):
if (par1 == 'Default') {
par1 = 10*log10(length(x))
} else {
par1 <- as.numeric(par1)
}
par2 <- as.numeric(par2)
par3 <- as.numeric(par3)
par4 <- as.numeric(par4)
par5 <- as.numeric(par5)
if (par6 == 'White Noise') par6 <- 'white' else par6 <- 'ma'
par7 <- as.numeric(par7)
if (par2 == 0) {
x <- log(x)
} else {
x <- (x ^ par2 - 1) / par2
}
if (par3 > 0) x <- diff(x,lag=1,difference=par3)
if (par4 > 0) x <- diff(x,lag=par5,difference=par4)
bitmap(file='pic1.png')
racf <- acf(x, par1, main='Autocorrelation', xlab='time lag', ylab='ACF', ci.type=par6, ci=par7, sub=paste('(lambda=',par2,', d=',par3,', D=',par4,', CI=', par7, ', CI type=',par6,')',sep=''))
dev.off()
bitmap(file='pic2.png')
rpacf <- pacf(x,par1,main='Partial Autocorrelation',xlab='lags',ylab='PACF')
dev.off()
(myacf <- c(racf$acf))
(mypacf <- c(rpacf$acf))
lengthx <- length(x)
sqrtn <- sqrt(lengthx)
load(file='createtable')
a<-table.start()
a<-table.row.start(a)
a<-table.element(a,'Autocorrelation Function',4,TRUE)
a<-table.row.end(a)
a<-table.row.start(a)
a<-table.element(a,'Time lag k',header=TRUE)
a<-table.element(a,hyperlink('basics.htm','ACF(k)','click here for more information about the Autocorrelation Function'),header=TRUE)
a<-table.element(a,'T-STAT',header=TRUE)
a<-table.element(a,'P-value',header=TRUE)
a<-table.row.end(a)
for (i in 2:(par1+1)) {
a<-table.row.start(a)
a<-table.element(a,i-1,header=TRUE)
a<-table.element(a,round(myacf[i],6))
mytstat <- myacf[i]*sqrtn
a<-table.element(a,round(mytstat,4))
a<-table.element(a,round(1-pt(abs(mytstat),lengthx),6))
a<-table.row.end(a)
}
a<-table.end(a)
table.save(a,file='mytable.tab')
a<-table.start()
a<-table.row.start(a)
a<-table.element(a,'Partial Autocorrelation Function',4,TRUE)
a<-table.row.end(a)
a<-table.row.start(a)
a<-table.element(a,'Time lag k',header=TRUE)
a<-table.element(a,hyperlink('basics.htm','PACF(k)','click here for more information about the Partial Autocorrelation Function'),header=TRUE)
a<-table.element(a,'T-STAT',header=TRUE)
a<-table.element(a,'P-value',header=TRUE)
a<-table.row.end(a)
for (i in 1:par1) {
a<-table.row.start(a)
a<-table.element(a,i,header=TRUE)
a<-table.element(a,round(mypacf[i],6))
mytstat <- mypacf[i]*sqrtn
a<-table.element(a,round(mytstat,4))
a<-table.element(a,round(1-pt(abs(mytstat),lengthx),6))
a<-table.row.end(a)
}
a<-table.end(a)
table.save(a,file='mytable1.tab')