| Multiple Linear Regression - Estimated Regression Equation |
| Y[t] = + 2.63835457876613 + 0.0084265340572524X[t] + e[t] |
| Multiple Linear Regression - Ordinary Least Squares | |||||
| Variable | Parameter | S.D. | T-STAT H0: parameter = 0 | 2-tail p-value | 1-tail p-value |
| (Intercept) | 2.63835457876613 | 0.449474 | 5.8699 | 0 | 0 |
| X | 0.0084265340572524 | 0.015094 | 0.5583 | 0.578806 | 0.289403 |
| Multiple Linear Regression - Regression Statistics | |
| Multiple R | 0.0731087363377837 |
| R-squared | 0.00534488732890758 |
| Adjusted R-squared | -0.0118043387516285 |
| F-TEST (value) | 0.311669302381749 |
| F-TEST (DF numerator) | 1 |
| F-TEST (DF denominator) | 58 |
| p-value | 0.578806475583351 |
| Multiple Linear Regression - Residual Statistics | |
| Residual Standard Deviation | 1.33847340344487 |
| Sum Squared Residuals | 103.907641000298 |
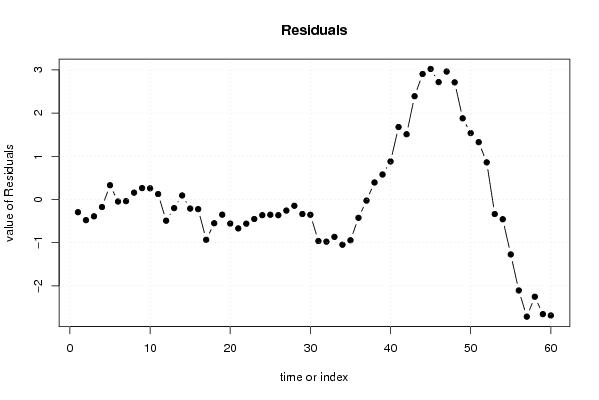
| Multiple Linear Regression - Actuals, Interpolation, and Residuals | |||
| Time or Index | Actuals | Interpolation Forecast | Residuals Prediction Error |
| 1 | 2.6 | 2.89536386751233 | -0.295363867512332 |
| 2 | 2.4 | 2.87935345280355 | -0.479353452803550 |
| 3 | 2.5 | 2.89115060048370 | -0.391150600483703 |
| 4 | 2.7 | 2.87598283918065 | -0.175982839180649 |
| 5 | 3.2 | 2.8709269187463 | 0.329073081253702 |
| 6 | 2.8 | 2.84817527679172 | -0.0481752767917163 |
| 7 | 2.8 | 2.83890608932874 | -0.0389060893287387 |
| 8 | 3 | 2.84311935635736 | 0.156880643642635 |
| 9 | 3.1 | 2.83722078251729 | 0.262779217482712 |
| 10 | 3.1 | 2.84227670295164 | 0.257723297048361 |
| 11 | 3 | 2.87514018577492 | 0.124859814225076 |
| 12 | 2.4 | 2.89199325388943 | -0.491993253889429 |
| 13 | 2.7 | 2.90041978794668 | -0.200419787946681 |
| 14 | 3 | 2.90800366859821 | 0.0919963314017917 |
| 15 | 2.7 | 2.91137428222111 | -0.211374282221109 |
| 16 | 2.7 | 2.92485673671271 | -0.224856736712713 |
| 17 | 2 | 2.93412592417569 | -0.93412592417569 |
| 18 | 2.4 | 2.95097899229020 | -0.550978992290196 |
| 19 | 2.6 | 2.95266429910165 | -0.352664299101646 |
| 20 | 2.4 | 2.95940552634745 | -0.559405526347448 |
| 21 | 2.3 | 2.9712026740276 | -0.671202674027601 |
| 22 | 2.4 | 2.9610908331589 | -0.561090833158899 |
| 23 | 2.5 | 2.95266429910165 | -0.452664299101646 |
| 24 | 2.6 | 2.9644614467818 | -0.364461446781799 |
| 25 | 2.6 | 2.95434960591310 | -0.354349605913096 |
| 26 | 2.6 | 2.9644614467818 | -0.364461446781799 |
| 27 | 2.7 | 2.957720219536 | -0.257720219535997 |
| 28 | 2.8 | 2.94676572526157 | -0.146765725261570 |
| 29 | 2.6 | 2.93749653779859 | -0.337496537798592 |
| 30 | 2.6 | 2.95519225931882 | -0.355192259318822 |
| 31 | 2 | 2.96361879337607 | -0.963618793376074 |
| 32 | 2 | 2.97794390127340 | -0.977943901273403 |
| 33 | 2.1 | 2.96698940699898 | -0.866989406998975 |
| 34 | 1.9 | 2.94845103207302 | -1.04845103207302 |
| 35 | 2 | 2.94592307185584 | -0.945923071855844 |
| 36 | 2.5 | 2.92569939011844 | -0.425699390118438 |
| 37 | 2.9 | 2.92654204352416 | -0.0265420435241637 |
| 38 | 3.3 | 2.90716101519248 | 0.392838984807517 |
| 39 | 3.5 | 2.92232877649554 | 0.577671223504463 |
| 40 | 3.8 | 2.92064346968409 | 0.879356530315913 |
| 41 | 4.6 | 2.92317142990126 | 1.67682857009874 |
| 42 | 4.4 | 2.89030794707798 | 1.50969205292202 |
| 43 | 5.3 | 2.91053162881538 | 2.38946837118462 |
| 44 | 5.8 | 2.89536386751233 | 2.90463613248767 |
| 45 | 5.9 | 2.87851079939782 | 3.02148920060218 |
| 46 | 5.6 | 2.88272406642645 | 2.71727593357355 |
| 47 | 5.8 | 2.83890608932874 | 2.96109391067126 |
| 48 | 5.5 | 2.78918953839095 | 2.71081046160905 |
| 49 | 4.6 | 2.72177726593293 | 1.87822273406707 |
| 50 | 4.2 | 2.66363418093789 | 1.53636581906211 |
| 51 | 4 | 2.67374602180659 | 1.32625397819341 |
| 52 | 3.5 | 2.64172519238903 | 0.858274807610968 |
| 53 | 2.3 | 2.63835457876613 | -0.338354578766131 |
| 54 | 2.2 | 2.65857826050354 | -0.458578260503537 |
| 55 | 1.4 | 2.67374602180659 | -1.27374602180659 |
| 56 | 0.6 | 2.7074521580356 | -2.1074521580356 |
| 57 | 0 | 2.71419338528140 | -2.71419338528140 |
| 58 | 0.5 | 2.75295544194476 | -2.25295544194476 |
| 59 | 0.1 | 2.75632605556767 | -2.65632605556767 |
| 60 | 0.1 | 2.78666157817377 | -2.68666157817377 |
| Goldfeld-Quandt test for Heteroskedasticity | |||
| p-values | Alternative Hypothesis | ||
| breakpoint index | greater | 2-sided | less |
| 5 | 0.0114474240933169 | 0.0228948481866339 | 0.988552575906683 |
| 6 | 0.00298500936945455 | 0.0059700187389091 | 0.997014990630545 |
| 7 | 0.00056896212571626 | 0.00113792425143252 | 0.999431037874284 |
| 8 | 9.77474507862184e-05 | 0.000195494901572437 | 0.999902252549214 |
| 9 | 1.67431297662078e-05 | 3.34862595324156e-05 | 0.999983256870234 |
| 10 | 2.79960135118431e-06 | 5.59920270236863e-06 | 0.999997200398649 |
| 11 | 8.02080278311731e-07 | 1.60416055662346e-06 | 0.999999197919722 |
| 12 | 1.69215982171278e-07 | 3.38431964342555e-07 | 0.999999830784018 |
| 13 | 3.11196997634010e-08 | 6.22393995268019e-08 | 0.9999999688803 |
| 14 | 2.6862967816924e-08 | 5.3725935633848e-08 | 0.999999973137032 |
| 15 | 4.26364085413442e-09 | 8.52728170826885e-09 | 0.99999999573636 |
| 16 | 7.01530338111902e-10 | 1.40306067622380e-09 | 0.99999999929847 |
| 17 | 7.42465560293367e-10 | 1.48493112058673e-09 | 0.999999999257534 |
| 18 | 1.20607259947445e-10 | 2.41214519894889e-10 | 0.999999999879393 |
| 19 | 2.88886878206947e-11 | 5.77773756413893e-11 | 0.999999999971111 |
| 20 | 4.38062769055744e-12 | 8.7612553811149e-12 | 0.99999999999562 |
| 21 | 6.46425123327324e-13 | 1.29285024665465e-12 | 0.999999999999354 |
| 22 | 9.29840533979355e-14 | 1.85968106795871e-13 | 0.999999999999907 |
| 23 | 1.37029385672614e-14 | 2.74058771345227e-14 | 0.999999999999986 |
| 24 | 3.04697292313371e-15 | 6.09394584626741e-15 | 0.999999999999997 |
| 25 | 5.16053193033838e-16 | 1.03210638606768e-15 | 1 |
| 26 | 9.56843273447087e-17 | 1.91368654689417e-16 | 1 |
| 27 | 2.17251641861236e-17 | 4.34503283722471e-17 | 1 |
| 28 | 5.85499864891341e-18 | 1.17099972978268e-17 | 1 |
| 29 | 7.54519508467045e-19 | 1.50903901693409e-18 | 1 |
| 30 | 1.05711060918354e-19 | 2.11422121836708e-19 | 1 |
| 31 | 1.43638526280649e-19 | 2.87277052561299e-19 | 1 |
| 32 | 9.90280598568281e-20 | 1.98056119713656e-19 | 1 |
| 33 | 4.52827887082971e-20 | 9.05655774165942e-20 | 1 |
| 34 | 1.61674138336717e-19 | 3.23348276673433e-19 | 1 |
| 35 | 2.63381537289425e-19 | 5.26763074578849e-19 | 1 |
| 36 | 7.71703075450152e-20 | 1.54340615090030e-19 | 1 |
| 37 | 5.14164488050178e-20 | 1.02832897610036e-19 | 1 |
| 38 | 1.69878728152952e-19 | 3.39757456305903e-19 | 1 |
| 39 | 3.43260265762977e-18 | 6.86520531525955e-18 | 1 |
| 40 | 2.19123970455543e-16 | 4.38247940911086e-16 | 1 |
| 41 | 6.47178680749915e-13 | 1.29435736149983e-12 | 0.999999999999353 |
| 42 | 7.66672256424672e-12 | 1.53334451284934e-11 | 0.999999999992333 |
| 43 | 1.98434346182306e-09 | 3.96868692364611e-09 | 0.999999998015657 |
| 44 | 1.64470119507978e-07 | 3.28940239015956e-07 | 0.99999983552988 |
| 45 | 2.62573705213292e-06 | 5.25147410426583e-06 | 0.999997374262948 |
| 46 | 1.38287057936088e-05 | 2.76574115872176e-05 | 0.999986171294206 |
| 47 | 0.000265196804237043 | 0.000530393608474087 | 0.999734803195763 |
| 48 | 0.0269936081497211 | 0.0539872162994422 | 0.97300639185028 |
| 49 | 0.285018394387286 | 0.570036788774573 | 0.714981605612714 |
| 50 | 0.475644239424695 | 0.95128847884939 | 0.524355760575305 |
| 51 | 0.866457535425815 | 0.267084929148371 | 0.133542464574185 |
| 52 | 0.963472478832376 | 0.0730550423352479 | 0.0365275211676239 |
| 53 | 0.942647377292558 | 0.114705245414884 | 0.0573526227074419 |
| 54 | 0.96395812900575 | 0.0720837419885004 | 0.0360418709942502 |
| 55 | 0.974409513539867 | 0.0511809729202664 | 0.0255904864601332 |
| Meta Analysis of Goldfeld-Quandt test for Heteroskedasticity | |||
| Description | # significant tests | % significant tests | OK/NOK |
| 1% type I error level | 42 | 0.823529411764706 | NOK |
| 5% type I error level | 43 | 0.843137254901961 | NOK |
| 10% type I error level | 47 | 0.92156862745098 | NOK |