| Multiple Linear Regression - Estimated Regression Equation |
| y[t] = + 1112.02652796567 + 0.223233492472836`y(t-1)`[t] + 0.319262189799833`y(t-2)`[t] + 35.0304516301858x[t] -124.87050947952M1[t] + 65.4880752713608M2[t] + 271.293404992809M3[t] -153.152721244156M4[t] + 68.4632365716367M5[t] + 346.830003968164M6[t] + 101.994476866418M7[t] + 281.262139157106M8[t] + 188.653515284143M9[t] + 119.308989555359M10[t] + 414.965821439792M11[t] -5.81464467737814t + e[t] |
| Multiple Linear Regression - Ordinary Least Squares | |||||
| Variable | Parameter | S.D. | T-STAT H0: parameter = 0 | 2-tail p-value | 1-tail p-value |
| (Intercept) | 1112.02652796567 | 496.606678 | 2.2393 | 0.030366 | 0.015183 |
| `y(t-1)` | 0.223233492472836 | 0.140731 | 1.5862 | 0.120012 | 0.060006 |
| `y(t-2)` | 0.319262189799833 | 0.143454 | 2.2255 | 0.031341 | 0.01567 |
| x | 35.0304516301858 | 138.184168 | 0.2535 | 0.801086 | 0.400543 |
| M1 | -124.87050947952 | 187.035294 | -0.6676 | 0.507937 | 0.253968 |
| M2 | 65.4880752713608 | 183.43175 | 0.357 | 0.722826 | 0.361413 |
| M3 | 271.293404992809 | 182.782316 | 1.4842 | 0.145038 | 0.072519 |
| M4 | -153.152721244156 | 176.53059 | -0.8676 | 0.390446 | 0.195223 |
| M5 | 68.4632365716367 | 191.92322 | 0.3567 | 0.723045 | 0.361522 |
| M6 | 346.830003968164 | 186.683923 | 1.8578 | 0.070047 | 0.035023 |
| M7 | 101.994476866418 | 176.609715 | 0.5775 | 0.566605 | 0.283302 |
| M8 | 281.262139157106 | 179.772029 | 1.5645 | 0.125019 | 0.06251 |
| M9 | 188.653515284143 | 175.446437 | 1.0753 | 0.288247 | 0.144124 |
| M10 | 119.308989555359 | 177.412922 | 0.6725 | 0.504868 | 0.252434 |
| M11 | 414.965821439792 | 175.003944 | 2.3712 | 0.022282 | 0.011141 |
| t | -5.81464467737814 | 4.046632 | -1.4369 | 0.157981 | 0.07899 |
| Multiple Linear Regression - Regression Statistics | |
| Multiple R | 0.744050670630097 |
| R-squared | 0.553611400465098 |
| Adjusted R-squared | 0.397894447138969 |
| F-TEST (value) | 3.55524166534155 |
| F-TEST (DF numerator) | 15 |
| F-TEST (DF denominator) | 43 |
| p-value | 0.000553619578918085 |
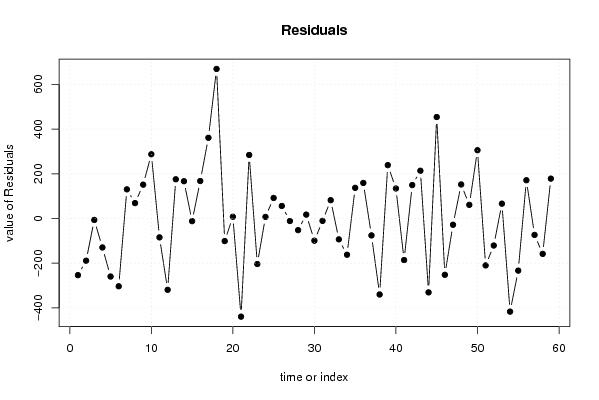
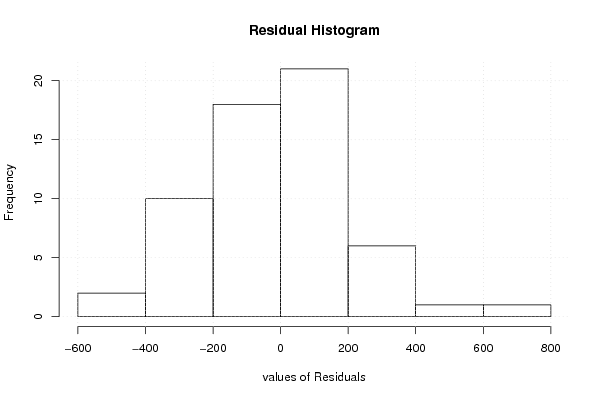
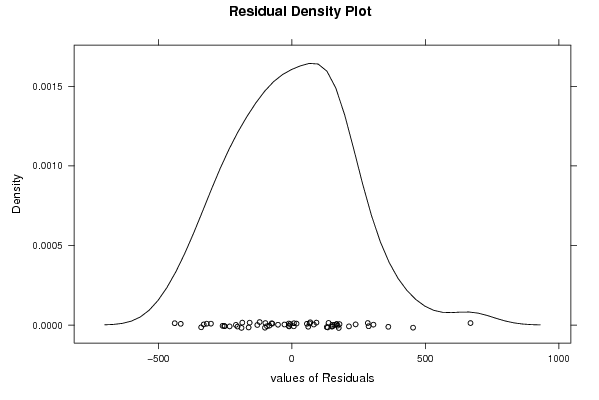
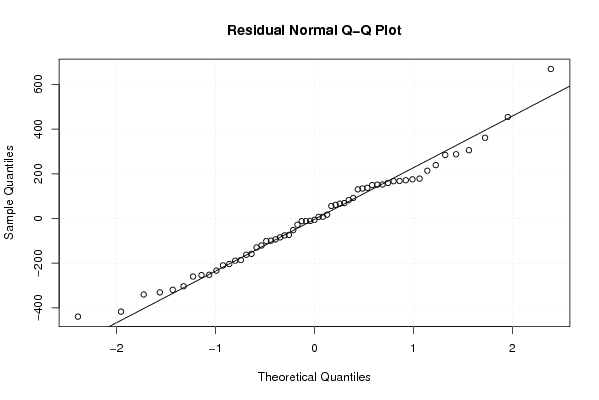
| Multiple Linear Regression - Residual Statistics | |
| Residual Standard Deviation | 254.921020964398 |
| Sum Squared Residuals | 2794343.25796983 |
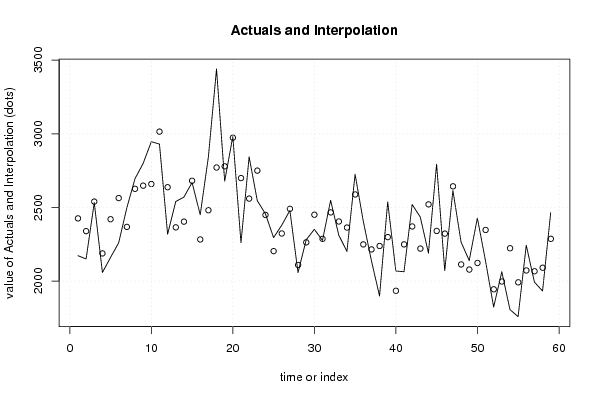
| Multiple Linear Regression - Actuals, Interpolation, and Residuals | |||
| Time or Index | Actuals | Interpolation Forecast | Residuals Prediction Error |
| 1 | 2172 | 2425.30431452403 | -253.30431452403 |
| 2 | 2150 | 2338.75847855192 | -188.758478551918 |
| 3 | 2533 | 2539.26548398818 | -6.26548398818243 |
| 4 | 2058 | 2187.47937251534 | -129.479372515339 |
| 5 | 2160 | 2419.52219542249 | -259.522195422492 |
| 6 | 2260 | 2563.19459421895 | -303.194594218949 |
| 7 | 2498 | 2367.43251504669 | 130.567484953307 |
| 8 | 2695 | 2625.94132284852 | 69.0586771514796 |
| 9 | 2799 | 2647.47945348769 | 151.520546512311 |
| 10 | 2946 | 2658.43121768927 | 287.568782310732 |
| 11 | 2930 | 3014.29199602901 | -84.2919960290127 |
| 12 | 2318 | 2636.87133593285 | -318.871335932853 |
| 13 | 2540 | 2364.45908934578 | 175.540910654218 |
| 14 | 2570 | 2403.17240459076 | 166.827595409244 |
| 15 | 2669 | 2680.73630054457 | -11.7363005445745 |
| 16 | 2450 | 2282.15351107904 | 167.846488920963 |
| 17 | 2842 | 2480.67364615608 | 361.326353843916 |
| 18 | 3440 | 2770.81487835842 | 669.185121641579 |
| 19 | 2678 | 2778.80911347959 | -100.809113479587 |
| 20 | 2981 | 2973.07699932890 | 7.92300067110365 |
| 21 | 2260 | 2699.01569037035 | -439.015690370352 |
| 22 | 2844 | 2559.64161540062 | 284.358384599376 |
| 23 | 2546 | 2749.66412336614 | -203.664123366136 |
| 24 | 2456 | 2448.80919533516 | 7.19080466483707 |
| 25 | 2295 | 2202.89289429536 | 92.1071057046404 |
| 26 | 2379 | 2322.76264499875 | 56.2373550012491 |
| 27 | 2479 | 2490.10373085277 | -11.1037308527658 |
| 28 | 2057 | 2108.98433312889 | -51.9843331288926 |
| 29 | 2280 | 2262.50733142375 | 17.4926685762466 |
| 30 | 2351 | 2450.11187886881 | -99.1118788688148 |
| 31 | 2276 | 2286.50675338063 | -10.5067533806252 |
| 32 | 2548 | 2465.88487453426 | 82.1151254657393 |
| 33 | 2311 | 2404.23645170154 | -93.2364517015436 |
| 34 | 2201 | 2363.01025920487 | -162.010259204873 |
| 35 | 2725 | 2587.66207488754 | 137.337925112458 |
| 36 | 2408 | 2248.73711794816 | 159.262882051844 |
| 37 | 2139 | 2214.58033413248 | -75.5803341324816 |
| 38 | 1898 | 2237.86835056424 | -339.868350564244 |
| 39 | 2537 | 2298.17823486621 | 238.821765133794 |
| 40 | 2068 | 1933.62147790025 | 134.378522099754 |
| 41 | 2063 | 2248.73482235099 | -185.734822350993 |
| 42 | 2520 | 2370.43681059166 | 149.563189408344 |
| 43 | 2434 | 2220.20803392362 | 213.791966076381 |
| 44 | 2190 | 2520.36579192279 | -330.365791922789 |
| 45 | 2794 | 2340.01700288629 | 453.98299711371 |
| 46 | 2070 | 2321.79088762256 | -251.790887622561 |
| 47 | 2615 | 2642.84638891838 | -27.8463889183824 |
| 48 | 2265 | 2112.58235078383 | 152.417649216172 |
| 49 | 2139 | 2077.76336770235 | 61.2366322976532 |
| 50 | 2428 | 2122.43812129433 | 305.561878705669 |
| 51 | 2137 | 2346.71624974827 | -209.716249748271 |
| 52 | 1823 | 1943.76130537649 | -120.761305376485 |
| 53 | 2063 | 1996.56200464668 | 66.4379953533226 |
| 54 | 1806 | 2222.44183796216 | -416.441837962159 |
| 55 | 1758 | 1991.04358416948 | -233.043584169476 |
| 56 | 2243 | 2071.73101136553 | 171.268988634467 |
| 57 | 1993 | 2066.25140155413 | -73.2514015541256 |
| 58 | 1932 | 2090.12602008267 | -158.126020082673 |
| 59 | 2465 | 2286.53541679893 | 178.464583201073 |
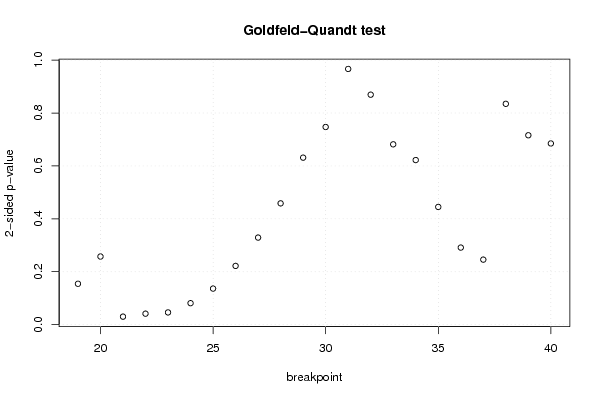
| Goldfeld-Quandt test for Heteroskedasticity | |||
| p-values | Alternative Hypothesis | ||
| breakpoint index | greater | 2-sided | less |
| 19 | 0.9228131509526 | 0.1543736980948 | 0.0771868490474 |
| 20 | 0.871305105500001 | 0.257389788999997 | 0.128694894499999 |
| 21 | 0.984940747942303 | 0.0301185041153943 | 0.0150592520576971 |
| 22 | 0.979330728410618 | 0.0413385431787632 | 0.0206692715893816 |
| 23 | 0.976941752670021 | 0.0461164946599578 | 0.0230582473299789 |
| 24 | 0.959478231910724 | 0.081043536178551 | 0.0405217680892755 |
| 25 | 0.931896616627819 | 0.136206766744363 | 0.0681033833721815 |
| 26 | 0.889014984708678 | 0.221970030582644 | 0.110985015291322 |
| 27 | 0.835480112328612 | 0.329039775342776 | 0.164519887671388 |
| 28 | 0.770777444203218 | 0.458445111593564 | 0.229222555796782 |
| 29 | 0.68438173009147 | 0.63123653981706 | 0.31561826990853 |
| 30 | 0.62644898695351 | 0.74710202609298 | 0.37355101304649 |
| 31 | 0.516734304998641 | 0.966531390002718 | 0.483265695001359 |
| 32 | 0.434614962934235 | 0.86922992586847 | 0.565385037065765 |
| 33 | 0.340806889675309 | 0.681613779350618 | 0.659193110324691 |
| 34 | 0.31104403520434 | 0.62208807040868 | 0.68895596479566 |
| 35 | 0.222429617765780 | 0.444859235531559 | 0.77757038223422 |
| 36 | 0.145634303519472 | 0.291268607038943 | 0.854365696480529 |
| 37 | 0.122837224132581 | 0.245674448265161 | 0.87716277586742 |
| 38 | 0.417357875312944 | 0.834715750625889 | 0.582642124687056 |
| 39 | 0.357913879119111 | 0.715827758238222 | 0.642086120880889 |
| 40 | 0.342421016676329 | 0.684842033352657 | 0.657578983323671 |
| Meta Analysis of Goldfeld-Quandt test for Heteroskedasticity | |||
| Description | # significant tests | % significant tests | OK/NOK |
| 1% type I error level | 0 | 0 | OK |
| 5% type I error level | 3 | 0.136363636363636 | NOK |
| 10% type I error level | 4 | 0.181818181818182 | NOK |