| Multiple Linear Regression - Estimated Regression Equation |
| Y[t] = -513.810663688752 + 1.63308823271502X[t] + 0.468641624549366Y1[t] + 0.467230093477431Y2[t] -78.0707028585922M1[t] -49.7223636565174M2[t] -1482.34079692405M3[t] + 161.088672144258M4[t] + 702.060124181986M5[t] -59.3880078675724M6[t] -412.849543664895M7[t] -1029.54724635694M8[t] -241.784142392865M9[t] + 358.552685645115M10[t] + 291.710793442415M11[t] + e[t] |
| Multiple Linear Regression - Ordinary Least Squares | |||||
| Variable | Parameter | S.D. | T-STAT H0: parameter = 0 | 2-tail p-value | 1-tail p-value |
| (Intercept) | -513.810663688752 | 633.711693 | -0.8108 | 0.421485 | 0.210743 |
| X | 1.63308823271502 | 1.129062 | 1.4464 | 0.15456 | 0.07728 |
| Y1 | 0.468641624549366 | 0.131392 | 3.5668 | 0.000831 | 0.000416 |
| Y2 | 0.467230093477431 | 0.143941 | 3.246 | 0.002137 | 0.001068 |
| M1 | -78.0707028585922 | 193.120067 | -0.4043 | 0.687817 | 0.343909 |
| M2 | -49.7223636565174 | 191.627779 | -0.2595 | 0.796379 | 0.39819 |
| M3 | -1482.34079692405 | 197.254797 | -7.5149 | 0 | 0 |
| M4 | 161.088672144258 | 303.53858 | 0.5307 | 0.598072 | 0.299036 |
| M5 | 702.060124181986 | 241.224746 | 2.9104 | 0.005458 | 0.002729 |
| M6 | -59.3880078675724 | 200.385357 | -0.2964 | 0.768227 | 0.384113 |
| M7 | -412.849543664895 | 205.566596 | -2.0083 | 0.050251 | 0.025125 |
| M8 | -1029.54724635694 | 209.322581 | -4.9185 | 1.1e-05 | 5e-06 |
| M9 | -241.784142392865 | 239.460523 | -1.0097 | 0.3177 | 0.15885 |
| M10 | 358.552685645115 | 206.899391 | 1.733 | 0.08952 | 0.04476 |
| M11 | 291.710793442415 | 200.357394 | 1.456 | 0.151916 | 0.075958 |
| Multiple Linear Regression - Regression Statistics | |
| Multiple R | 0.924165273843683 |
| R-squared | 0.85408145337857 |
| Adjusted R-squared | 0.811521877280653 |
| F-TEST (value) | 20.0679032002945 |
| F-TEST (DF numerator) | 14 |
| F-TEST (DF denominator) | 48 |
| p-value | 2.10942374678780e-15 |
| Multiple Linear Regression - Residual Statistics | |
| Residual Standard Deviation | 311.962855999084 |
| Sum Squared Residuals | 4671399.52910904 |
| Multiple Linear Regression - Actuals, Interpolation, and Residuals | |||
| Time or Index | Actuals | Interpolation Forecast | Residuals Prediction Error |
| 1 | 4132 | 4548.3525244822 | -416.352524482203 |
| 2 | 4685 | 4355.65527499672 | 329.344725003276 |
| 3 | 3172 | 3100.08370688245 | 71.9162931175536 |
| 4 | 4280 | 4320.59913965674 | -40.5991396567388 |
| 5 | 4207 | 4677.17255672924 | -470.17255672924 |
| 6 | 4158 | 4395.93835319514 | -237.938353195142 |
| 7 | 3933 | 3957.64308101489 | -24.6430810148915 |
| 8 | 3151 | 3214.23982645156 | -63.239826451562 |
| 9 | 3616 | 3523.86605605475 | 92.1339439452506 |
| 10 | 4221 | 3973.4811299434 | 247.518870056596 |
| 11 | 4436 | 4399.2639728965 | 36.7360271034989 |
| 12 | 4807 | 4473.02136472618 | 333.97863527382 |
| 13 | 4849 | 4659.47264527676 | 189.52735472324 |
| 14 | 5024 | 4884.11247385547 | 139.887526144535 |
| 15 | 3521 | 3638.05057691131 | -117.050576911305 |
| 16 | 4650 | 4671.94165650219 | -21.9416565021865 |
| 17 | 5393 | 5038.12958392686 | 354.870416073145 |
| 18 | 5147 | 5126.25554273005 | 20.7444572699457 |
| 19 | 4845 | 4976.89762679116 | -131.897626791163 |
| 20 | 3995 | 4106.99772695519 | -111.997726955194 |
| 21 | 4493 | 4348.77960889126 | 144.220391108739 |
| 22 | 4680 | 4780.45512180086 | -100.455121800865 |
| 23 | 5463 | 5017.59891761351 | 445.401082386493 |
| 24 | 4761 | 5170.40801427723 | -409.408014277234 |
| 25 | 5307 | 5127.5589659451 | 179.441034054899 |
| 26 | 5069 | 5083.79010652997 | -14.7901065299732 |
| 27 | 3501 | 3871.49774459598 | -370.497744595976 |
| 28 | 4952 | 4678.69491351954 | 273.305086480462 |
| 29 | 5152 | 5157.25004680949 | -5.2500468094948 |
| 30 | 5317 | 5115.22228185868 | 201.777718141319 |
| 31 | 5189 | 4896.60469168776 | 292.395308312241 |
| 32 | 4030 | 4282.31603238274 | -252.316032382739 |
| 33 | 4420 | 4473.65039445984 | -53.6503944598448 |
| 34 | 4571 | 4695.64071893916 | -124.640718939156 |
| 35 | 4551 | 4854.02094854345 | -303.020948543453 |
| 36 | 4819 | 4613.69053732885 | 205.309462671148 |
| 37 | 5133 | 4627.37486448922 | 505.625135510784 |
| 38 | 4532 | 4908.49728005916 | -376.497280059163 |
| 39 | 3339 | 3432.38842082142 | -93.3884208214166 |
| 40 | 4380 | 4252.25402794954 | 127.745972050455 |
| 41 | 4632 | 4686.11488027214 | -54.114880272142 |
| 42 | 4719 | 4504.6546414283 | 214.345358571696 |
| 43 | 4212 | 4281.94441056693 | -69.944410566933 |
| 44 | 3615 | 3474.82677529176 | 140.173224708241 |
| 45 | 3420 | 3750.82443670495 | -330.824436704947 |
| 46 | 4571 | 3966.14198805534 | 604.85801194466 |
| 47 | 4407 | 4323.10041399014 | 83.8995860098644 |
| 48 | 4386 | 4487.414967016 | -101.414967016003 |
| 49 | 4386 | 4288.58220182456 | 97.4177981754405 |
| 50 | 4744 | 4321.81650315804 | 422.183496841956 |
| 51 | 3185 | 3138.62618311494 | 46.3738168850645 |
| 52 | 3890 | 4228.51026237199 | -338.510262371992 |
| 53 | 4520 | 4345.33293226227 | 174.667067737732 |
| 54 | 3990 | 4188.92918078782 | -198.929180787818 |
| 55 | 3809 | 3874.91018993925 | -65.9101899392526 |
| 56 | 3236 | 2948.61963891875 | 287.380361081253 |
| 57 | 3551 | 3402.8795038892 | 148.120496110802 |
| 58 | 3264 | 3891.28104126124 | -627.281041261236 |
| 59 | 3579 | 3842.0157469564 | -263.015746956404 |
| 60 | 3537 | 3565.46511665173 | -28.4651166517309 |
| 61 | 3038 | 3593.65879798216 | -555.65879798216 |
| 62 | 2888 | 3388.12836140063 | -500.12836140063 |
| 63 | 2198 | 1735.35336767392 | 462.646632326079 |
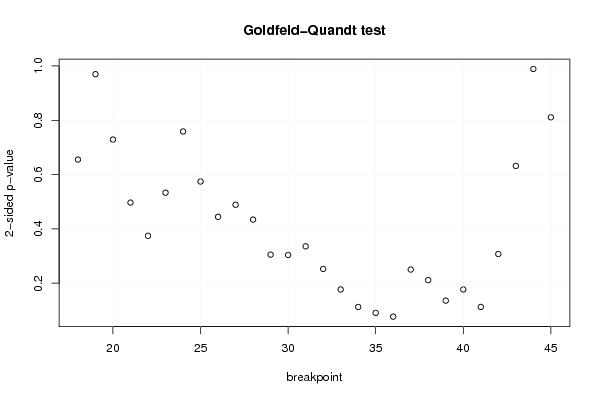
| Goldfeld-Quandt test for Heteroskedasticity | |||
| p-values | Alternative Hypothesis | ||
| breakpoint index | greater | 2-sided | less |
| 18 | 0.672387104846233 | 0.655225790307534 | 0.327612895153767 |
| 19 | 0.51506260457045 | 0.96987479085910 | 0.48493739542955 |
| 20 | 0.364499193899589 | 0.728998387799179 | 0.635500806100411 |
| 21 | 0.248356007938696 | 0.496712015877391 | 0.751643992061304 |
| 22 | 0.187178558567576 | 0.374357117135153 | 0.812821441432424 |
| 23 | 0.266627437599854 | 0.533254875199709 | 0.733372562400146 |
| 24 | 0.37942370872148 | 0.75884741744296 | 0.62057629127852 |
| 25 | 0.287211067147077 | 0.574422134294153 | 0.712788932852924 |
| 26 | 0.222221873200782 | 0.444443746401563 | 0.777778126799218 |
| 27 | 0.244418847316266 | 0.488837694632531 | 0.755581152683734 |
| 28 | 0.217039711494073 | 0.434079422988145 | 0.782960288505927 |
| 29 | 0.15255274986675 | 0.3051054997335 | 0.84744725013325 |
| 30 | 0.151963518531523 | 0.303927037063047 | 0.848036481468477 |
| 31 | 0.167798541011723 | 0.335597082023446 | 0.832201458988277 |
| 32 | 0.126221831189835 | 0.25244366237967 | 0.873778168810165 |
| 33 | 0.08842526738596 | 0.17685053477192 | 0.91157473261404 |
| 34 | 0.0561646709894261 | 0.112329341978852 | 0.943835329010574 |
| 35 | 0.0452831092037054 | 0.0905662184074107 | 0.954716890796295 |
| 36 | 0.0383375551111314 | 0.0766751102222628 | 0.961662444888869 |
| 37 | 0.125120231615131 | 0.250240463230262 | 0.874879768384869 |
| 38 | 0.105711012358064 | 0.211422024716128 | 0.894288987641936 |
| 39 | 0.0678509194205842 | 0.135701838841168 | 0.932149080579416 |
| 40 | 0.0884404561130894 | 0.176880912226179 | 0.91155954388691 |
| 41 | 0.0562219246350734 | 0.112443849270147 | 0.943778075364927 |
| 42 | 0.153696224061077 | 0.307392448122154 | 0.846303775938923 |
| 43 | 0.315937379778168 | 0.631874759556336 | 0.684062620221832 |
| 44 | 0.505470182413991 | 0.989059635172017 | 0.494529817586009 |
| 45 | 0.405439662316301 | 0.810879324632602 | 0.594560337683699 |
| Meta Analysis of Goldfeld-Quandt test for Heteroskedasticity | |||
| Description | # significant tests | % significant tests | OK/NOK |
| 1% type I error level | 0 | 0 | OK |
| 5% type I error level | 0 | 0 | OK |
| 10% type I error level | 2 | 0.0714285714285714 | OK |