| Multiple Linear Regression - Estimated Regression Equation |
| WK<25j[t] = + 165.733743201702 -2.98888626152753ExpBE[t] -1.75138330574603M1[t] -4.24913691179949M2[t] -2.96911799479788M3[t] -12.4262000472925M4[t] -17.5217309056515M5[t] -13.8261527547884M6[t] + 18.4547647197919M7[t] + 20.0043509103807M8[t] + 30.5861432962875M9[t] + 19.5503901631591M10[t] + 7.7213052731142M11[t] + 0.334641759281152t + e[t] |
| Multiple Linear Regression - Ordinary Least Squares | |||||
| Variable | Parameter | S.D. | T-STAT H0: parameter = 0 | 2-tail p-value | 1-tail p-value |
| (Intercept) | 165.733743201702 | 18.800964 | 8.8152 | 0 | 0 |
| ExpBE | -2.98888626152753 | 1.403729 | -2.1292 | 0.038618 | 0.019309 |
| M1 | -1.75138330574603 | 4.264698 | -0.4107 | 0.683221 | 0.341611 |
| M2 | -4.24913691179949 | 4.287849 | -0.991 | 0.326884 | 0.163442 |
| M3 | -2.96911799479788 | 5.61351 | -0.5289 | 0.599402 | 0.299701 |
| M4 | -12.4262000472925 | 4.444025 | -2.7962 | 0.007522 | 0.003761 |
| M5 | -17.5217309056515 | 4.438739 | -3.9475 | 0.000268 | 0.000134 |
| M6 | -13.8261527547884 | 4.891554 | -2.8265 | 0.006941 | 0.003471 |
| M7 | 18.4547647197919 | 4.241027 | 4.3515 | 7.5e-05 | 3.7e-05 |
| M8 | 20.0043509103807 | 5.062632 | 3.9514 | 0.000265 | 0.000133 |
| M9 | 30.5861432962875 | 4.95176 | 6.1768 | 0 | 0 |
| M10 | 19.5503901631591 | 4.963575 | 3.9388 | 0.000276 | 0.000138 |
| M11 | 7.7213052731142 | 4.584688 | 1.6842 | 0.098927 | 0.049464 |
| t | 0.334641759281152 | 0.126068 | 2.6545 | 0.010873 | 0.005437 |
| Multiple Linear Regression - Regression Statistics | |
| Multiple R | 0.939979664256332 |
| R-squared | 0.883561769215446 |
| Adjusted R-squared | 0.850655312689376 |
| F-TEST (value) | 26.8507114558341 |
| F-TEST (DF numerator) | 13 |
| F-TEST (DF denominator) | 46 |
| p-value | 0 |
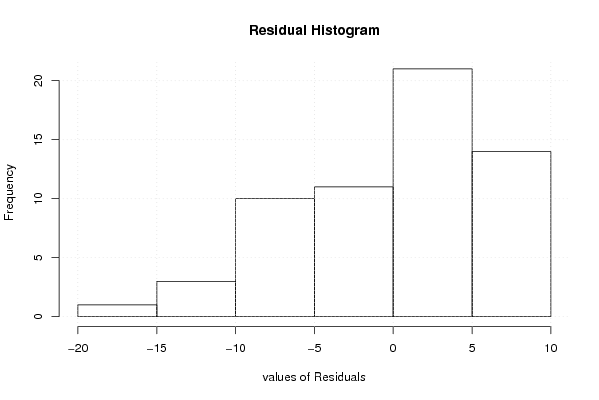
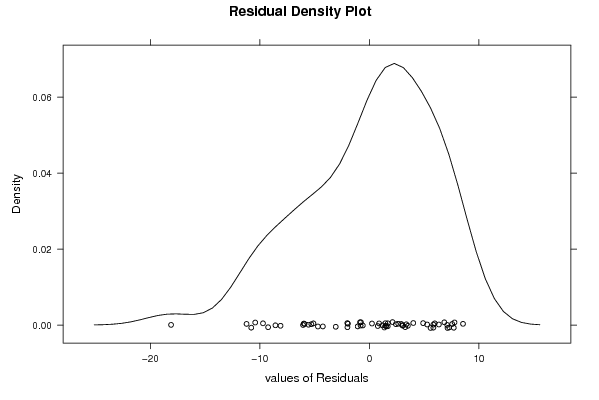
| Multiple Linear Regression - Residual Statistics | |
| Residual Standard Deviation | 6.666554877216 |
| Sum Squared Residuals | 2044.37588082289 |
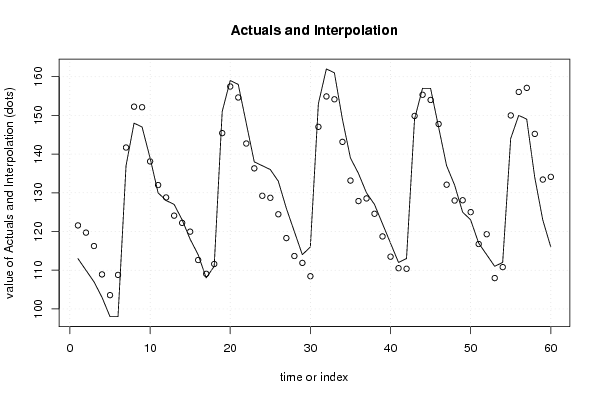
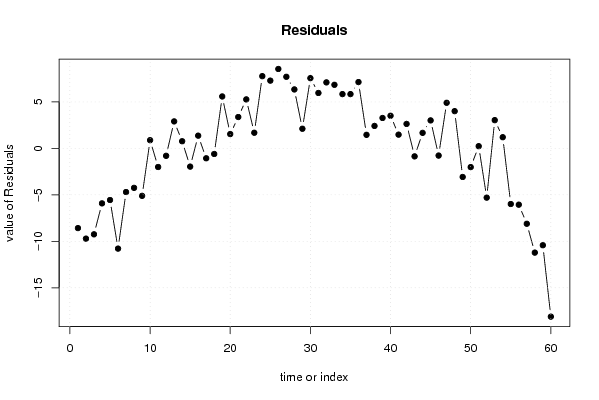
| Multiple Linear Regression - Actuals, Interpolation, and Residuals | |||
| Time or Index | Actuals | Interpolation Forecast | Residuals Prediction Error |
| 1 | 113 | 121.575928115394 | -8.57592811539369 |
| 2 | 110 | 119.711704894774 | -9.7117048947742 |
| 3 | 107 | 116.245258926460 | -9.24525892646015 |
| 4 | 103 | 108.916150390163 | -5.91615039016317 |
| 5 | 98 | 103.557484038780 | -5.55748403877987 |
| 6 | 98 | 108.783258453535 | -10.7832584535351 |
| 7 | 137 | 141.697706313549 | -4.69770631354935 |
| 8 | 148 | 152.249704421849 | -4.24970442184912 |
| 9 | 147 | 152.107259399385 | -5.10725939938521 |
| 10 | 139 | 138.118373137858 | 0.881626862142338 |
| 11 | 130 | 132.003925277843 | -2.00392527784344 |
| 12 | 128 | 128.801702530149 | -0.801702530148966 |
| 13 | 127 | 124.097186096004 | 2.90281390399620 |
| 14 | 123 | 122.232962875384 | 0.767037124615754 |
| 15 | 118 | 119.962071411681 | -1.96207141168123 |
| 16 | 114 | 112.632962875384 | 1.36703712461575 |
| 17 | 108 | 109.067628280917 | -1.06762828091747 |
| 18 | 111 | 111.603405060298 | -0.603405060297926 |
| 19 | 151 | 145.414518798770 | 5.58548120122961 |
| 20 | 159 | 157.460960037834 | 1.53903996216601 |
| 21 | 158 | 154.628517379995 | 3.37148262000474 |
| 22 | 148 | 142.731851501537 | 5.26814849846299 |
| 23 | 138 | 136.31851501537 | 1.68148498462995 |
| 24 | 137 | 129.230740127690 | 7.76925987231025 |
| 25 | 136 | 128.710664459683 | 7.28933554031686 |
| 26 | 133 | 124.455332229842 | 8.54466777015844 |
| 27 | 126 | 118.298888626153 | 7.70111137384724 |
| 28 | 120 | 113.659777725231 | 6.34022227476945 |
| 29 | 114 | 111.887774887680 | 2.11222511231972 |
| 30 | 116 | 108.445779144006 | 7.55422085599431 |
| 31 | 153 | 147.039110900922 | 5.9608890990778 |
| 32 | 162 | 154.901111373847 | 7.09888862615275 |
| 33 | 161 | 154.160889099078 | 6.83911090092221 |
| 34 | 149 | 143.160889099078 | 5.8391109009222 |
| 35 | 139 | 133.160889099078 | 5.8391109009222 |
| 36 | 135 | 127.866445968314 | 7.13355403168597 |
| 37 | 130 | 128.541924804918 | 1.45807519508158 |
| 38 | 127 | 124.585481201230 | 2.4145187987704 |
| 39 | 122 | 118.727926223694 | 3.27207377630646 |
| 40 | 117 | 113.491038070466 | 3.50896192953416 |
| 41 | 112 | 110.523480728305 | 1.47651927169544 |
| 42 | 113 | 110.369259872310 | 2.63074012768976 |
| 43 | 149 | 149.859257507685 | -0.859257507685013 |
| 44 | 157 | 155.330148971388 | 1.66985102861196 |
| 45 | 157 | 153.992149444313 | 3.00785055568692 |
| 46 | 147 | 147.774367462757 | -0.774367462757131 |
| 47 | 137 | 132.095483565855 | 4.90451643414517 |
| 48 | 132 | 127.996594939702 | 4.00340506029793 |
| 49 | 125 | 128.074296524001 | -3.07429652400096 |
| 50 | 123 | 125.014518798770 | -2.01451879877039 |
| 51 | 117 | 116.765854812012 | 0.234145187987687 |
| 52 | 114 | 119.300070938756 | -5.30007093875619 |
| 53 | 111 | 107.963632064318 | 3.03636793568217 |
| 54 | 112 | 110.798297469851 | 1.20170253014896 |
| 55 | 144 | 149.989406479073 | -5.98940647907305 |
| 56 | 150 | 156.058075195082 | -6.05807519508159 |
| 57 | 149 | 157.111184677229 | -8.11118467722866 |
| 58 | 134 | 145.214518798770 | -11.2145187987704 |
| 59 | 123 | 133.421187041854 | -10.4211870418539 |
| 60 | 116 | 134.104516434145 | -18.1045164341452 |
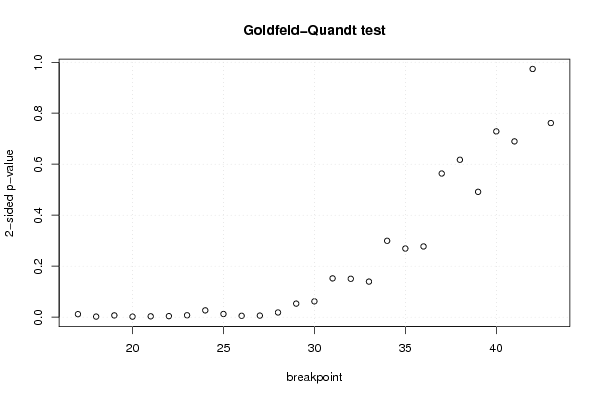
| Goldfeld-Quandt test for Heteroskedasticity | |||
| p-values | Alternative Hypothesis | ||
| breakpoint index | greater | 2-sided | less |
| 17 | 0.00589557865258369 | 0.0117911573051674 | 0.994104421347416 |
| 18 | 0.00111266102964024 | 0.00222532205928048 | 0.99888733897036 |
| 19 | 0.00349789206442785 | 0.00699578412885571 | 0.996502107935572 |
| 20 | 0.00101001320057903 | 0.00202002640115805 | 0.998989986799421 |
| 21 | 0.00167211238484181 | 0.00334422476968363 | 0.998327887615158 |
| 22 | 0.00202615177534028 | 0.00405230355068056 | 0.99797384822466 |
| 23 | 0.00374422469235083 | 0.00748844938470166 | 0.99625577530765 |
| 24 | 0.0133630645071658 | 0.0267261290143316 | 0.986636935492834 |
| 25 | 0.00621546424712366 | 0.0124309284942473 | 0.993784535752876 |
| 26 | 0.00270044719856279 | 0.00540089439712558 | 0.997299552801437 |
| 27 | 0.00307873171639656 | 0.00615746343279312 | 0.996921268283604 |
| 28 | 0.00923583467286824 | 0.0184716693457365 | 0.990764165327132 |
| 29 | 0.0265422671746758 | 0.0530845343493516 | 0.973457732825324 |
| 30 | 0.0310161031522474 | 0.0620322063044948 | 0.968983896847753 |
| 31 | 0.0760951574481819 | 0.152190314896364 | 0.923904842551818 |
| 32 | 0.0752806607426773 | 0.150561321485355 | 0.924719339257323 |
| 33 | 0.0697609239116624 | 0.139521847823325 | 0.930239076088338 |
| 34 | 0.149803650076296 | 0.299607300152592 | 0.850196349923704 |
| 35 | 0.134625996049997 | 0.269251992099993 | 0.865374003950003 |
| 36 | 0.138711674472809 | 0.277423348945619 | 0.861288325527191 |
| 37 | 0.281776439972804 | 0.563552879945609 | 0.718223560027196 |
| 38 | 0.308722428913063 | 0.617444857826125 | 0.691277571086937 |
| 39 | 0.245844774073829 | 0.491689548147657 | 0.754155225926171 |
| 40 | 0.364377502859451 | 0.728755005718903 | 0.635622497140549 |
| 41 | 0.344811488328574 | 0.689622976657148 | 0.655188511671426 |
| 42 | 0.513126600502159 | 0.973746798995682 | 0.486873399497841 |
| 43 | 0.619203462206698 | 0.761593075586604 | 0.380796537793302 |
| Meta Analysis of Goldfeld-Quandt test for Heteroskedasticity | |||
| Description | # significant tests | % significant tests | OK/NOK |
| 1% type I error level | 8 | 0.296296296296296 | NOK |
| 5% type I error level | 12 | 0.444444444444444 | NOK |
| 10% type I error level | 14 | 0.518518518518518 | NOK |