| Multiple Linear Regression - Estimated Regression Equation |
| Werk[t] = + 386446.478226036 + 26.6794038315384Bouwvergun[t] -5.16843871470594Auto[t] + 0.279876360124689Hyp[t] + 36329.1227013538M1[t] + 33986.2757199777M2[t] + 33433.7741251689M3[t] + 22139.4363417723M4[t] + 3594.12117399042M5[t] -38101.8143140329M6[t] + 65990.9868913048M7[t] + 48232.3230425884M8[t] + 43147.6305551091M9[t] + 34906.1567168134M10[t] + 3146.90939054105M11[t] -700.464388065671t + e[t] |
| Multiple Linear Regression - Ordinary Least Squares | |||||
| Variable | Parameter | S.D. | T-STAT H0: parameter = 0 | 2-tail p-value | 1-tail p-value |
| (Intercept) | 386446.478226036 | 75939.864683 | 5.0888 | 7e-06 | 3e-06 |
| Bouwvergun | 26.6794038315384 | 5.304573 | 5.0295 | 8e-06 | 4e-06 |
| Auto | -5.16843871470594 | 1.491931 | -3.4643 | 0.001179 | 0.000589 |
| Hyp | 0.279876360124689 | 0.065804 | 4.2532 | 0.000105 | 5.3e-05 |
| M1 | 36329.1227013538 | 14514.449541 | 2.503 | 0.016014 | 0.008007 |
| M2 | 33986.2757199777 | 16171.327203 | 2.1016 | 0.041215 | 0.020608 |
| M3 | 33433.7741251689 | 14536.218422 | 2.3 | 0.026138 | 0.013069 |
| M4 | 22139.4363417723 | 12671.763158 | 1.7471 | 0.087434 | 0.043717 |
| M5 | 3594.12117399042 | 16145.89278 | 0.2226 | 0.824852 | 0.412426 |
| M6 | -38101.8143140329 | 23334.742015 | -1.6328 | 0.109482 | 0.054741 |
| M7 | 65990.9868913048 | 14355.75533 | 4.5968 | 3.5e-05 | 1.7e-05 |
| M8 | 48232.3230425884 | 12672.224013 | 3.8061 | 0.000424 | 0.000212 |
| M9 | 43147.6305551091 | 13873.233955 | 3.1101 | 0.003241 | 0.001621 |
| M10 | 34906.1567168134 | 12534.753672 | 2.7848 | 0.007809 | 0.003905 |
| M11 | 3146.90939054105 | 11795.719881 | 0.2668 | 0.790854 | 0.395427 |
| t | -700.464388065671 | 237.518768 | -2.9491 | 0.005041 | 0.00252 |
| Multiple Linear Regression - Regression Statistics | |
| Multiple R | 0.928817949369446 |
| R-squared | 0.862702783070862 |
| Adjusted R-squared | 0.816937044094483 |
| F-TEST (value) | 18.8504064911117 |
| F-TEST (DF numerator) | 15 |
| F-TEST (DF denominator) | 45 |
| p-value | 1.39888101102770e-14 |
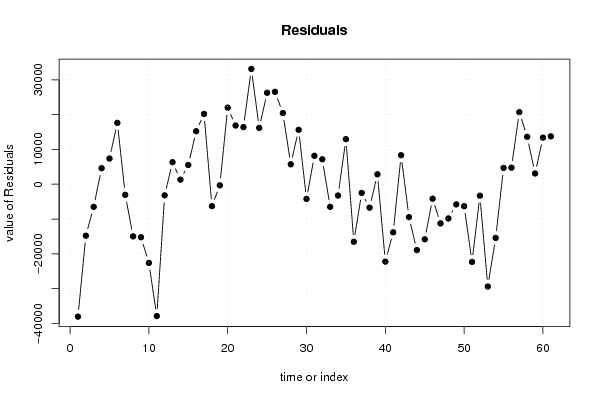
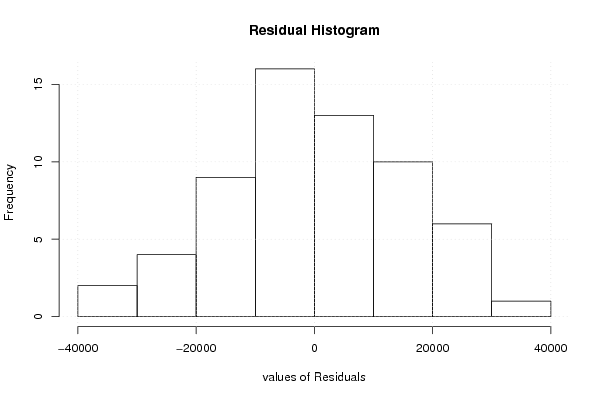
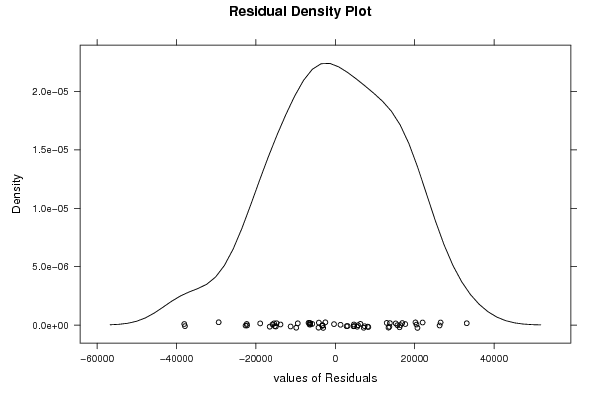
| Multiple Linear Regression - Residual Statistics | |
| Residual Standard Deviation | 18170.9469313304 |
| Sum Squared Residuals | 14858249057.1551 |
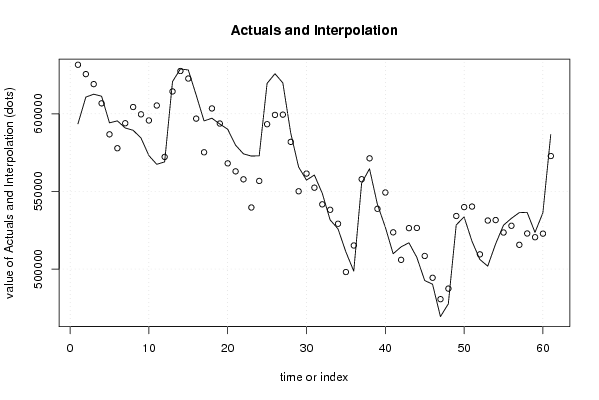
| Multiple Linear Regression - Actuals, Interpolation, and Residuals | |||
| Time or Index | Actuals | Interpolation Forecast | Residuals Prediction Error |
| 1 | 593530 | 631579.073460067 | -38049.0734600667 |
| 2 | 610763 | 625555.341940788 | -14792.3419407877 |
| 3 | 612613 | 619115.895723742 | -6502.89572374163 |
| 4 | 611324 | 606733.910535848 | 4590.08946415201 |
| 5 | 594167 | 586786.480223063 | 7380.51977693703 |
| 6 | 595454 | 577818.495177945 | 17635.5048220551 |
| 7 | 590865 | 593919.722830226 | -3054.72283022557 |
| 8 | 589379 | 604363.024347799 | -14984.0243477991 |
| 9 | 584428 | 599668.525213052 | -15240.5252130517 |
| 10 | 573100 | 595716.204867436 | -22616.2048674363 |
| 11 | 567456 | 605340.765148386 | -37884.7651483865 |
| 12 | 569028 | 572229.568890862 | -3201.56889086211 |
| 13 | 620735 | 614414.031748496 | 6320.96825150442 |
| 14 | 628884 | 627571.195592187 | 1312.80440781297 |
| 15 | 628232 | 622708.868069266 | 5523.1319307338 |
| 16 | 612117 | 596893.299507151 | 15223.7004928486 |
| 17 | 595404 | 575211.684764429 | 20192.3152355708 |
| 18 | 597141 | 603449.035479807 | -6308.03547980718 |
| 19 | 593408 | 593733.281092679 | -325.281092678557 |
| 20 | 590072 | 568077.068862658 | 21994.9311373415 |
| 21 | 579799 | 562935.501553134 | 16863.4984468656 |
| 22 | 574205 | 557809.701877482 | 16395.2981225175 |
| 23 | 572775 | 539661.111011880 | 33113.8889881204 |
| 24 | 572942 | 556759.87098314 | 16182.1290168599 |
| 25 | 619567 | 593290.934844784 | 26276.0651552163 |
| 26 | 625809 | 599272.098536986 | 26536.9014630141 |
| 27 | 619916 | 599463.50449288 | 20452.4955071202 |
| 28 | 587625 | 581908.746952475 | 5716.25304752492 |
| 29 | 565742 | 550108.350086408 | 15633.6499135916 |
| 30 | 557274 | 561503.883189171 | -4229.88318917053 |
| 31 | 560576 | 552417.433807954 | 8158.5661920459 |
| 32 | 548854 | 541694.534299039 | 7159.46570096127 |
| 33 | 531673 | 538169.096467035 | -6496.09646703502 |
| 34 | 525919 | 529167.970012101 | -3248.97001210071 |
| 35 | 511038 | 498092.524789563 | 12945.4752104372 |
| 36 | 498662 | 515192.576132338 | -16530.5761323375 |
| 37 | 555362 | 557863.167761064 | -2501.16776106392 |
| 38 | 564591 | 571329.542744059 | -6738.54274405854 |
| 39 | 541657 | 538816.647999133 | 2840.35200086744 |
| 40 | 527070 | 549301.346232329 | -22231.3462323289 |
| 41 | 509846 | 523660.213594542 | -13814.2135945418 |
| 42 | 514258 | 505933.626616995 | 8324.37338300519 |
| 43 | 516922 | 526381.983843136 | -9459.9838431365 |
| 44 | 507561 | 526482.999903789 | -18921.9999037889 |
| 45 | 492622 | 508446.132566516 | -15824.1325665156 |
| 46 | 490243 | 494394.13843659 | -4151.13843658989 |
| 47 | 469357 | 480616.304869075 | -11259.3048690747 |
| 48 | 477580 | 487422.691948718 | -9842.69194871811 |
| 49 | 528379 | 534180.703384399 | -5801.70338439863 |
| 50 | 533590 | 539908.821185981 | -6318.82118598081 |
| 51 | 517945 | 540258.08371498 | -22313.0837149798 |
| 52 | 506174 | 509472.696772197 | -3298.69677219666 |
| 53 | 501866 | 531258.271331558 | -29392.2713315576 |
| 54 | 516141 | 531562.959536083 | -15421.9595360826 |
| 55 | 528222 | 523540.578426005 | 4681.42157399472 |
| 56 | 532638 | 527886.372586715 | 4751.6274132851 |
| 57 | 536322 | 515624.744200263 | 20697.2557997366 |
| 58 | 536535 | 522913.984806391 | 13621.0151936093 |
| 59 | 523597 | 520512.294181096 | 3084.70581890354 |
| 60 | 536214 | 522821.292044942 | 13392.7079550578 |
| 61 | 586570 | 572815.088801191 | 13754.9111988086 |
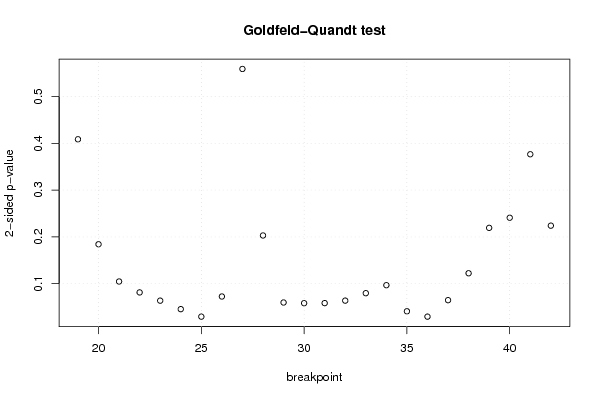
| Goldfeld-Quandt test for Heteroskedasticity | |||
| p-values | Alternative Hypothesis | ||
| breakpoint index | greater | 2-sided | less |
| 19 | 0.204323024179295 | 0.408646048358589 | 0.795676975820705 |
| 20 | 0.0921147140074487 | 0.184229428014897 | 0.907885285992551 |
| 21 | 0.0523162134872807 | 0.104632426974561 | 0.94768378651272 |
| 22 | 0.0406520902702437 | 0.0813041805404875 | 0.959347909729756 |
| 23 | 0.0318346800637909 | 0.0636693601275817 | 0.96816531993621 |
| 24 | 0.0227518821785922 | 0.0455037643571845 | 0.977248117821408 |
| 25 | 0.014736710625919 | 0.029473421251838 | 0.985263289374081 |
| 26 | 0.0362644377718795 | 0.0725288755437589 | 0.96373556222812 |
| 27 | 0.279497019060363 | 0.558994038120725 | 0.720502980939637 |
| 28 | 0.898477641158335 | 0.203044717683331 | 0.101522358841665 |
| 29 | 0.970141483718074 | 0.0597170325638529 | 0.0298585162819264 |
| 30 | 0.970887120152538 | 0.0582257596949244 | 0.0291128798474622 |
| 31 | 0.970797553316126 | 0.0584048933677472 | 0.0292024466838736 |
| 32 | 0.968141170725034 | 0.0637176585499323 | 0.0318588292749662 |
| 33 | 0.960187706438813 | 0.0796245871223746 | 0.0398122935611873 |
| 34 | 0.951650760652283 | 0.0966984786954341 | 0.0483492393477171 |
| 35 | 0.979516459219216 | 0.040967081561568 | 0.020483540780784 |
| 36 | 0.98526088620944 | 0.0294782275811178 | 0.0147391137905589 |
| 37 | 0.9676337370605 | 0.0647325258789984 | 0.0323662629394992 |
| 38 | 0.938880955726283 | 0.122238088547435 | 0.0611190442737174 |
| 39 | 0.890357441834379 | 0.219285116331243 | 0.109642558165621 |
| 40 | 0.8795428355651 | 0.240914328869802 | 0.120457164434901 |
| 41 | 0.811686814400414 | 0.376626371199172 | 0.188313185599586 |
| 42 | 0.888018630750782 | 0.223962738498436 | 0.111981369249218 |
| Meta Analysis of Goldfeld-Quandt test for Heteroskedasticity | |||
| Description | # significant tests | % significant tests | OK/NOK |
| 1% type I error level | 0 | 0 | OK |
| 5% type I error level | 4 | 0.166666666666667 | NOK |
| 10% type I error level | 14 | 0.583333333333333 | NOK |