Free Statistics
of Irreproducible Research!
Description of Statistical Computation | |||||||||||||||||||||||||||||||||||||||||||||
|---|---|---|---|---|---|---|---|---|---|---|---|---|---|---|---|---|---|---|---|---|---|---|---|---|---|---|---|---|---|---|---|---|---|---|---|---|---|---|---|---|---|---|---|---|---|
| Author's title | |||||||||||||||||||||||||||||||||||||||||||||
| Author | *The author of this computation has been verified* | ||||||||||||||||||||||||||||||||||||||||||||
| R Software Module | rwasp_bidensity.wasp | ||||||||||||||||||||||||||||||||||||||||||||
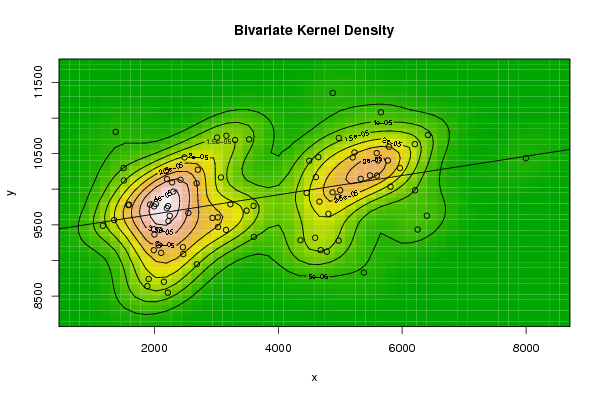
| Title produced by software | Bivariate Kernel Density Estimation | ||||||||||||||||||||||||||||||||||||||||||||
| Date of computation | Fri, 18 Dec 2009 09:21:55 -0700 | ||||||||||||||||||||||||||||||||||||||||||||
| Cite this page as follows | Statistical Computations at FreeStatistics.org, Office for Research Development and Education, URL https://freestatistics.org/blog/index.php?v=date/2009/Dec/18/t1261153431faw0jpsojf70r1i.htm/, Retrieved Sat, 27 Apr 2024 21:50:47 +0000 | ||||||||||||||||||||||||||||||||||||||||||||
| Statistical Computations at FreeStatistics.org, Office for Research Development and Education, URL https://freestatistics.org/blog/index.php?pk=69418, Retrieved Sat, 27 Apr 2024 21:50:47 +0000 | |||||||||||||||||||||||||||||||||||||||||||||
| QR Codes: | |||||||||||||||||||||||||||||||||||||||||||||
|
| |||||||||||||||||||||||||||||||||||||||||||||
| Original text written by user: | |||||||||||||||||||||||||||||||||||||||||||||
| IsPrivate? | No (this computation is public) | ||||||||||||||||||||||||||||||||||||||||||||
| User-defined keywords | kvn paper | ||||||||||||||||||||||||||||||||||||||||||||
| Estimated Impact | 148 | ||||||||||||||||||||||||||||||||||||||||||||
Tree of Dependent Computations | |||||||||||||||||||||||||||||||||||||||||||||
| Family? (F = Feedback message, R = changed R code, M = changed R Module, P = changed Parameters, D = changed Data) | |||||||||||||||||||||||||||||||||||||||||||||
| - [Kendall tau Correlation Matrix] [3/11/2009] [2009-11-02 21:25:00] [b98453cac15ba1066b407e146608df68] - RMPD [Bivariate Kernel Density Estimation] [Bivariate Kernel ...] [2009-11-11 14:33:29] [1b4c3bbe3f2ba180dd536c5a6a81a8e6] - D [Bivariate Kernel Density Estimation] [Bivariate Kernel ...] [2009-12-15 21:14:11] [1b4c3bbe3f2ba180dd536c5a6a81a8e6] - D [Bivariate Kernel Density Estimation] [Bivariate Kernel ...] [2009-12-18 16:21:55] [f1100e00818182135823a11ccbd0f3b9] [Current] - R PD [Bivariate Kernel Density Estimation] [Kernall Density P...] [2010-11-28 11:39:49] [8b017ffbf7b0eded54d8efebfb3e4cfa] - D [Bivariate Kernel Density Estimation] [Kernall Density P...] [2010-11-28 13:26:50] [8b017ffbf7b0eded54d8efebfb3e4cfa] | |||||||||||||||||||||||||||||||||||||||||||||
| Feedback Forum | |||||||||||||||||||||||||||||||||||||||||||||
Post a new message | |||||||||||||||||||||||||||||||||||||||||||||
Dataset | |||||||||||||||||||||||||||||||||||||||||||||
| Dataseries X: | |||||||||||||||||||||||||||||||||||||||||||||
1169 2154 2249 2687 4359 5382 4459 6398 4596 3024 1887 2070 1351 2218 2461 3028 4784 4975 4607 6249 4809 3157 1910 2228 1594 2467 2222 3607 4685 4962 5770 5480 5000 3228 1993 2288 1580 2111 2192 3601 4665 4876 5813 5589 5331 3075 2002 2306 1507 1992 2487 3490 4647 5594 5611 5788 6204 3013 1931 2549 1504 2090 2702 2939 4500 6208 6415 5657 5964 3163 1997 2422 1376 2202 2683 3303 5202 5231 4880 7998 4977 3531 2025 2205 | |||||||||||||||||||||||||||||||||||||||||||||
| Dataseries Y: | |||||||||||||||||||||||||||||||||||||||||||||
9487 8700 9627 8947 9283 8829 9947 9628 9318 9605 8640 9214 9567 8547 9185 9470 9123 9278 10170 9434 9655 9429 8739 9552 9784 9089 9763 9330 9144 9895 10404 10195 9987 9789 9437 10096 9776 9106 10258 9766 9826 9957 10036 10508 10146 10166 9365 9968 10123 9144 10447 9699 10451 10192 10404 10597 10633 10727 9784 9667 10297 9426 10274 9598 10400 9985 10761 11081 10297 10751 9760 10133 10806 9734 10083 10691 10446 10517 11353 10436 10721 10701 9793 10142 | |||||||||||||||||||||||||||||||||||||||||||||
Tables (Output of Computation) | |||||||||||||||||||||||||||||||||||||||||||||
| |||||||||||||||||||||||||||||||||||||||||||||
Figures (Output of Computation) | |||||||||||||||||||||||||||||||||||||||||||||
Input Parameters & R Code | |||||||||||||||||||||||||||||||||||||||||||||
| Parameters (Session): | |||||||||||||||||||||||||||||||||||||||||||||
| par1 = 50 ; par2 = 50 ; par3 = 0 ; par4 = 0 ; par5 = 0 ; par6 = Y ; par7 = Y ; | |||||||||||||||||||||||||||||||||||||||||||||
| Parameters (R input): | |||||||||||||||||||||||||||||||||||||||||||||
| par1 = 50 ; par2 = 50 ; par3 = 0 ; par4 = 0 ; par5 = 0 ; par6 = Y ; par7 = Y ; | |||||||||||||||||||||||||||||||||||||||||||||
| R code (references can be found in the software module): | |||||||||||||||||||||||||||||||||||||||||||||
par1 <- as(par1,'numeric') | |||||||||||||||||||||||||||||||||||||||||||||