Free Statistics

of Irreproducible Research!

Author's title

Author*The author of this computation has been verified*
R Software Modulerwasp_autocorrelation.wasp
Title produced by software(Partial) Autocorrelation Function
Date of computationFri, 18 Dec 2009 07:15:41 -0700
Cite this page as followsStatistical Computations at FreeStatistics.org, Office for Research Development and Education, URL https://freestatistics.org/blog/index.php?v=date/2009/Dec/18/t1261145784xf0u8no1krjlb1x.htm/, Retrieved Sat, 27 Apr 2024 18:32:52 +0000
Statistical Computations at FreeStatistics.org, Office for Research Development and Education, URL https://freestatistics.org/blog/index.php?pk=69358, Retrieved Sat, 27 Apr 2024 18:32:52 +0000
QR Codes:

Original text written by user:
IsPrivate?No (this computation is public)
User-defined keywords
Estimated Impact116
Family? (F = Feedback message, R = changed R code, M = changed R Module, P = changed Parameters, D = changed Data)
-     [Univariate Data Series] [] [2009-12-17 14:44:14] [09f192433169b2c787c4a71fde86e883]
- RMPD    [(Partial) Autocorrelation Function] [] [2009-12-18 14:15:41] [71596e6a53ccce532e52aaf6113616ef] [Current]
-   P       [(Partial) Autocorrelation Function] [] [2009-12-20 12:59:06] [09f192433169b2c787c4a71fde86e883]
Feedback Forum

Post a new message
Dataseries X:
97.4
97
105.4
102.7
98.1
104.5
87.4
89.9
109.8
111.7
98.6
96.9
95.1
97
112.7
102.9
97.4
111.4
87.4
96.8
114.1
110.3
103.9
101.6
94.6
95.9
104.7
102.8
98.1
113.9
80.9
95.7
113.2
105.9
108.8
102.3
99
100.7
115.5
100.7
109.9
114.6
85.4
100.5
114.8
116.5
112.9
102
106
105.3
118.8
106.1
109.3
117.2
92.5
104.2
112.5
122.4
113.3
100
110.7
112.8
109.8
117.3
109.1
115.9
96
99.8
116.8
115.7
99.4
94.3
91
93.2
103.1
94.1
91.8
102.7
82.6
89.1
104.5


Summary of computational transaction
Raw Inputview raw input (R code)
Raw Outputview raw output of R engine
Computing time3 seconds
R Server'Gwilym Jenkins' @ 72.249.127.135

\begin{tabular}{lllllllll}
\hline
Summary of computational transaction \tabularnewline
Raw Input & view raw input (R code)  \tabularnewline
Raw Output & view raw output of R engine  \tabularnewline
Computing time & 3 seconds \tabularnewline
R Server & 'Gwilym Jenkins' @ 72.249.127.135 \tabularnewline
\hline
\end{tabular}
%Source: https://freestatistics.org/blog/index.php?pk=69358&T=0

[TABLE]
[ROW][C]Summary of computational transaction[/C][/ROW]
[ROW][C]Raw Input[/C][C]view raw input (R code) [/C][/ROW]
[ROW][C]Raw Output[/C][C]view raw output of R engine [/C][/ROW]
[ROW][C]Computing time[/C][C]3 seconds[/C][/ROW]
[ROW][C]R Server[/C][C]'Gwilym Jenkins' @ 72.249.127.135[/C][/ROW]
[/TABLE]
Source: https://freestatistics.org/blog/index.php?pk=69358&T=0

Globally Unique Identifier (entire table): ba.freestatistics.org/blog/index.php?pk=69358&T=0

As an alternative you can also use a QR Code:  

The GUIDs for individual cells are displayed in the table below:

Summary of computational transaction
Raw Inputview raw input (R code)
Raw Outputview raw output of R engine
Computing time3 seconds
R Server'Gwilym Jenkins' @ 72.249.127.135


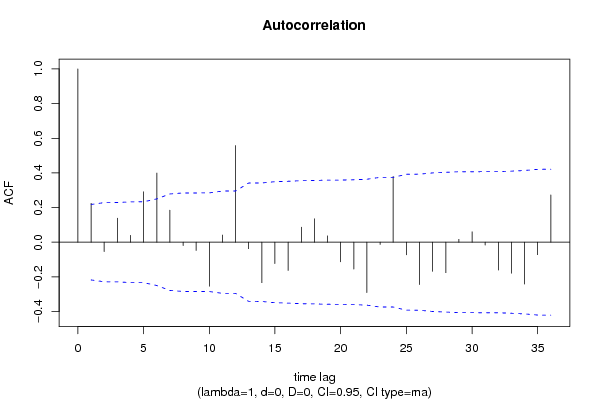
Autocorrelation Function
Time lag kACF(k)T-STATP-value
10.2244082.01970.023362
2-0.053888-0.4850.314497
30.138971.25070.107318
40.0394250.35480.361821
50.2907342.61660.005296
60.3993283.5940.000279
70.1849021.66410.049977
8-0.019677-0.17710.429939
9-0.047543-0.42790.334935
10-0.253637-2.28270.012534
110.0411630.37050.356
120.5581695.02351e-06
13-0.03746-0.33710.368441
14-0.233379-2.10040.019402
15-0.122952-1.10660.135878
16-0.162919-1.46630.073223
170.0865860.77930.219045
180.134841.21360.114222
190.0365740.32920.371439
20-0.112873-1.01590.156362
21-0.155368-1.39830.082918
22-0.290649-2.61580.005307
23-0.01315-0.11840.453041
240.3790073.41110.000506
25-0.07307-0.65760.256319
26-0.244673-2.20210.015252
27-0.167742-1.50970.067508
28-0.175819-1.58240.058731
290.016990.15290.439425
300.0602420.54220.294592
31-0.016774-0.1510.440188
32-0.161068-1.44960.075513
33-0.178867-1.60980.055666
34-0.241881-2.17690.016198
35-0.071856-0.64670.259826
360.2725922.45330.00815

\begin{tabular}{lllllllll}
\hline
Autocorrelation Function \tabularnewline
Time lag k & ACF(k) & T-STAT & P-value \tabularnewline
1 & 0.224408 & 2.0197 & 0.023362 \tabularnewline
2 & -0.053888 & -0.485 & 0.314497 \tabularnewline
3 & 0.13897 & 1.2507 & 0.107318 \tabularnewline
4 & 0.039425 & 0.3548 & 0.361821 \tabularnewline
5 & 0.290734 & 2.6166 & 0.005296 \tabularnewline
6 & 0.399328 & 3.594 & 0.000279 \tabularnewline
7 & 0.184902 & 1.6641 & 0.049977 \tabularnewline
8 & -0.019677 & -0.1771 & 0.429939 \tabularnewline
9 & -0.047543 & -0.4279 & 0.334935 \tabularnewline
10 & -0.253637 & -2.2827 & 0.012534 \tabularnewline
11 & 0.041163 & 0.3705 & 0.356 \tabularnewline
12 & 0.558169 & 5.0235 & 1e-06 \tabularnewline
13 & -0.03746 & -0.3371 & 0.368441 \tabularnewline
14 & -0.233379 & -2.1004 & 0.019402 \tabularnewline
15 & -0.122952 & -1.1066 & 0.135878 \tabularnewline
16 & -0.162919 & -1.4663 & 0.073223 \tabularnewline
17 & 0.086586 & 0.7793 & 0.219045 \tabularnewline
18 & 0.13484 & 1.2136 & 0.114222 \tabularnewline
19 & 0.036574 & 0.3292 & 0.371439 \tabularnewline
20 & -0.112873 & -1.0159 & 0.156362 \tabularnewline
21 & -0.155368 & -1.3983 & 0.082918 \tabularnewline
22 & -0.290649 & -2.6158 & 0.005307 \tabularnewline
23 & -0.01315 & -0.1184 & 0.453041 \tabularnewline
24 & 0.379007 & 3.4111 & 0.000506 \tabularnewline
25 & -0.07307 & -0.6576 & 0.256319 \tabularnewline
26 & -0.244673 & -2.2021 & 0.015252 \tabularnewline
27 & -0.167742 & -1.5097 & 0.067508 \tabularnewline
28 & -0.175819 & -1.5824 & 0.058731 \tabularnewline
29 & 0.01699 & 0.1529 & 0.439425 \tabularnewline
30 & 0.060242 & 0.5422 & 0.294592 \tabularnewline
31 & -0.016774 & -0.151 & 0.440188 \tabularnewline
32 & -0.161068 & -1.4496 & 0.075513 \tabularnewline
33 & -0.178867 & -1.6098 & 0.055666 \tabularnewline
34 & -0.241881 & -2.1769 & 0.016198 \tabularnewline
35 & -0.071856 & -0.6467 & 0.259826 \tabularnewline
36 & 0.272592 & 2.4533 & 0.00815 \tabularnewline
\hline
\end{tabular}
%Source: https://freestatistics.org/blog/index.php?pk=69358&T=1

[TABLE]
[ROW][C]Autocorrelation Function[/C][/ROW]
[ROW][C]Time lag k[/C][C]ACF(k)[/C][C]T-STAT[/C][C]P-value[/C][/ROW]
[ROW][C]1[/C][C]0.224408[/C][C]2.0197[/C][C]0.023362[/C][/ROW]
[ROW][C]2[/C][C]-0.053888[/C][C]-0.485[/C][C]0.314497[/C][/ROW]
[ROW][C]3[/C][C]0.13897[/C][C]1.2507[/C][C]0.107318[/C][/ROW]
[ROW][C]4[/C][C]0.039425[/C][C]0.3548[/C][C]0.361821[/C][/ROW]
[ROW][C]5[/C][C]0.290734[/C][C]2.6166[/C][C]0.005296[/C][/ROW]
[ROW][C]6[/C][C]0.399328[/C][C]3.594[/C][C]0.000279[/C][/ROW]
[ROW][C]7[/C][C]0.184902[/C][C]1.6641[/C][C]0.049977[/C][/ROW]
[ROW][C]8[/C][C]-0.019677[/C][C]-0.1771[/C][C]0.429939[/C][/ROW]
[ROW][C]9[/C][C]-0.047543[/C][C]-0.4279[/C][C]0.334935[/C][/ROW]
[ROW][C]10[/C][C]-0.253637[/C][C]-2.2827[/C][C]0.012534[/C][/ROW]
[ROW][C]11[/C][C]0.041163[/C][C]0.3705[/C][C]0.356[/C][/ROW]
[ROW][C]12[/C][C]0.558169[/C][C]5.0235[/C][C]1e-06[/C][/ROW]
[ROW][C]13[/C][C]-0.03746[/C][C]-0.3371[/C][C]0.368441[/C][/ROW]
[ROW][C]14[/C][C]-0.233379[/C][C]-2.1004[/C][C]0.019402[/C][/ROW]
[ROW][C]15[/C][C]-0.122952[/C][C]-1.1066[/C][C]0.135878[/C][/ROW]
[ROW][C]16[/C][C]-0.162919[/C][C]-1.4663[/C][C]0.073223[/C][/ROW]
[ROW][C]17[/C][C]0.086586[/C][C]0.7793[/C][C]0.219045[/C][/ROW]
[ROW][C]18[/C][C]0.13484[/C][C]1.2136[/C][C]0.114222[/C][/ROW]
[ROW][C]19[/C][C]0.036574[/C][C]0.3292[/C][C]0.371439[/C][/ROW]
[ROW][C]20[/C][C]-0.112873[/C][C]-1.0159[/C][C]0.156362[/C][/ROW]
[ROW][C]21[/C][C]-0.155368[/C][C]-1.3983[/C][C]0.082918[/C][/ROW]
[ROW][C]22[/C][C]-0.290649[/C][C]-2.6158[/C][C]0.005307[/C][/ROW]
[ROW][C]23[/C][C]-0.01315[/C][C]-0.1184[/C][C]0.453041[/C][/ROW]
[ROW][C]24[/C][C]0.379007[/C][C]3.4111[/C][C]0.000506[/C][/ROW]
[ROW][C]25[/C][C]-0.07307[/C][C]-0.6576[/C][C]0.256319[/C][/ROW]
[ROW][C]26[/C][C]-0.244673[/C][C]-2.2021[/C][C]0.015252[/C][/ROW]
[ROW][C]27[/C][C]-0.167742[/C][C]-1.5097[/C][C]0.067508[/C][/ROW]
[ROW][C]28[/C][C]-0.175819[/C][C]-1.5824[/C][C]0.058731[/C][/ROW]
[ROW][C]29[/C][C]0.01699[/C][C]0.1529[/C][C]0.439425[/C][/ROW]
[ROW][C]30[/C][C]0.060242[/C][C]0.5422[/C][C]0.294592[/C][/ROW]
[ROW][C]31[/C][C]-0.016774[/C][C]-0.151[/C][C]0.440188[/C][/ROW]
[ROW][C]32[/C][C]-0.161068[/C][C]-1.4496[/C][C]0.075513[/C][/ROW]
[ROW][C]33[/C][C]-0.178867[/C][C]-1.6098[/C][C]0.055666[/C][/ROW]
[ROW][C]34[/C][C]-0.241881[/C][C]-2.1769[/C][C]0.016198[/C][/ROW]
[ROW][C]35[/C][C]-0.071856[/C][C]-0.6467[/C][C]0.259826[/C][/ROW]
[ROW][C]36[/C][C]0.272592[/C][C]2.4533[/C][C]0.00815[/C][/ROW]
[/TABLE]
Source: https://freestatistics.org/blog/index.php?pk=69358&T=1

Globally Unique Identifier (entire table): ba.freestatistics.org/blog/index.php?pk=69358&T=1

As an alternative you can also use a QR Code:  

The GUIDs for individual cells are displayed in the table below:

Autocorrelation Function
Time lag kACF(k)T-STATP-value
10.2244082.01970.023362
2-0.053888-0.4850.314497
30.138971.25070.107318
40.0394250.35480.361821
50.2907342.61660.005296
60.3993283.5940.000279
70.1849021.66410.049977
8-0.019677-0.17710.429939
9-0.047543-0.42790.334935
10-0.253637-2.28270.012534
110.0411630.37050.356
120.5581695.02351e-06
13-0.03746-0.33710.368441
14-0.233379-2.10040.019402
15-0.122952-1.10660.135878
16-0.162919-1.46630.073223
170.0865860.77930.219045
180.134841.21360.114222
190.0365740.32920.371439
20-0.112873-1.01590.156362
21-0.155368-1.39830.082918
22-0.290649-2.61580.005307
23-0.01315-0.11840.453041
240.3790073.41110.000506
25-0.07307-0.65760.256319
26-0.244673-2.20210.015252
27-0.167742-1.50970.067508
28-0.175819-1.58240.058731
290.016990.15290.439425
300.0602420.54220.294592
31-0.016774-0.1510.440188
32-0.161068-1.44960.075513
33-0.178867-1.60980.055666
34-0.241881-2.17690.016198
35-0.071856-0.64670.259826
360.2725922.45330.00815


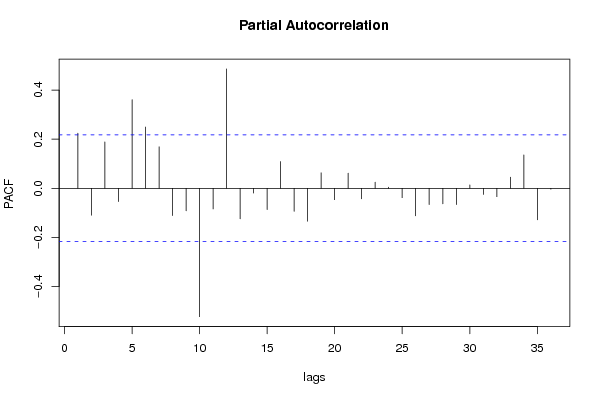
Partial Autocorrelation Function
Time lag kPACF(k)T-STATP-value
10.2244082.01970.023362
2-0.109775-0.9880.163054
30.1886861.69820.046657
4-0.053994-0.48590.31416
50.3610553.24950.000842
60.2495222.24570.013724
70.1690351.52130.066038
8-0.110936-0.99840.160523
9-0.091568-0.82410.206149
10-0.522988-4.70695e-06
11-0.084203-0.75780.225378
120.4862594.37631.8e-05
13-0.124532-1.12080.132845
14-0.01924-0.17320.431479
15-0.086551-0.7790.219137
160.1090840.98180.164571
17-0.093573-0.84220.201089
18-0.133853-1.20470.115918
190.0631970.56880.285543
20-0.0464-0.41760.338671
210.0616520.55490.290256
22-0.042992-0.38690.349913
230.0247980.22320.411977
240.0046970.04230.483192
25-0.038535-0.34680.364815
26-0.111992-1.00790.158246
27-0.066524-0.59870.275517
28-0.063449-0.5710.284778
29-0.066535-0.59880.275482
300.0138450.12460.450572
31-0.025233-0.22710.41046
32-0.034186-0.30770.379561
330.0450410.40540.343136
340.1357531.22180.112668
35-0.128239-1.15410.125917
36-0.00358-0.03220.487187

\begin{tabular}{lllllllll}
\hline
Partial Autocorrelation Function \tabularnewline
Time lag k & PACF(k) & T-STAT & P-value \tabularnewline
1 & 0.224408 & 2.0197 & 0.023362 \tabularnewline
2 & -0.109775 & -0.988 & 0.163054 \tabularnewline
3 & 0.188686 & 1.6982 & 0.046657 \tabularnewline
4 & -0.053994 & -0.4859 & 0.31416 \tabularnewline
5 & 0.361055 & 3.2495 & 0.000842 \tabularnewline
6 & 0.249522 & 2.2457 & 0.013724 \tabularnewline
7 & 0.169035 & 1.5213 & 0.066038 \tabularnewline
8 & -0.110936 & -0.9984 & 0.160523 \tabularnewline
9 & -0.091568 & -0.8241 & 0.206149 \tabularnewline
10 & -0.522988 & -4.7069 & 5e-06 \tabularnewline
11 & -0.084203 & -0.7578 & 0.225378 \tabularnewline
12 & 0.486259 & 4.3763 & 1.8e-05 \tabularnewline
13 & -0.124532 & -1.1208 & 0.132845 \tabularnewline
14 & -0.01924 & -0.1732 & 0.431479 \tabularnewline
15 & -0.086551 & -0.779 & 0.219137 \tabularnewline
16 & 0.109084 & 0.9818 & 0.164571 \tabularnewline
17 & -0.093573 & -0.8422 & 0.201089 \tabularnewline
18 & -0.133853 & -1.2047 & 0.115918 \tabularnewline
19 & 0.063197 & 0.5688 & 0.285543 \tabularnewline
20 & -0.0464 & -0.4176 & 0.338671 \tabularnewline
21 & 0.061652 & 0.5549 & 0.290256 \tabularnewline
22 & -0.042992 & -0.3869 & 0.349913 \tabularnewline
23 & 0.024798 & 0.2232 & 0.411977 \tabularnewline
24 & 0.004697 & 0.0423 & 0.483192 \tabularnewline
25 & -0.038535 & -0.3468 & 0.364815 \tabularnewline
26 & -0.111992 & -1.0079 & 0.158246 \tabularnewline
27 & -0.066524 & -0.5987 & 0.275517 \tabularnewline
28 & -0.063449 & -0.571 & 0.284778 \tabularnewline
29 & -0.066535 & -0.5988 & 0.275482 \tabularnewline
30 & 0.013845 & 0.1246 & 0.450572 \tabularnewline
31 & -0.025233 & -0.2271 & 0.41046 \tabularnewline
32 & -0.034186 & -0.3077 & 0.379561 \tabularnewline
33 & 0.045041 & 0.4054 & 0.343136 \tabularnewline
34 & 0.135753 & 1.2218 & 0.112668 \tabularnewline
35 & -0.128239 & -1.1541 & 0.125917 \tabularnewline
36 & -0.00358 & -0.0322 & 0.487187 \tabularnewline
\hline
\end{tabular}
%Source: https://freestatistics.org/blog/index.php?pk=69358&T=2

[TABLE]
[ROW][C]Partial Autocorrelation Function[/C][/ROW]
[ROW][C]Time lag k[/C][C]PACF(k)[/C][C]T-STAT[/C][C]P-value[/C][/ROW]
[ROW][C]1[/C][C]0.224408[/C][C]2.0197[/C][C]0.023362[/C][/ROW]
[ROW][C]2[/C][C]-0.109775[/C][C]-0.988[/C][C]0.163054[/C][/ROW]
[ROW][C]3[/C][C]0.188686[/C][C]1.6982[/C][C]0.046657[/C][/ROW]
[ROW][C]4[/C][C]-0.053994[/C][C]-0.4859[/C][C]0.31416[/C][/ROW]
[ROW][C]5[/C][C]0.361055[/C][C]3.2495[/C][C]0.000842[/C][/ROW]
[ROW][C]6[/C][C]0.249522[/C][C]2.2457[/C][C]0.013724[/C][/ROW]
[ROW][C]7[/C][C]0.169035[/C][C]1.5213[/C][C]0.066038[/C][/ROW]
[ROW][C]8[/C][C]-0.110936[/C][C]-0.9984[/C][C]0.160523[/C][/ROW]
[ROW][C]9[/C][C]-0.091568[/C][C]-0.8241[/C][C]0.206149[/C][/ROW]
[ROW][C]10[/C][C]-0.522988[/C][C]-4.7069[/C][C]5e-06[/C][/ROW]
[ROW][C]11[/C][C]-0.084203[/C][C]-0.7578[/C][C]0.225378[/C][/ROW]
[ROW][C]12[/C][C]0.486259[/C][C]4.3763[/C][C]1.8e-05[/C][/ROW]
[ROW][C]13[/C][C]-0.124532[/C][C]-1.1208[/C][C]0.132845[/C][/ROW]
[ROW][C]14[/C][C]-0.01924[/C][C]-0.1732[/C][C]0.431479[/C][/ROW]
[ROW][C]15[/C][C]-0.086551[/C][C]-0.779[/C][C]0.219137[/C][/ROW]
[ROW][C]16[/C][C]0.109084[/C][C]0.9818[/C][C]0.164571[/C][/ROW]
[ROW][C]17[/C][C]-0.093573[/C][C]-0.8422[/C][C]0.201089[/C][/ROW]
[ROW][C]18[/C][C]-0.133853[/C][C]-1.2047[/C][C]0.115918[/C][/ROW]
[ROW][C]19[/C][C]0.063197[/C][C]0.5688[/C][C]0.285543[/C][/ROW]
[ROW][C]20[/C][C]-0.0464[/C][C]-0.4176[/C][C]0.338671[/C][/ROW]
[ROW][C]21[/C][C]0.061652[/C][C]0.5549[/C][C]0.290256[/C][/ROW]
[ROW][C]22[/C][C]-0.042992[/C][C]-0.3869[/C][C]0.349913[/C][/ROW]
[ROW][C]23[/C][C]0.024798[/C][C]0.2232[/C][C]0.411977[/C][/ROW]
[ROW][C]24[/C][C]0.004697[/C][C]0.0423[/C][C]0.483192[/C][/ROW]
[ROW][C]25[/C][C]-0.038535[/C][C]-0.3468[/C][C]0.364815[/C][/ROW]
[ROW][C]26[/C][C]-0.111992[/C][C]-1.0079[/C][C]0.158246[/C][/ROW]
[ROW][C]27[/C][C]-0.066524[/C][C]-0.5987[/C][C]0.275517[/C][/ROW]
[ROW][C]28[/C][C]-0.063449[/C][C]-0.571[/C][C]0.284778[/C][/ROW]
[ROW][C]29[/C][C]-0.066535[/C][C]-0.5988[/C][C]0.275482[/C][/ROW]
[ROW][C]30[/C][C]0.013845[/C][C]0.1246[/C][C]0.450572[/C][/ROW]
[ROW][C]31[/C][C]-0.025233[/C][C]-0.2271[/C][C]0.41046[/C][/ROW]
[ROW][C]32[/C][C]-0.034186[/C][C]-0.3077[/C][C]0.379561[/C][/ROW]
[ROW][C]33[/C][C]0.045041[/C][C]0.4054[/C][C]0.343136[/C][/ROW]
[ROW][C]34[/C][C]0.135753[/C][C]1.2218[/C][C]0.112668[/C][/ROW]
[ROW][C]35[/C][C]-0.128239[/C][C]-1.1541[/C][C]0.125917[/C][/ROW]
[ROW][C]36[/C][C]-0.00358[/C][C]-0.0322[/C][C]0.487187[/C][/ROW]
[/TABLE]
Source: https://freestatistics.org/blog/index.php?pk=69358&T=2

Globally Unique Identifier (entire table): ba.freestatistics.org/blog/index.php?pk=69358&T=2

As an alternative you can also use a QR Code:  

The GUIDs for individual cells are displayed in the table below:

Partial Autocorrelation Function
Time lag kPACF(k)T-STATP-value
10.2244082.01970.023362
2-0.109775-0.9880.163054
30.1886861.69820.046657
4-0.053994-0.48590.31416
50.3610553.24950.000842
60.2495222.24570.013724
70.1690351.52130.066038
8-0.110936-0.99840.160523
9-0.091568-0.82410.206149
10-0.522988-4.70695e-06
11-0.084203-0.75780.225378
120.4862594.37631.8e-05
13-0.124532-1.12080.132845
14-0.01924-0.17320.431479
15-0.086551-0.7790.219137
160.1090840.98180.164571
17-0.093573-0.84220.201089
18-0.133853-1.20470.115918
190.0631970.56880.285543
20-0.0464-0.41760.338671
210.0616520.55490.290256
22-0.042992-0.38690.349913
230.0247980.22320.411977
240.0046970.04230.483192
25-0.038535-0.34680.364815
26-0.111992-1.00790.158246
27-0.066524-0.59870.275517
28-0.063449-0.5710.284778
29-0.066535-0.59880.275482
300.0138450.12460.450572
31-0.025233-0.22710.41046
32-0.034186-0.30770.379561
330.0450410.40540.343136
340.1357531.22180.112668
35-0.128239-1.15410.125917
36-0.00358-0.03220.487187


Parameters (Session):
par1 = 36 ; par2 = 1 ; par3 = 0 ; par4 = 0 ; par5 = 12 ; par6 = MA ; par7 = 0.95 ;
Parameters (R input):
par1 = 36 ; par2 = 1 ; par3 = 0 ; par4 = 0 ; par5 = 12 ; par6 = MA ; par7 = 0.95 ;
R code (references can be found in the software module):
if (par1 == 'Default') {
par1 = 10*log10(length(x))
} else {
par1 <- as.numeric(par1)
}
par2 <- as.numeric(par2)
par3 <- as.numeric(par3)
par4 <- as.numeric(par4)
par5 <- as.numeric(par5)
if (par6 == 'White Noise') par6 <- 'white' else par6 <- 'ma'
par7 <- as.numeric(par7)
if (par2 == 0) {
x <- log(x)
} else {
x <- (x ^ par2 - 1) / par2
}
if (par3 > 0) x <- diff(x,lag=1,difference=par3)
if (par4 > 0) x <- diff(x,lag=par5,difference=par4)
bitmap(file='pic1.png')
racf <- acf(x, par1, main='Autocorrelation', xlab='time lag', ylab='ACF', ci.type=par6, ci=par7, sub=paste('(lambda=',par2,', d=',par3,', D=',par4,', CI=', par7, ', CI type=',par6,')',sep=''))
dev.off()
bitmap(file='pic2.png')
rpacf <- pacf(x,par1,main='Partial Autocorrelation',xlab='lags',ylab='PACF')
dev.off()
(myacf <- c(racf$acf))
(mypacf <- c(rpacf$acf))
lengthx <- length(x)
sqrtn <- sqrt(lengthx)
load(file='createtable')
a<-table.start()
a<-table.row.start(a)
a<-table.element(a,'Autocorrelation Function',4,TRUE)
a<-table.row.end(a)
a<-table.row.start(a)
a<-table.element(a,'Time lag k',header=TRUE)
a<-table.element(a,hyperlink('basics.htm','ACF(k)','click here for more information about the Autocorrelation Function'),header=TRUE)
a<-table.element(a,'T-STAT',header=TRUE)
a<-table.element(a,'P-value',header=TRUE)
a<-table.row.end(a)
for (i in 2:(par1+1)) {
a<-table.row.start(a)
a<-table.element(a,i-1,header=TRUE)
a<-table.element(a,round(myacf[i],6))
mytstat <- myacf[i]*sqrtn
a<-table.element(a,round(mytstat,4))
a<-table.element(a,round(1-pt(abs(mytstat),lengthx),6))
a<-table.row.end(a)
}
a<-table.end(a)
table.save(a,file='mytable.tab')
a<-table.start()
a<-table.row.start(a)
a<-table.element(a,'Partial Autocorrelation Function',4,TRUE)
a<-table.row.end(a)
a<-table.row.start(a)
a<-table.element(a,'Time lag k',header=TRUE)
a<-table.element(a,hyperlink('basics.htm','PACF(k)','click here for more information about the Partial Autocorrelation Function'),header=TRUE)
a<-table.element(a,'T-STAT',header=TRUE)
a<-table.element(a,'P-value',header=TRUE)
a<-table.row.end(a)
for (i in 1:par1) {
a<-table.row.start(a)
a<-table.element(a,i,header=TRUE)
a<-table.element(a,round(mypacf[i],6))
mytstat <- mypacf[i]*sqrtn
a<-table.element(a,round(mytstat,4))
a<-table.element(a,round(1-pt(abs(mytstat),lengthx),6))
a<-table.row.end(a)
}
a<-table.end(a)
table.save(a,file='mytable1.tab')