Free Statistics
of Irreproducible Research!
Description of Statistical Computation | |||||||||||||||||||||
|---|---|---|---|---|---|---|---|---|---|---|---|---|---|---|---|---|---|---|---|---|---|
| Author's title | |||||||||||||||||||||
| Author | *The author of this computation has been verified* | ||||||||||||||||||||
| R Software Module | rwasp_backtobackhist.wasp | ||||||||||||||||||||
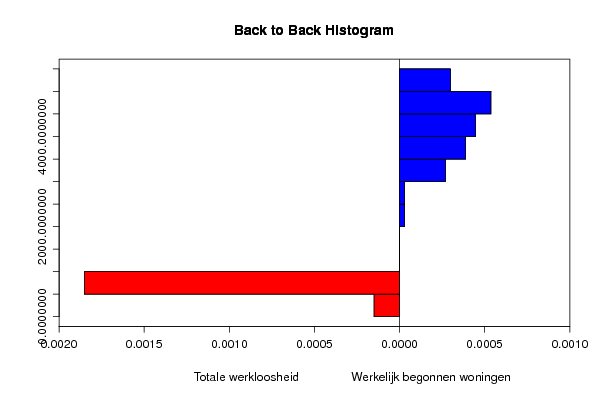
| Title produced by software | Back to Back Histogram | ||||||||||||||||||||
| Date of computation | Fri, 18 Dec 2009 07:08:56 -0700 | ||||||||||||||||||||
| Cite this page as follows | Statistical Computations at FreeStatistics.org, Office for Research Development and Education, URL https://freestatistics.org/blog/index.php?v=date/2009/Dec/18/t126114537241s159z6ogodeh2.htm/, Retrieved Sat, 27 Apr 2024 16:51:05 +0000 | ||||||||||||||||||||
| Statistical Computations at FreeStatistics.org, Office for Research Development and Education, URL https://freestatistics.org/blog/index.php?pk=69352, Retrieved Sat, 27 Apr 2024 16:51:05 +0000 | |||||||||||||||||||||
| QR Codes: | |||||||||||||||||||||
|
| |||||||||||||||||||||
| Original text written by user: | |||||||||||||||||||||
| IsPrivate? | No (this computation is public) | ||||||||||||||||||||
| User-defined keywords | |||||||||||||||||||||
| Estimated Impact | 111 | ||||||||||||||||||||
Tree of Dependent Computations | |||||||||||||||||||||
| Family? (F = Feedback message, R = changed R code, M = changed R Module, P = changed Parameters, D = changed Data) | |||||||||||||||||||||
| - [Back to Back Histogram] [3/11/2009] [2009-11-02 21:58:53] [b98453cac15ba1066b407e146608df68] - R PD [Back to Back Histogram] [] [2009-11-13 16:47:05] [eba9b8a72d680086d9ebbb043233c887] - PD [Back to Back Histogram] [Back to Back hist...] [2009-12-18 14:08:56] [c5f9f441970441f2f938cd843072158d] [Current] | |||||||||||||||||||||
| Feedback Forum | |||||||||||||||||||||
Post a new message | |||||||||||||||||||||
Dataset | |||||||||||||||||||||
| Dataseries X: | |||||||||||||||||||||
562 561 555 544 537 543 594 611 613 611 594 595 591 589 584 573 567 569 621 629 628 612 595 597 593 590 580 574 573 573 620 626 620 588 566 557 561 549 532 526 511 499 555 565 542 527 510 514 517 508 493 490 469 478 528 534 518 506 502 516 528 533 536 537 524 536 587 | |||||||||||||||||||||
| Dataseries Y: | |||||||||||||||||||||
3397 3971 4625 4486 4132 4685 3172 4280 4207 4158 3933 3151 3616 4221 4436 4807 4849 5024 3521 4650 5393 5147 4845 3995 4493 4680 5463 4761 5307 5069 3501 4952 5152 5317 5189 4030 4420 4571 4551 4819 5133 4532 3339 4380 4632 4719 4212 3615 3420 4571 4407 4386 4386 4744 3185 3890 4520 3990 3809 3236 3551 3264 3579 3537 3038 2888 2198 | |||||||||||||||||||||
Tables (Output of Computation) | |||||||||||||||||||||
| |||||||||||||||||||||
Figures (Output of Computation) | |||||||||||||||||||||
Input Parameters & R Code | |||||||||||||||||||||
| Parameters (Session): | |||||||||||||||||||||
| par1 = red ; par2 = blue ; par3 = TRUE ; par4 = Totale werkloosheid ; par5 = Werkelijk begonnen woningen ; | |||||||||||||||||||||
| Parameters (R input): | |||||||||||||||||||||
| par1 = red ; par2 = blue ; par3 = TRUE ; par4 = Totale werkloosheid ; par5 = Werkelijk begonnen woningen ; | |||||||||||||||||||||
| R code (references can be found in the software module): | |||||||||||||||||||||
if (par3 == 'TRUE') par3 <- TRUE | |||||||||||||||||||||