| Multiple Linear Regression - Estimated Regression Equation |
| wrkl[t] = + 96.0103100392773 -0.162234536415654ind[t] -0.0647807862517575gron[t] + 0.177593971047212`bouw `[t] + e[t] |
| Multiple Linear Regression - Ordinary Least Squares | |||||
| Variable | Parameter | S.D. | T-STAT H0: parameter = 0 | 2-tail p-value | 1-tail p-value |
| (Intercept) | 96.0103100392773 | 7.729542 | 12.4212 | 0 | 0 |
| ind | -0.162234536415654 | 0.073695 | -2.2014 | 0.031843 | 0.015922 |
| gron | -0.0647807862517575 | 0.010285 | -6.2986 | 0 | 0 |
| `bouw ` | 0.177593971047212 | 0.044526 | 3.9885 | 0.000195 | 9.7e-05 |
| Multiple Linear Regression - Regression Statistics | |
| Multiple R | 0.745775531648637 |
| R-squared | 0.556181143605807 |
| Adjusted R-squared | 0.532405133441833 |
| F-TEST (value) | 23.3925347343825 |
| F-TEST (DF numerator) | 3 |
| F-TEST (DF denominator) | 56 |
| p-value | 6.053550993812e-10 |
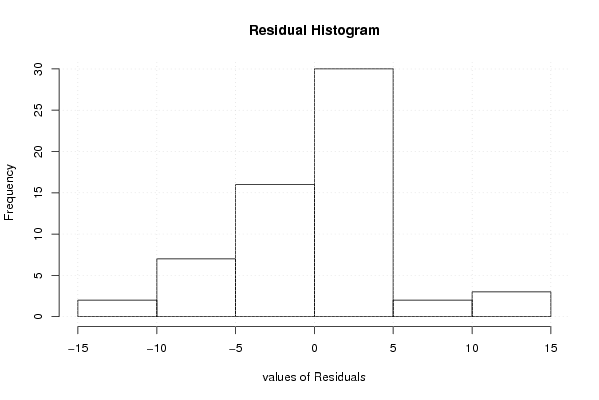
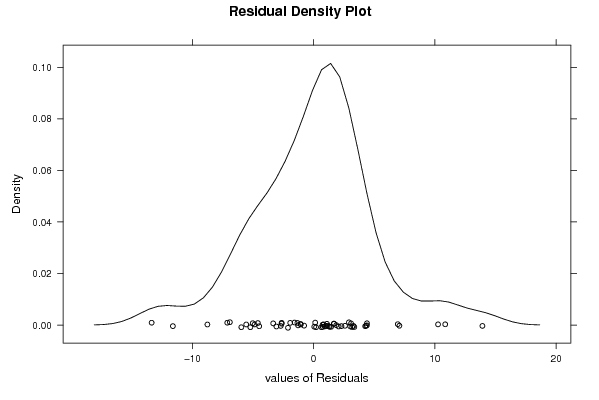
| Multiple Linear Regression - Residual Statistics | |
| Residual Standard Deviation | 5.03255307031101 |
| Sum Squared Residuals | 1418.28906270782 |
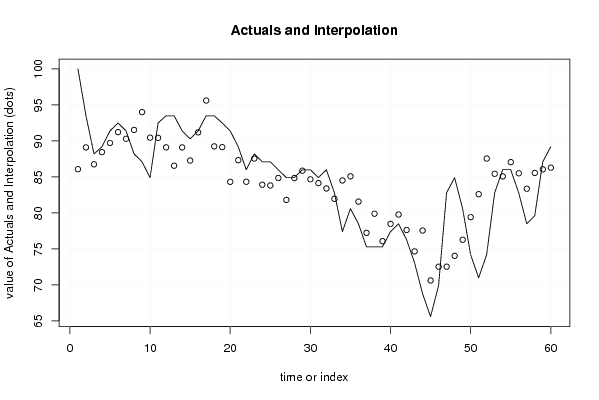
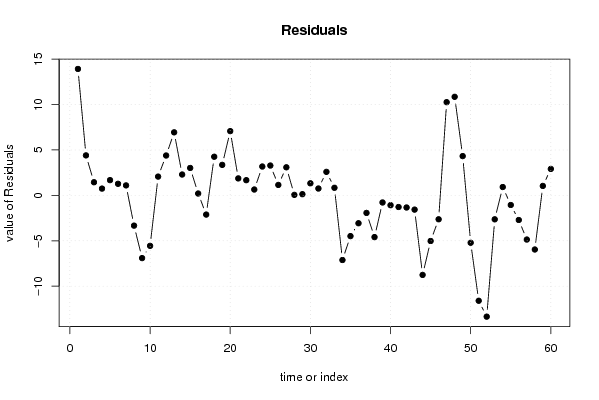
| Multiple Linear Regression - Actuals, Interpolation, and Residuals | |||
| Time or Index | Actuals | Interpolation Forecast | Residuals Prediction Error |
| 1 | 100 | 86.0793091270984 | 13.9206908729016 |
| 2 | 93.5 | 89.0990378509726 | 4.40096214902736 |
| 3 | 88.2 | 86.7566707284042 | 1.44332927159580 |
| 4 | 89.2 | 88.4551609628246 | 0.74483903717537 |
| 5 | 91.4 | 89.7210586502828 | 1.67894134971723 |
| 6 | 92.5 | 91.2288017651846 | 1.27119823481537 |
| 7 | 91.4 | 90.3030134577263 | 1.09698654227373 |
| 8 | 88.2 | 91.5332941640488 | -3.33329416404876 |
| 9 | 87.1 | 94.0070507823163 | -6.9070507823163 |
| 10 | 84.9 | 90.4595197088383 | -5.55951970883833 |
| 11 | 92.5 | 90.4344053830758 | 2.06559461692425 |
| 12 | 93.5 | 89.11109502539 | 4.38890497461003 |
| 13 | 93.5 | 86.5594906693332 | 6.94050933066683 |
| 14 | 91.4 | 89.1048936564994 | 2.29510634350061 |
| 15 | 90.3 | 87.2812237398291 | 3.0187762601709 |
| 16 | 91.4 | 91.1987080179551 | 0.201291982044904 |
| 17 | 93.5 | 95.6152675673356 | -2.11526756733562 |
| 18 | 93.5 | 89.246984639113 | 4.25301536088704 |
| 19 | 92.5 | 89.1426899759213 | 3.35731002407865 |
| 20 | 91.4 | 84.3263345130278 | 7.07366548697224 |
| 21 | 89.2 | 87.333950780604 | 1.86604921939604 |
| 22 | 86 | 84.3296250137753 | 1.67037498622471 |
| 23 | 88.2 | 87.5565655209434 | 0.643434479056639 |
| 24 | 87.1 | 83.923865046592 | 3.17613495340806 |
| 25 | 87.1 | 83.8172013010777 | 3.28279869892229 |
| 26 | 86 | 84.8506688315016 | 1.14933116849838 |
| 27 | 84.9 | 81.8113536003187 | 3.08864639968126 |
| 28 | 84.9 | 84.8453351086454 | 0.0546648913546286 |
| 29 | 86 | 85.870774276468 | 0.129225723531912 |
| 30 | 86 | 84.6744083802544 | 1.32559161974563 |
| 31 | 84.9 | 84.1453771761973 | 0.754622823802738 |
| 32 | 86 | 83.4100718858839 | 2.58992811411611 |
| 33 | 82.8 | 81.9657578811375 | 0.83424211886251 |
| 34 | 77.4 | 84.520260721638 | -7.12026072163807 |
| 35 | 80.6 | 85.0876283326882 | -4.48762833268822 |
| 36 | 78.5 | 81.5720209306762 | -3.07202093067625 |
| 37 | 75.3 | 77.2323196157953 | -1.9323196157953 |
| 38 | 75.3 | 79.8966364584803 | -4.59663645848029 |
| 39 | 75.3 | 76.08272295212 | -0.782722952120023 |
| 40 | 77.4 | 78.4834808731213 | -1.08348087312133 |
| 41 | 78.5 | 79.7819941973426 | -1.28199419734264 |
| 42 | 76.3 | 77.6361304990262 | -1.33613049902621 |
| 43 | 73.1 | 74.6699571397127 | -1.56995713971273 |
| 44 | 68.8 | 77.5608951712273 | -8.76089517122728 |
| 45 | 65.6 | 70.6243430307119 | -5.02434303071192 |
| 46 | 69.9 | 72.5370524475818 | -2.63705244758181 |
| 47 | 82.8 | 72.538459869071 | 10.2615401309290 |
| 48 | 84.9 | 74.0471904419943 | 10.8528095580057 |
| 49 | 80.6 | 76.2764998198231 | 4.32350018017688 |
| 50 | 74.2 | 79.4196134636177 | -5.21961346361768 |
| 51 | 71 | 82.6065544844886 | -11.6065544844886 |
| 52 | 74.2 | 87.5571980882456 | -13.3571980882456 |
| 53 | 82.8 | 85.4376051430436 | -2.63760514304364 |
| 54 | 86 | 85.0834703839902 | 0.916529616009756 |
| 55 | 86 | 87.0581732371102 | -1.05817323711021 |
| 56 | 82.8 | 85.5116047884892 | -2.71160478848916 |
| 57 | 78.5 | 83.3666372216097 | -4.86663722160976 |
| 58 | 79.6 | 85.5627008972895 | -5.9627008972895 |
| 59 | 87.1 | 86.0616186976552 | 1.03838130234475 |
| 60 | 89.2 | 86.2882659048737 | 2.91173409512627 |
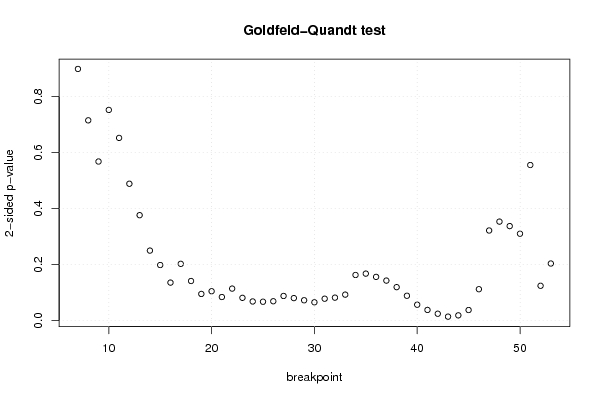
| Goldfeld-Quandt test for Heteroskedasticity | |||
| p-values | Alternative Hypothesis | ||
| breakpoint index | greater | 2-sided | less |
| 7 | 0.449112540219449 | 0.898225080438897 | 0.550887459780551 |
| 8 | 0.357411145909158 | 0.714822291818317 | 0.642588854090842 |
| 9 | 0.283862505123179 | 0.567725010246359 | 0.71613749487682 |
| 10 | 0.37594878638314 | 0.75189757276628 | 0.62405121361686 |
| 11 | 0.326009001342933 | 0.652018002685865 | 0.673990998657067 |
| 12 | 0.24420540764916 | 0.48841081529832 | 0.75579459235084 |
| 13 | 0.188107270302170 | 0.376214540604341 | 0.81189272969783 |
| 14 | 0.124882793771879 | 0.249765587543758 | 0.875117206228121 |
| 15 | 0.0991373149707507 | 0.198274629941501 | 0.90086268502925 |
| 16 | 0.0677769021788928 | 0.135553804357786 | 0.932223097821107 |
| 17 | 0.101251353821326 | 0.202502707642651 | 0.898748646178674 |
| 18 | 0.0706191437274763 | 0.141238287454953 | 0.929380856272524 |
| 19 | 0.0475263148134027 | 0.0950526296268055 | 0.952473685186597 |
| 20 | 0.0523601402659306 | 0.104720280531861 | 0.94763985973407 |
| 21 | 0.0420322153038795 | 0.084064430607759 | 0.95796778469612 |
| 22 | 0.0570575529762149 | 0.114115105952430 | 0.942942447023785 |
| 23 | 0.0405615916916785 | 0.081123183383357 | 0.959438408308321 |
| 24 | 0.0341012702964229 | 0.0682025405928458 | 0.965898729703577 |
| 25 | 0.0336330205378608 | 0.0672660410757215 | 0.96636697946214 |
| 26 | 0.0344841394569458 | 0.0689682789138916 | 0.965515860543054 |
| 27 | 0.0439298458546819 | 0.0878596917093638 | 0.956070154145318 |
| 28 | 0.0400963669283592 | 0.0801927338567185 | 0.95990363307164 |
| 29 | 0.0362423480817673 | 0.0724846961635346 | 0.963757651918233 |
| 30 | 0.0326166889399510 | 0.0652333778799021 | 0.967383311060049 |
| 31 | 0.039022847022414 | 0.078045694044828 | 0.960977152977586 |
| 32 | 0.0409112774804884 | 0.0818225549609767 | 0.959088722519512 |
| 33 | 0.0462929800524028 | 0.0925859601048056 | 0.953707019947597 |
| 34 | 0.0813915679874818 | 0.162783135974964 | 0.918608432012518 |
| 35 | 0.0837768983237418 | 0.167553796647484 | 0.916223101676258 |
| 36 | 0.0779641627413424 | 0.155928325482685 | 0.922035837258658 |
| 37 | 0.0713371834632371 | 0.142674366926474 | 0.928662816536763 |
| 38 | 0.0596587795088786 | 0.119317559017757 | 0.940341220491121 |
| 39 | 0.0442727123844478 | 0.0885454247688956 | 0.955727287615552 |
| 40 | 0.0282920593483832 | 0.0565841186967664 | 0.971707940651617 |
| 41 | 0.0189828284923038 | 0.0379656569846076 | 0.981017171507696 |
| 42 | 0.0121929548872422 | 0.0243859097744845 | 0.987807045112758 |
| 43 | 0.00699206356347909 | 0.0139841271269582 | 0.993007936436521 |
| 44 | 0.00932106270464812 | 0.0186421254092962 | 0.990678937295352 |
| 45 | 0.0187793954320762 | 0.0375587908641524 | 0.981220604567924 |
| 46 | 0.0559863752555673 | 0.111972750511135 | 0.944013624744433 |
| 47 | 0.16075596191727 | 0.32151192383454 | 0.83924403808273 |
| 48 | 0.176617806360351 | 0.353235612720702 | 0.823382193639649 |
| 49 | 0.168629844090672 | 0.337259688181344 | 0.831370155909328 |
| 50 | 0.155037427518307 | 0.310074855036615 | 0.844962572481693 |
| 51 | 0.277625994141713 | 0.555251988283426 | 0.722374005858287 |
| 52 | 0.937898604457236 | 0.124202791085529 | 0.0621013955427643 |
| 53 | 0.89816618739287 | 0.203667625214262 | 0.101833812607131 |
| Meta Analysis of Goldfeld-Quandt test for Heteroskedasticity | |||
| Description | # significant tests | % significant tests | OK/NOK |
| 1% type I error level | 0 | 0 | OK |
| 5% type I error level | 5 | 0.106382978723404 | NOK |
| 10% type I error level | 20 | 0.425531914893617 | NOK |