Free Statistics
of Irreproducible Research!
Description of Statistical Computation | |||||||||||||||||||||||||||||||||||||||||||||||||||||||||||||||||||||
|---|---|---|---|---|---|---|---|---|---|---|---|---|---|---|---|---|---|---|---|---|---|---|---|---|---|---|---|---|---|---|---|---|---|---|---|---|---|---|---|---|---|---|---|---|---|---|---|---|---|---|---|---|---|---|---|---|---|---|---|---|---|---|---|---|---|---|---|---|---|
| Author's title | |||||||||||||||||||||||||||||||||||||||||||||||||||||||||||||||||||||
| Author | *The author of this computation has been verified* | ||||||||||||||||||||||||||||||||||||||||||||||||||||||||||||||||||||
| R Software Module | rwasp_pairs.wasp | ||||||||||||||||||||||||||||||||||||||||||||||||||||||||||||||||||||
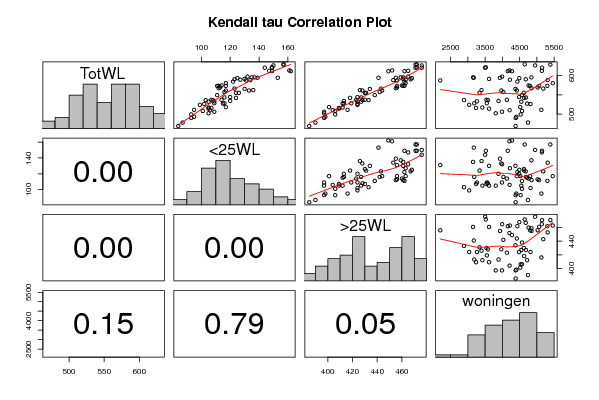
| Title produced by software | Kendall tau Correlation Matrix | ||||||||||||||||||||||||||||||||||||||||||||||||||||||||||||||||||||
| Date of computation | Fri, 18 Dec 2009 05:51:27 -0700 | ||||||||||||||||||||||||||||||||||||||||||||||||||||||||||||||||||||
| Cite this page as follows | Statistical Computations at FreeStatistics.org, Office for Research Development and Education, URL https://freestatistics.org/blog/index.php?v=date/2009/Dec/18/t12611407835zvn69xv91v7g5s.htm/, Retrieved Sat, 27 Apr 2024 15:55:51 +0000 | ||||||||||||||||||||||||||||||||||||||||||||||||||||||||||||||||||||
| Statistical Computations at FreeStatistics.org, Office for Research Development and Education, URL https://freestatistics.org/blog/index.php?pk=69295, Retrieved Sat, 27 Apr 2024 15:55:51 +0000 | |||||||||||||||||||||||||||||||||||||||||||||||||||||||||||||||||||||
| QR Codes: | |||||||||||||||||||||||||||||||||||||||||||||||||||||||||||||||||||||
|
| |||||||||||||||||||||||||||||||||||||||||||||||||||||||||||||||||||||
| Original text written by user: | |||||||||||||||||||||||||||||||||||||||||||||||||||||||||||||||||||||
| IsPrivate? | No (this computation is public) | ||||||||||||||||||||||||||||||||||||||||||||||||||||||||||||||||||||
| User-defined keywords | |||||||||||||||||||||||||||||||||||||||||||||||||||||||||||||||||||||
| Estimated Impact | 125 | ||||||||||||||||||||||||||||||||||||||||||||||||||||||||||||||||||||
Tree of Dependent Computations | |||||||||||||||||||||||||||||||||||||||||||||||||||||||||||||||||||||
| Family? (F = Feedback message, R = changed R code, M = changed R Module, P = changed Parameters, D = changed Data) | |||||||||||||||||||||||||||||||||||||||||||||||||||||||||||||||||||||
| - [Kendall tau Correlation Matrix] [3/11/2009] [2009-11-02 21:25:00] [b98453cac15ba1066b407e146608df68] - R D [Kendall tau Correlation Matrix] [] [2009-11-11 17:20:33] [74be16979710d4c4e7c6647856088456] - D [Kendall tau Correlation Matrix] [Kendall Tau Corre...] [2009-12-18 12:51:27] [c5f9f441970441f2f938cd843072158d] [Current] - R PD [Kendall tau Correlation Matrix] [] [2010-12-21 19:37:17] [84ec9e690346b814992f2f0baa963a63] - RMPD [Multiple Regression] [] [2010-12-21 19:40:07] [84ec9e690346b814992f2f0baa963a63] - RMPD [Multiple Regression] [] [2010-12-21 19:47:11] [84ec9e690346b814992f2f0baa963a63] | |||||||||||||||||||||||||||||||||||||||||||||||||||||||||||||||||||||
| Feedback Forum | |||||||||||||||||||||||||||||||||||||||||||||||||||||||||||||||||||||
Post a new message | |||||||||||||||||||||||||||||||||||||||||||||||||||||||||||||||||||||
Dataset | |||||||||||||||||||||||||||||||||||||||||||||||||||||||||||||||||||||
| Dataseries X: | |||||||||||||||||||||||||||||||||||||||||||||||||||||||||||||||||||||
562 136 426 3397 561 133 428 3971 555 126 430 4625 544 120 424 4486 537 114 423 4132 543 116 427 4685 594 153 441 3172 611 162 449 4280 613 161 452 4207 611 149 462 4158 594 139 455 3933 595 135 461 3151 591 130 461 3616 589 127 463 4221 584 122 462 4436 573 117 456 4807 567 112 455 4849 569 113 456 5024 621 149 472 3521 629 157 472 4650 628 157 471 5393 612 147 465 5147 595 137 459 4845 597 132 465 3995 593 125 468 4493 590 123 467 4680 580 117 463 5463 574 114 460 4761 573 111 462 5307 573 112 461 5069 620 144 476 3501 626 150 476 4952 620 149 471 5152 588 134 453 5317 566 123 443 5189 557 116 442 4030 561 117 444 4420 549 111 438 4571 532 105 427 4551 526 102 424 4819 511 95 416 5133 499 93 406 4532 555 124 431 3339 565 130 434 4380 542 124 418 4632 527 115 412 4719 510 106 404 4212 514 105 409 3615 517 105 412 3420 508 101 406 4571 493 95 398 4407 490 93 397 4386 469 84 385 4386 478 87 390 4744 528 116 413 3185 534 120 413 3890 518 117 401 4520 506 109 397 3990 502 105 397 3809 516 107 409 3236 528 109 419 3551 533 109 424 3264 536 108 428 3579 537 107 430 3537 524 99 424 3038 536 103 433 2888 587 131 456 2198 | |||||||||||||||||||||||||||||||||||||||||||||||||||||||||||||||||||||
Tables (Output of Computation) | |||||||||||||||||||||||||||||||||||||||||||||||||||||||||||||||||||||
| |||||||||||||||||||||||||||||||||||||||||||||||||||||||||||||||||||||
Figures (Output of Computation) | |||||||||||||||||||||||||||||||||||||||||||||||||||||||||||||||||||||
Input Parameters & R Code | |||||||||||||||||||||||||||||||||||||||||||||||||||||||||||||||||||||
| Parameters (Session): | |||||||||||||||||||||||||||||||||||||||||||||||||||||||||||||||||||||
| Parameters (R input): | |||||||||||||||||||||||||||||||||||||||||||||||||||||||||||||||||||||
| R code (references can be found in the software module): | |||||||||||||||||||||||||||||||||||||||||||||||||||||||||||||||||||||
panel.tau <- function(x, y, digits=2, prefix='', cex.cor) | |||||||||||||||||||||||||||||||||||||||||||||||||||||||||||||||||||||