| Multiple Linear Regression - Estimated Regression Equation |
| Y[t] = + 0.881777647983385 -0.0113231086563806X[t] + 1.63806464568807Y1[t] -1.00286926978010Y2[t] + 0.0145595834654874Y3[t] + 0.251295000293058Y4[t] + 0.0625666023511709M1[t] -0.00068203250343602M2[t] + 0.149463960484866M3[t] + 0.0540894234403781M4[t] -0.176549045058484M5[t] -0.06307426185533M6[t] -0.0851874528307616M7[t] -0.113415631987668M8[t] -0.0279778267138532M9[t] + 0.625142574401157M10[t] -0.521386048081949M11[t] -0.00183070169537278t + e[t] |
| Multiple Linear Regression - Ordinary Least Squares | |||||
| Variable | Parameter | S.D. | T-STAT H0: parameter = 0 | 2-tail p-value | 1-tail p-value |
| (Intercept) | 0.881777647983385 | 0.698477 | 1.2624 | 0.212537 | 0.106268 |
| X | -0.0113231086563806 | 0.019941 | -0.5678 | 0.572649 | 0.286325 |
| Y1 | 1.63806464568807 | 0.142074 | 11.5297 | 0 | 0 |
| Y2 | -1.00286926978010 | 0.277449 | -3.6146 | 0.000688 | 0.000344 |
| Y3 | 0.0145595834654874 | 0.27799 | 0.0524 | 0.958435 | 0.479217 |
| Y4 | 0.251295000293058 | 0.144383 | 1.7405 | 0.087807 | 0.043903 |
| M1 | 0.0625666023511709 | 0.214197 | 0.2921 | 0.771396 | 0.385698 |
| M2 | -0.00068203250343602 | 0.165888 | -0.0041 | 0.996736 | 0.498368 |
| M3 | 0.149463960484866 | 0.170434 | 0.877 | 0.384619 | 0.19231 |
| M4 | 0.0540894234403781 | 0.173733 | 0.3113 | 0.756814 | 0.378407 |
| M5 | -0.176549045058484 | 0.152101 | -1.1607 | 0.251153 | 0.125576 |
| M6 | -0.06307426185533 | 0.141031 | -0.4472 | 0.656598 | 0.328299 |
| M7 | -0.0851874528307616 | 0.170104 | -0.5008 | 0.618669 | 0.309335 |
| M8 | -0.113415631987668 | 0.164323 | -0.6902 | 0.493199 | 0.2466 |
| M9 | -0.0279778267138532 | 0.165785 | -0.1688 | 0.866654 | 0.433327 |
| M10 | 0.625142574401157 | 0.165394 | 3.7797 | 0.000413 | 0.000206 |
| M11 | -0.521386048081949 | 0.224014 | -2.3275 | 0.023946 | 0.011973 |
| t | -0.00183070169537278 | 0.002 | -0.9151 | 0.364429 | 0.182215 |
| Multiple Linear Regression - Regression Statistics | |
| Multiple R | 0.977655491510764 |
| R-squared | 0.955810260081153 |
| Adjusted R-squared | 0.94108034677487 |
| F-TEST (value) | 64.8890621558174 |
| F-TEST (DF numerator) | 17 |
| F-TEST (DF denominator) | 51 |
| p-value | 0 |
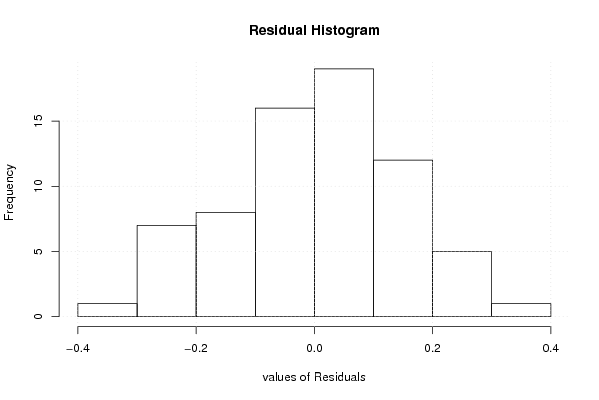
| Multiple Linear Regression - Residual Statistics | |
| Residual Standard Deviation | 0.172370906703546 |
| Sum Squared Residuals | 1.51529820336793 |
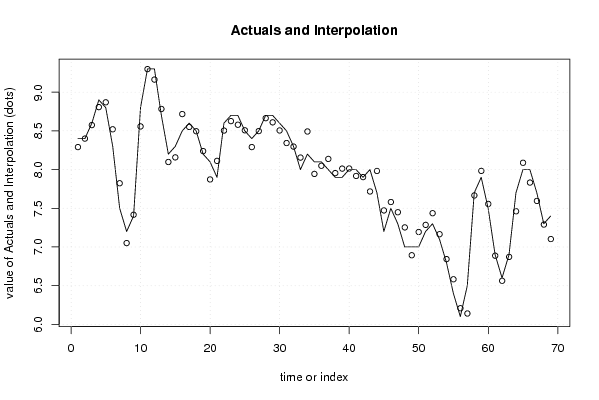
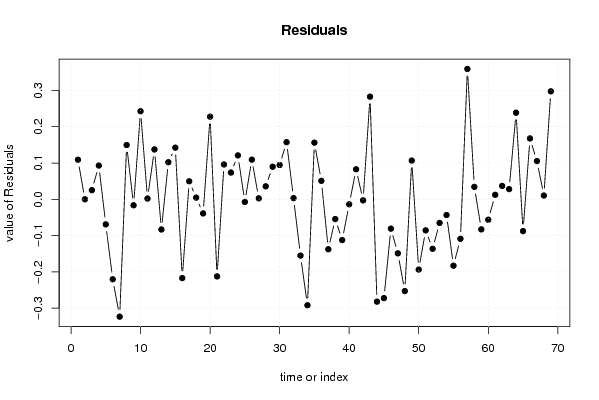
| Multiple Linear Regression - Actuals, Interpolation, and Residuals | |||
| Time or Index | Actuals | Interpolation Forecast | Residuals Prediction Error |
| 1 | 8.4 | 8.29095073957985 | 0.109049260420154 |
| 2 | 8.4 | 8.40006339115775 | -6.33911577450543e-05 |
| 3 | 8.6 | 8.57486695551875 | 0.0251330444812547 |
| 4 | 8.9 | 8.80697311221495 | 0.0930268877850465 |
| 5 | 8.8 | 8.86908610762773 | -0.0690861076277269 |
| 6 | 8.3 | 8.5204468644511 | -0.220446864451098 |
| 7 | 7.5 | 7.82343919517399 | -0.323439195173987 |
| 8 | 7.2 | 7.05048282942977 | 0.149517170570232 |
| 9 | 7.4 | 7.41651975139356 | -0.0165197513935551 |
| 10 | 8.8 | 8.55728952766746 | 0.242710472332539 |
| 11 | 9.3 | 9.29794144452062 | 0.00205855547937821 |
| 12 | 9.3 | 9.16263986765524 | 0.137360132344761 |
| 13 | 8.7 | 8.78318537014649 | -0.083185370146486 |
| 14 | 8.2 | 8.09787020201016 | 0.102129797989835 |
| 15 | 8.3 | 8.15769270289744 | 0.142307297102564 |
| 16 | 8.5 | 8.7171060446237 | -0.217106044623708 |
| 17 | 8.6 | 8.55039592099702 | 0.0496040790029831 |
| 18 | 8.5 | 8.49541951698941 | 0.00458048301058582 |
| 19 | 8.2 | 8.23893381317768 | -0.038933813177676 |
| 20 | 8.1 | 7.87228820116624 | 0.227711798833760 |
| 21 | 7.9 | 8.11254684367637 | -0.212546843676366 |
| 22 | 8.6 | 8.50395592653023 | 0.0960440734697732 |
| 23 | 8.7 | 8.62631094311464 | 0.0736890568853605 |
| 24 | 8.7 | 8.57905669306873 | 0.120943306931270 |
| 25 | 8.5 | 8.50725132008665 | -0.00725132008665006 |
| 26 | 8.4 | 8.2907892020851 | 0.109210797914892 |
| 27 | 8.5 | 8.49737798802452 | 0.00262201197548507 |
| 28 | 8.7 | 8.66429823238903 | 0.0357017676109676 |
| 29 | 8.7 | 8.61027088311334 | 0.0897291168866645 |
| 30 | 8.6 | 8.50548051395524 | 0.0945194860447574 |
| 31 | 8.5 | 8.34271433410081 | 0.157285665899188 |
| 32 | 8.3 | 8.29679060072538 | 0.00320939927462011 |
| 33 | 8 | 8.15523913856771 | -0.155239138567712 |
| 34 | 8.2 | 8.49215507919832 | -0.292155079198317 |
| 35 | 8.1 | 7.94388835510939 | 0.156111644890614 |
| 36 | 8.1 | 8.049078982422 | 0.0509210175780046 |
| 37 | 8 | 8.13773845774755 | -0.137738457747547 |
| 38 | 7.9 | 7.95448522791704 | -0.0544852279170366 |
| 39 | 7.9 | 8.0124530152914 | -0.112453015291406 |
| 40 | 8 | 8.01385228300988 | -0.0138522830098793 |
| 41 | 8 | 7.9173585770564 | 0.0826414229436056 |
| 42 | 7.9 | 7.90302007612404 | -0.00302007612404089 |
| 43 | 8 | 7.71717860157723 | 0.282821398422765 |
| 44 | 7.7 | 7.98200416662927 | -0.282004166629268 |
| 45 | 7.2 | 7.47233576009017 | -0.272335760090167 |
| 46 | 7.5 | 7.58087452722453 | -0.0808745272245331 |
| 47 | 7.3 | 7.44896163379628 | -0.148961633796279 |
| 48 | 7 | 7.25295896591456 | -0.252958965914562 |
| 49 | 7 | 6.89330383239392 | 0.106696167606080 |
| 50 | 7 | 7.19363568411332 | -0.193635684113323 |
| 51 | 7.2 | 7.28562563400954 | -0.0856256340095376 |
| 52 | 7.3 | 7.43645527411651 | -0.136455274116513 |
| 53 | 7.1 | 7.16518055497692 | -0.0651805549769159 |
| 54 | 6.8 | 6.84334436556988 | -0.0433443655698851 |
| 55 | 6.4 | 6.58298743763137 | -0.182987437631372 |
| 56 | 6.1 | 6.20877856759834 | -0.108778567598342 |
| 57 | 6.5 | 6.14080647617688 | 0.359193523823121 |
| 58 | 7.7 | 7.66572493937946 | 0.0342750606205383 |
| 59 | 7.9 | 7.98289762345907 | -0.082897623459073 |
| 60 | 7.5 | 7.55626549093947 | -0.0562654909394732 |
| 61 | 6.9 | 6.88757028004555 | 0.0124297199544479 |
| 62 | 6.6 | 6.56315629271662 | 0.0368437072833785 |
| 63 | 6.9 | 6.87198370425836 | 0.0280162957416406 |
| 64 | 7.7 | 7.46131505364591 | 0.238684946354086 |
| 65 | 8 | 8.08770795622861 | -0.0877079562286104 |
| 66 | 8 | 7.83228866291032 | 0.167711337089681 |
| 67 | 7.7 | 7.59474661833892 | 0.105253381661081 |
| 68 | 7.3 | 7.289655634451 | 0.0103443655489979 |
| 69 | 7.4 | 7.10255203009532 | 0.297447969904679 |
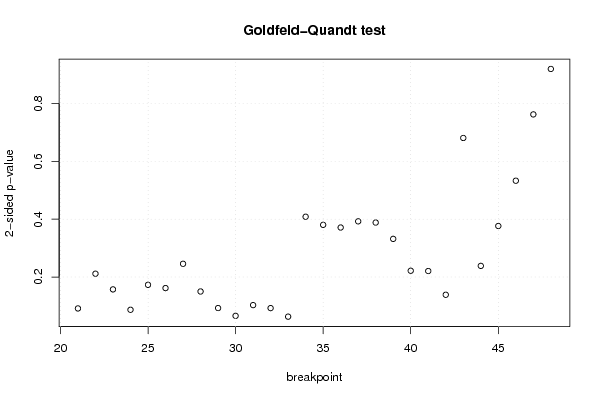
| Goldfeld-Quandt test for Heteroskedasticity | |||
| p-values | Alternative Hypothesis | ||
| breakpoint index | greater | 2-sided | less |
| 21 | 0.04566635979571 | 0.09133271959142 | 0.95433364020429 |
| 22 | 0.105742228334724 | 0.211484456669448 | 0.894257771665276 |
| 23 | 0.0786259251576242 | 0.157251850315248 | 0.921374074842376 |
| 24 | 0.0433719751061164 | 0.0867439502122328 | 0.956628024893884 |
| 25 | 0.0864706209825645 | 0.172941241965129 | 0.913529379017435 |
| 26 | 0.0808870886838879 | 0.161774177367776 | 0.919112911316112 |
| 27 | 0.122869210648916 | 0.245738421297832 | 0.877130789351084 |
| 28 | 0.0750158587633661 | 0.150031717526732 | 0.924984141236634 |
| 29 | 0.0463512142068235 | 0.0927024284136469 | 0.953648785793177 |
| 30 | 0.0328825192601484 | 0.0657650385202967 | 0.967117480739852 |
| 31 | 0.0514249735843737 | 0.102849947168747 | 0.948575026415626 |
| 32 | 0.0462500244185428 | 0.0925000488370856 | 0.953749975581457 |
| 33 | 0.0314691877507664 | 0.0629383755015328 | 0.968530812249234 |
| 34 | 0.204268378089120 | 0.408536756178241 | 0.79573162191088 |
| 35 | 0.190265568576239 | 0.380531137152478 | 0.809734431423761 |
| 36 | 0.185644792195733 | 0.371289584391466 | 0.814355207804267 |
| 37 | 0.196323382145476 | 0.392646764290953 | 0.803676617854524 |
| 38 | 0.194226864948853 | 0.388453729897706 | 0.805773135051147 |
| 39 | 0.166009717660905 | 0.332019435321811 | 0.833990282339095 |
| 40 | 0.110854125432947 | 0.221708250865893 | 0.889145874567053 |
| 41 | 0.110377251582977 | 0.220754503165954 | 0.889622748417023 |
| 42 | 0.0693302693153852 | 0.138660538630770 | 0.930669730684615 |
| 43 | 0.659478798579901 | 0.681042402840198 | 0.340521201420099 |
| 44 | 0.880728325877438 | 0.238543348245124 | 0.119271674122562 |
| 45 | 0.811740295760554 | 0.376519408478892 | 0.188259704239446 |
| 46 | 0.733453582026012 | 0.533092835947975 | 0.266546417973988 |
| 47 | 0.618732210915877 | 0.762535578168246 | 0.381267789084123 |
| 48 | 0.540126973931229 | 0.919746052137542 | 0.459873026068771 |
| Meta Analysis of Goldfeld-Quandt test for Heteroskedasticity | |||
| Description | # significant tests | % significant tests | OK/NOK |
| 1% type I error level | 0 | 0 | OK |
| 5% type I error level | 0 | 0 | OK |
| 10% type I error level | 6 | 0.214285714285714 | NOK |