| Multiple Linear Regression - Estimated Regression Equation |
| Y[t] = + 0.921945386517049 -0.00849630040054335X[t] + 1.65965833303647Y1[t] -1.19540649750345Y2[t] + 0.421573973478152Y3[t] + 0.047571584198437M1[t] + 0.222330619531373M2[t] + 0.159118603106716M3[t] -0.0108053600755996M4[t] + 0.0800811012666492M5[t] + 0.0112746842390065M6[t] -0.0750162781195247M7[t] + 0.0706013534843924M8[t] + 0.631485697774444M9[t] -0.421261926523657M10[t] + 0.186816955697884M11[t] -0.00259888769774793t + e[t] |
| Multiple Linear Regression - Ordinary Least Squares | |||||
| Variable | Parameter | S.D. | T-STAT H0: parameter = 0 | 2-tail p-value | 1-tail p-value |
| (Intercept) | 0.921945386517049 | 0.967281 | 0.9531 | 0.346248 | 0.173124 |
| X | -0.00849630040054335 | 0.023874 | -0.3559 | 0.723799 | 0.361899 |
| Y1 | 1.65965833303647 | 0.145966 | 11.3702 | 0 | 0 |
| Y2 | -1.19540649750345 | 0.228585 | -5.2296 | 6e-06 | 3e-06 |
| Y3 | 0.421573973478152 | 0.164626 | 2.5608 | 0.014322 | 0.007161 |
| M1 | 0.047571584198437 | 0.117264 | 0.4057 | 0.68714 | 0.34357 |
| M2 | 0.222330619531373 | 0.121388 | 1.8316 | 0.074469 | 0.037235 |
| M3 | 0.159118603106716 | 0.128813 | 1.2353 | 0.223936 | 0.111968 |
| M4 | -0.0108053600755996 | 0.127814 | -0.0845 | 0.933049 | 0.466525 |
| M5 | 0.0800811012666492 | 0.122434 | 0.6541 | 0.516806 | 0.258403 |
| M6 | 0.0112746842390065 | 0.116408 | 0.0969 | 0.923325 | 0.461663 |
| M7 | -0.0750162781195247 | 0.116986 | -0.6412 | 0.525024 | 0.262512 |
| M8 | 0.0706013534843924 | 0.118646 | 0.5951 | 0.555155 | 0.277578 |
| M9 | 0.631485697774444 | 0.123247 | 5.1238 | 8e-06 | 4e-06 |
| M10 | -0.421261926523657 | 0.162371 | -2.5944 | 0.013179 | 0.006589 |
| M11 | 0.186816955697884 | 0.148307 | 1.2597 | 0.215091 | 0.107546 |
| t | -0.00259888769774793 | 0.003492 | -0.7442 | 0.461131 | 0.230566 |
| Multiple Linear Regression - Regression Statistics | |
| Multiple R | 0.975285399896968 |
| R-squared | 0.951181611252188 |
| Adjusted R-squared | 0.931654255753063 |
| F-TEST (value) | 48.710211236479 |
| F-TEST (DF numerator) | 16 |
| F-TEST (DF denominator) | 40 |
| p-value | 0 |
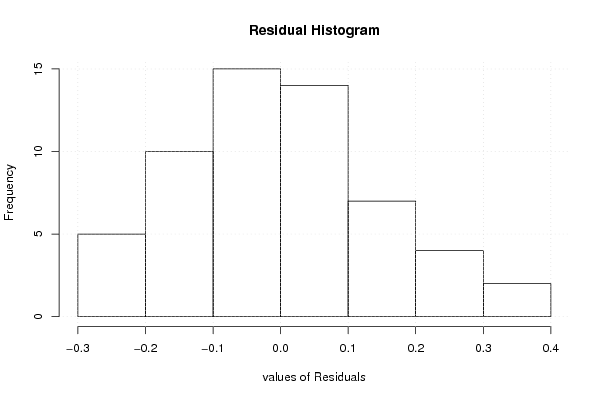
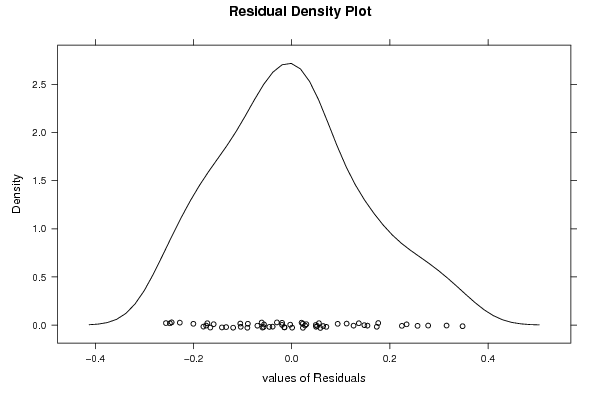
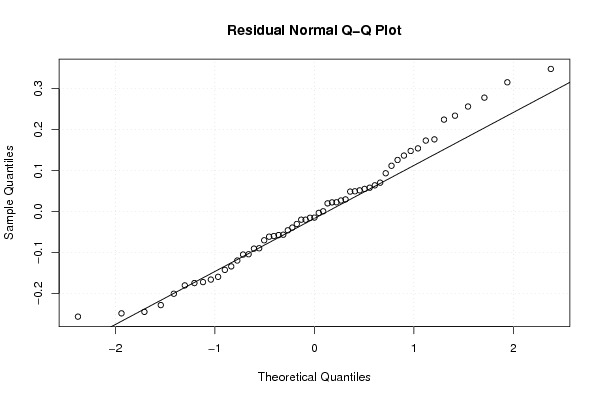
| Multiple Linear Regression - Residual Statistics | |
| Residual Standard Deviation | 0.172917340498500 |
| Sum Squared Residuals | 1.19601626580297 |
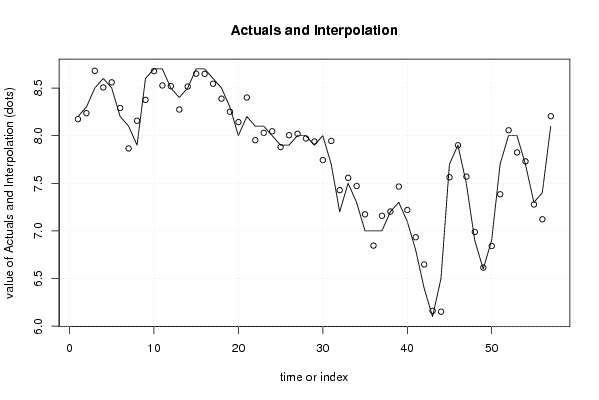
| Multiple Linear Regression - Actuals, Interpolation, and Residuals | |||
| Time or Index | Actuals | Interpolation Forecast | Residuals Prediction Error |
| 1 | 8.2 | 8.17276901527737 | 0.0272309847226265 |
| 2 | 8.3 | 8.23574241505662 | 0.0642575849433793 |
| 3 | 8.5 | 8.67980657886264 | -0.179806578862642 |
| 4 | 8.6 | 8.50633886798029 | 0.0936611320197127 |
| 5 | 8.5 | 8.55942022257529 | -0.059420222575288 |
| 6 | 8.2 | 8.29022174965175 | -0.090221749651755 |
| 7 | 8.1 | 7.86598207682275 | 0.234017923177252 |
| 8 | 7.9 | 8.15610101916827 | -0.256101019168274 |
| 9 | 8.6 | 8.37552326686018 | 0.224476733139815 |
| 10 | 8.7 | 8.67716223006263 | 0.0228377699373725 |
| 11 | 8.7 | 8.52665908490197 | 0.173340915098033 |
| 12 | 8.5 | 8.51960141351113 | -0.0196014135111315 |
| 13 | 8.4 | 8.27395021071229 | 0.126049789287711 |
| 14 | 8.5 | 8.51497767434425 | -0.0149776743442479 |
| 15 | 8.7 | 8.6503584585802 | 0.0496415414197947 |
| 16 | 8.7 | 8.64806922720927 | 0.0519307727907265 |
| 17 | 8.6 | 8.54453067894122 | 0.0554693210587738 |
| 18 | 8.5 | 8.3880758154476 | 0.111924184552398 |
| 19 | 8.3 | 8.25106152175791 | 0.0489384782420882 |
| 20 | 8 | 8.14208074157948 | -0.142080741579482 |
| 21 | 8.2 | 8.40024223045377 | -0.200242230453774 |
| 22 | 8.1 | 7.95198416966068 | 0.148015830339323 |
| 23 | 8.1 | 8.02934335949691 | 0.0706566405030937 |
| 24 | 8 | 8.04548222062736 | -0.045482220627358 |
| 25 | 7.9 | 7.87978279635642 | 0.0202172036435775 |
| 26 | 7.9 | 8.00466813039825 | -0.104668130398255 |
| 27 | 8 | 8.0196389988386 | -0.0196389988385978 |
| 28 | 8 | 7.97007495387431 | 0.0299250461256896 |
| 29 | 7.9 | 7.93882187776847 | -0.0388218777684663 |
| 30 | 8 | 7.74360813708724 | 0.256391862912755 |
| 31 | 7.7 | 7.94447292028523 | -0.244472920285228 |
| 32 | 7.2 | 7.4278961171823 | -0.227896117182298 |
| 33 | 7.5 | 7.55713175385522 | -0.0571317538552187 |
| 34 | 7.3 | 7.47176342851864 | -0.171763428518644 |
| 35 | 7 | 7.17420356036492 | -0.174203560364923 |
| 36 | 7 | 6.84564666828205 | 0.154353331717946 |
| 37 | 7 | 7.15897910905777 | -0.158979109057766 |
| 38 | 7.2 | 7.2029678045694 | -0.00296780456940004 |
| 39 | 7.3 | 7.46569004689407 | -0.165690046894072 |
| 40 | 7.1 | 7.21920209977691 | -0.119202099776910 |
| 41 | 6.8 | 6.93353511143897 | -0.133535111438968 |
| 42 | 6.4 | 6.6480198937713 | -0.248019893771306 |
| 43 | 6.1 | 6.1610775646553 | -0.0610775646553028 |
| 44 | 6.5 | 6.15194180532808 | 0.348058194671915 |
| 45 | 7.7 | 7.5632333249547 | 0.136766675045305 |
| 46 | 7.9 | 7.89909017175805 | 0.00090982824194913 |
| 47 | 7.5 | 7.5697939952362 | -0.0697939952362032 |
| 48 | 6.9 | 6.98926969757946 | -0.0892696975794575 |
| 49 | 6.6 | 6.61451886859615 | -0.0145188685961489 |
| 50 | 6.9 | 6.84164397563148 | 0.0583560243685238 |
| 51 | 7.7 | 7.38450591682448 | 0.315494083175516 |
| 52 | 8 | 8.05631485115922 | -0.0563148511592188 |
| 53 | 8 | 7.82369210927605 | 0.176307890723949 |
| 54 | 7.7 | 7.73007440404209 | -0.0300744040420928 |
| 55 | 7.3 | 7.27740591647881 | 0.0225940835211909 |
| 56 | 7.4 | 7.12198031674186 | 0.278019683258139 |
| 57 | 8.1 | 8.20386942387613 | -0.103869423876128 |
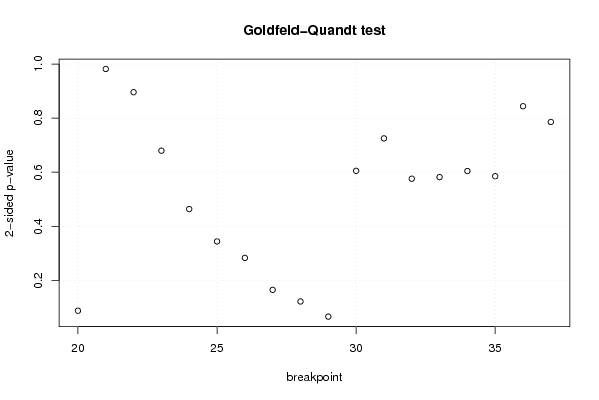
| Goldfeld-Quandt test for Heteroskedasticity | |||
| p-values | Alternative Hypothesis | ||
| breakpoint index | greater | 2-sided | less |
| 20 | 0.0439029626438176 | 0.0878059252876352 | 0.956097037356182 |
| 21 | 0.490924797083979 | 0.981849594167958 | 0.509075202916021 |
| 22 | 0.447949416905584 | 0.895898833811169 | 0.552050583094416 |
| 23 | 0.339807293494011 | 0.679614586988021 | 0.66019270650599 |
| 24 | 0.231867032592304 | 0.463734065184608 | 0.768132967407696 |
| 25 | 0.172028007241988 | 0.344056014483976 | 0.827971992758012 |
| 26 | 0.141593507373016 | 0.283187014746032 | 0.858406492626984 |
| 27 | 0.0825014724193353 | 0.165002944838671 | 0.917498527580665 |
| 28 | 0.0610285554850233 | 0.122057110970047 | 0.938971444514977 |
| 29 | 0.0329452490523201 | 0.0658904981046401 | 0.96705475094768 |
| 30 | 0.302547590970691 | 0.605095181941382 | 0.697452409029309 |
| 31 | 0.362571838110919 | 0.725143676221838 | 0.637428161889081 |
| 32 | 0.287946743765646 | 0.575893487531291 | 0.712053256234354 |
| 33 | 0.290981015171817 | 0.581962030343634 | 0.709018984828183 |
| 34 | 0.302144142350357 | 0.604288284700714 | 0.697855857649643 |
| 35 | 0.292660807430824 | 0.585321614861648 | 0.707339192569176 |
| 36 | 0.421969666603536 | 0.843939333207072 | 0.578030333396464 |
| 37 | 0.392899966329895 | 0.78579993265979 | 0.607100033670105 |
| Meta Analysis of Goldfeld-Quandt test for Heteroskedasticity | |||
| Description | # significant tests | % significant tests | OK/NOK |
| 1% type I error level | 0 | 0 | OK |
| 5% type I error level | 0 | 0 | OK |
| 10% type I error level | 2 | 0.111111111111111 | NOK |