| Multiple Linear Regression - Estimated Regression Equation |
| Y[t] = + 1.98590756285012 -0.00943061190311762X[t] + 1.52598349264715Y1[t] -0.930814478092821Y2[t] + 0.083898441498005Y3[t] + 0.200460686192801Y4[t] + 0.0943347310193463M1[t] + 0.0323584890565962M2[t] -0.132720980590720M3[t] + 0.0607190532369926M4[t] -0.026252010278004M5[t] -0.155003542088029M6[t] + 0.0471044771517931M7[t] + 0.38169268214532M8[t] -0.486310067426483M9[t] + 0.0920046044556282M10[t] + 0.123841822712825M11[t] -0.00251557949133382t + e[t] |
| Multiple Linear Regression - Ordinary Least Squares | |||||
| Variable | Parameter | S.D. | T-STAT H0: parameter = 0 | 2-tail p-value | 1-tail p-value |
| (Intercept) | 1.98590756285012 | 0.981443 | 2.0235 | 0.050101 | 0.02505 |
| X | -0.00943061190311762 | 0.004171 | -2.2607 | 0.029585 | 0.014792 |
| Y1 | 1.52598349264715 | 0.150629 | 10.1307 | 0 | 0 |
| Y2 | -0.930814478092821 | 0.289905 | -3.2108 | 0.002693 | 0.001347 |
| Y3 | 0.083898441498005 | 0.289711 | 0.2896 | 0.773702 | 0.386851 |
| Y4 | 0.200460686192801 | 0.161051 | 1.2447 | 0.220862 | 0.110431 |
| M1 | 0.0943347310193463 | 0.116215 | 0.8117 | 0.422005 | 0.211003 |
| M2 | 0.0323584890565962 | 0.122634 | 0.2639 | 0.793312 | 0.396656 |
| M3 | -0.132720980590720 | 0.125244 | -1.0597 | 0.29597 | 0.147985 |
| M4 | 0.0607190532369926 | 0.119433 | 0.5084 | 0.614114 | 0.307057 |
| M5 | -0.026252010278004 | 0.115121 | -0.228 | 0.82084 | 0.41042 |
| M6 | -0.155003542088029 | 0.110417 | -1.4038 | 0.168498 | 0.084249 |
| M7 | 0.0471044771517931 | 0.112013 | 0.4205 | 0.676469 | 0.338234 |
| M8 | 0.38169268214532 | 0.142536 | 2.6779 | 0.010882 | 0.005441 |
| M9 | -0.486310067426483 | 0.15808 | -3.0763 | 0.003874 | 0.001937 |
| M10 | 0.0920046044556282 | 0.170344 | 0.5401 | 0.592272 | 0.296136 |
| M11 | 0.123841822712825 | 0.141184 | 0.8772 | 0.385908 | 0.192954 |
| t | -0.00251557949133382 | 0.00295 | -0.8528 | 0.399113 | 0.199557 |
| Multiple Linear Regression - Regression Statistics | |
| Multiple R | 0.97925484748044 |
| R-squared | 0.958940056313942 |
| Adjusted R-squared | 0.9405711341386 |
| F-TEST (value) | 52.2044814148763 |
| F-TEST (DF numerator) | 17 |
| F-TEST (DF denominator) | 38 |
| p-value | 0 |
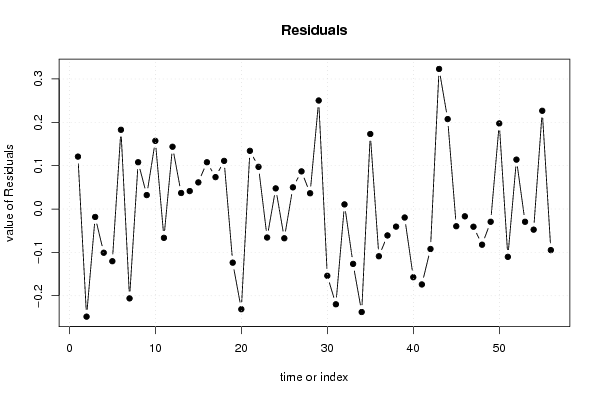
| Multiple Linear Regression - Residual Statistics | |
| Residual Standard Deviation | 0.162151251073433 |
| Sum Squared Residuals | 0.999135072537818 |
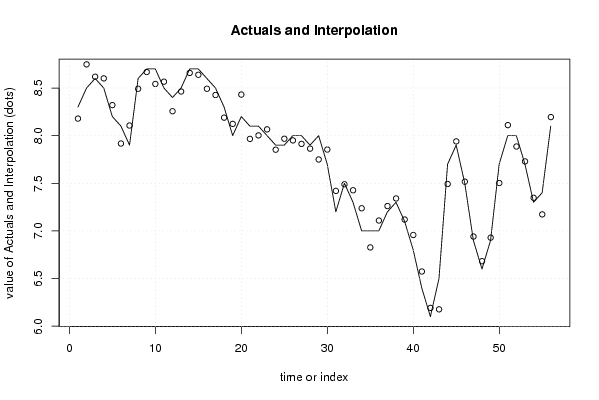
| Multiple Linear Regression - Actuals, Interpolation, and Residuals | |||
| Time or Index | Actuals | Interpolation Forecast | Residuals Prediction Error |
| 1 | 8.3 | 8.17909511284498 | 0.120904887155019 |
| 2 | 8.5 | 8.74828409812503 | -0.248284098125033 |
| 3 | 8.6 | 8.6183188717678 | -0.0183188717677956 |
| 4 | 8.5 | 8.60084889605629 | -0.100848896056286 |
| 5 | 8.2 | 8.32042637551077 | -0.120426375510767 |
| 6 | 8.1 | 7.91725152155756 | 0.182748478442443 |
| 7 | 7.9 | 8.1061425118694 | -0.206142511869397 |
| 8 | 8.6 | 8.49209447838564 | 0.107905521614356 |
| 9 | 8.7 | 8.6678263836203 | 0.0321736163797068 |
| 10 | 8.7 | 8.54279222538737 | 0.157207774612629 |
| 11 | 8.5 | 8.56651265504675 | -0.0665126550467537 |
| 12 | 8.4 | 8.25632210427889 | 0.143677895721114 |
| 13 | 8.5 | 8.46305084815029 | 0.0369491518497075 |
| 14 | 8.7 | 8.65858015475089 | 0.0414198452491076 |
| 15 | 8.7 | 8.63858633470873 | 0.0614136652912708 |
| 16 | 8.6 | 8.49211861279092 | 0.107881387209076 |
| 17 | 8.5 | 8.4264324336049 | 0.0735675663950994 |
| 18 | 8.3 | 8.18897892857799 | 0.111021071422013 |
| 19 | 8 | 8.12374239751187 | -0.123742397511875 |
| 20 | 8.2 | 8.43112082564044 | -0.23112082564044 |
| 21 | 8.1 | 7.96581554187862 | 0.134184458121378 |
| 22 | 8.1 | 8.00273396948358 | 0.0972660305164226 |
| 23 | 8 | 8.06574649826518 | -0.0657464982651822 |
| 24 | 7.9 | 7.85244324273629 | 0.0475567572637083 |
| 25 | 7.9 | 7.96749309393357 | -0.0674930939335735 |
| 26 | 8 | 7.9499704285265 | 0.0500295714734993 |
| 27 | 8 | 7.91313924421567 | 0.0868607557843335 |
| 28 | 7.9 | 7.8636229214314 | 0.0363770785686043 |
| 29 | 8 | 7.74969654447975 | 0.250303455520255 |
| 30 | 7.7 | 7.85397734078169 | -0.153977340781686 |
| 31 | 7.2 | 7.41980160674232 | -0.219801606742319 |
| 32 | 7.5 | 7.48940671888631 | 0.0105932811136916 |
| 33 | 7.3 | 7.42662905356713 | -0.126629053567130 |
| 34 | 7 | 7.23762559859791 | -0.237625598597911 |
| 35 | 7 | 6.82689121670033 | 0.17310878329967 |
| 36 | 7 | 7.10895524380063 | -0.108955243800627 |
| 37 | 7.2 | 7.26093986395214 | -0.060939863952142 |
| 38 | 7.3 | 7.34059898780629 | -0.0405989878062894 |
| 39 | 7.1 | 7.11963510731724 | -0.0196351073172426 |
| 40 | 6.8 | 6.95735293932386 | -0.157352939323864 |
| 41 | 6.4 | 6.57398653625693 | -0.173986536256931 |
| 42 | 6.1 | 6.1921677692498 | -0.0921677692498036 |
| 43 | 6.5 | 6.17690112181211 | 0.323098878187889 |
| 44 | 7.7 | 7.49258308221601 | 0.207416917783991 |
| 45 | 7.9 | 7.93972902093396 | -0.0397290209339552 |
| 46 | 7.5 | 7.51684820653114 | -0.0168482065311401 |
| 47 | 6.9 | 6.94084962998773 | -0.040849629987734 |
| 48 | 6.6 | 6.6822794091842 | -0.0822794091841953 |
| 49 | 6.9 | 6.92942108111901 | -0.0294210811190112 |
| 50 | 7.7 | 7.50256633079128 | 0.197433669208716 |
| 51 | 8 | 8.11032044199057 | -0.110320441990566 |
| 52 | 8 | 7.88605663039753 | 0.113943369602470 |
| 53 | 7.7 | 7.72945811014766 | -0.0294581101476566 |
| 54 | 7.3 | 7.34762443983297 | -0.047624439832967 |
| 55 | 7.4 | 7.1734123620643 | 0.226587637935702 |
| 56 | 8.1 | 8.1947948948716 | -0.0947948948715987 |
| Goldfeld-Quandt test for Heteroskedasticity | |||
| p-values | Alternative Hypothesis | ||
| breakpoint index | greater | 2-sided | less |
| 21 | 0.717185090280473 | 0.565629819439055 | 0.282814909719527 |
| 22 | 0.596302108247273 | 0.807395783505454 | 0.403697891752727 |
| 23 | 0.46859836062465 | 0.9371967212493 | 0.53140163937535 |
| 24 | 0.361765802520182 | 0.723531605040364 | 0.638234197479818 |
| 25 | 0.265362920123955 | 0.53072584024791 | 0.734637079876045 |
| 26 | 0.175802263187923 | 0.351604526375846 | 0.824197736812077 |
| 27 | 0.124093663653155 | 0.248187327306309 | 0.875906336346845 |
| 28 | 0.083972158475669 | 0.167944316951338 | 0.916027841524331 |
| 29 | 0.317015107409730 | 0.634030214819461 | 0.68298489259027 |
| 30 | 0.310402201215798 | 0.620804402431595 | 0.689597798784202 |
| 31 | 0.477852042778613 | 0.955704085557225 | 0.522147957221387 |
| 32 | 0.34415894208035 | 0.6883178841607 | 0.65584105791965 |
| 33 | 0.375432917915296 | 0.750865835830593 | 0.624567082084704 |
| 34 | 0.312644371539369 | 0.625288743078738 | 0.687355628460631 |
| 35 | 0.418579163694250 | 0.837158327388501 | 0.58142083630575 |
| Meta Analysis of Goldfeld-Quandt test for Heteroskedasticity | |||
| Description | # significant tests | % significant tests | OK/NOK |
| 1% type I error level | 0 | 0 | OK |
| 5% type I error level | 0 | 0 | OK |
| 10% type I error level | 0 | 0 | OK |