| Multiple Linear Regression - Estimated Regression Equation |
| werklh[t] = + 9.96948812558808 -0.0201393836545193ecogr[t] + e[t] |
| Multiple Linear Regression - Ordinary Least Squares | |||||
| Variable | Parameter | S.D. | T-STAT H0: parameter = 0 | 2-tail p-value | 1-tail p-value |
| (Intercept) | 9.96948812558808 | 0.993981 | 10.0299 | 0 | 0 |
| ecogr | -0.0201393836545193 | 0.009459 | -2.1291 | 0.037503 | 0.018752 |
| Multiple Linear Regression - Regression Statistics | |
| Multiple R | 0.269240771992664 |
| R-squared | 0.0724905933032056 |
| Adjusted R-squared | 0.0564990518084334 |
| F-TEST (value) | 4.53305851264576 |
| F-TEST (DF numerator) | 1 |
| F-TEST (DF denominator) | 58 |
| p-value | 0.0375032893091131 |
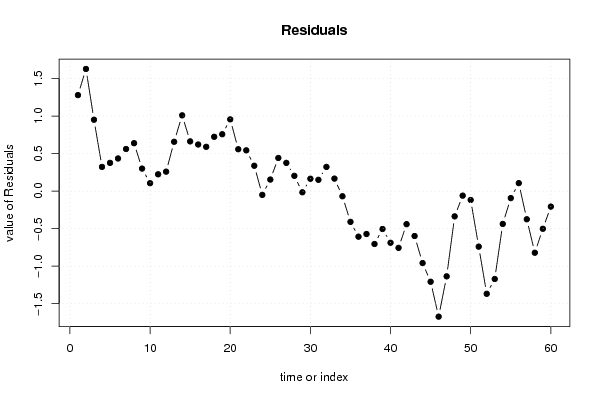
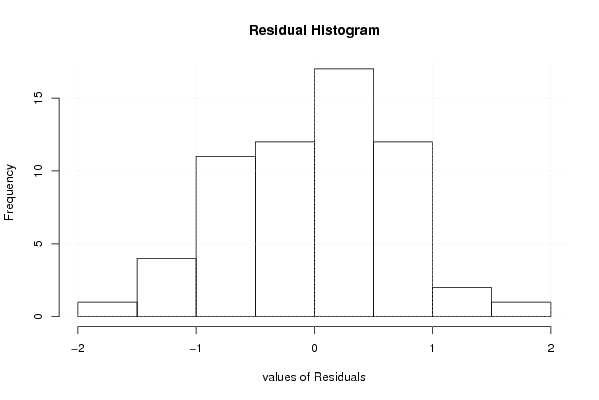
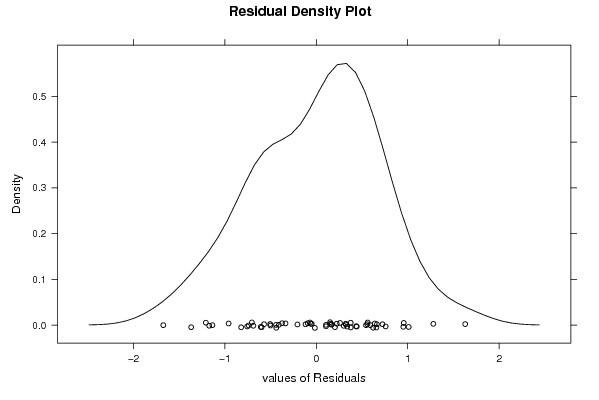
| Multiple Linear Regression - Residual Statistics | |
| Residual Standard Deviation | 0.687792930496844 |
| Sum Squared Residuals | 27.4374286840033 |
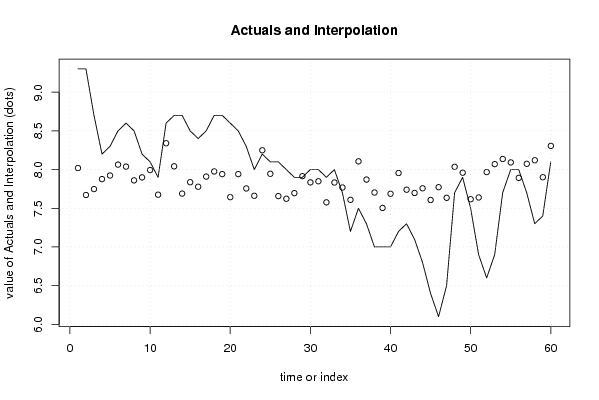
| Multiple Linear Regression - Actuals, Interpolation, and Residuals | |||
| Time or Index | Actuals | Interpolation Forecast | Residuals Prediction Error |
| 1 | 9.3 | 8.01999578783066 | 1.28000421216934 |
| 2 | 9.3 | 7.67158445060743 | 1.62841554939257 |
| 3 | 8.7 | 7.7481141084946 | 0.951885891505398 |
| 4 | 8.2 | 7.87700616388352 | 0.322993836116475 |
| 5 | 8.3 | 7.92332674628892 | 0.376673253711081 |
| 6 | 8.5 | 8.06430243187055 | 0.435697568129445 |
| 7 | 8.6 | 8.03812123311968 | 0.56187876688032 |
| 8 | 8.5 | 7.8608946569599 | 0.639105343040091 |
| 9 | 8.2 | 7.8991594859035 | 0.300840514096503 |
| 10 | 8.1 | 7.99381458907974 | 0.106185410920263 |
| 11 | 7.9 | 7.67561232733833 | 0.224387672661669 |
| 12 | 8.6 | 8.34021198793747 | 0.25978801206253 |
| 13 | 8.7 | 8.04214910985058 | 0.657850890149416 |
| 14 | 8.7 | 7.6897098958965 | 1.01029010410350 |
| 15 | 8.5 | 7.83672739657449 | 0.663272603425514 |
| 16 | 8.4 | 7.77832318397638 | 0.62167681602362 |
| 17 | 8.5 | 7.90922917773076 | 0.590770822269244 |
| 18 | 8.7 | 7.97568914379067 | 0.72431085620933 |
| 19 | 8.7 | 7.94145219157799 | 0.758547808422013 |
| 20 | 8.6 | 7.6433893134911 | 0.9566106865089 |
| 21 | 8.5 | 7.94145219157799 | 0.558547808422013 |
| 22 | 8.3 | 7.75616986195641 | 0.543830138043592 |
| 23 | 8 | 7.66151475878017 | 0.338485241219832 |
| 24 | 8.2 | 8.24958476149213 | -0.0495847614921333 |
| 25 | 8.1 | 7.94548006830889 | 0.154519931691109 |
| 26 | 8.1 | 7.65748688204926 | 0.442513117950736 |
| 27 | 8 | 7.62324992983658 | 0.376750070163419 |
| 28 | 7.9 | 7.69575171099285 | 0.20424828900715 |
| 29 | 7.9 | 7.91527099282711 | -0.0152709928271111 |
| 30 | 8 | 7.83471345820903 | 0.165286541790966 |
| 31 | 8 | 7.8488110267672 | 0.151188973232802 |
| 32 | 7.9 | 7.57692934743119 | 0.323070652568814 |
| 33 | 8 | 7.83269951984358 | 0.167300480156418 |
| 34 | 7.7 | 7.76825349214912 | -0.0682534921491201 |
| 35 | 7.2 | 7.60915236127842 | -0.409152361278417 |
| 36 | 7.5 | 8.10659513754505 | -0.606595137545045 |
| 37 | 7.3 | 7.87096434878717 | -0.570964348787169 |
| 38 | 7 | 7.70380746445466 | -0.703807464454658 |
| 39 | 7 | 7.50442756627492 | -0.504427566274916 |
| 40 | 7 | 7.68769595753104 | -0.687695957531043 |
| 41 | 7.2 | 7.95554976013615 | -0.75554976013615 |
| 42 | 7.3 | 7.7400583550328 | -0.440058355032793 |
| 43 | 7.1 | 7.6977656493583 | -0.597765649358303 |
| 44 | 6.8 | 7.75818380032186 | -0.95818380032186 |
| 45 | 6.4 | 7.60713842291297 | -1.20713842291296 |
| 46 | 6.1 | 7.77228136888002 | -1.67228136888002 |
| 47 | 6.5 | 7.63533356002929 | -1.13533356002929 |
| 48 | 7.7 | 8.03610729475423 | -0.336107294754227 |
| 49 | 7.9 | 7.95957763686705 | -0.0595776368670538 |
| 50 | 7.5 | 7.61720811474023 | -0.117208114740225 |
| 51 | 6.9 | 7.6393614367602 | -0.739361436760196 |
| 52 | 6.6 | 7.96763339032886 | -1.36763339032886 |
| 53 | 6.9 | 8.07034424696691 | -1.17034424696691 |
| 54 | 7.7 | 8.13680421302682 | -0.436804213026824 |
| 55 | 8 | 8.09249756898688 | -0.0924975689868818 |
| 56 | 8 | 7.89311767080714 | 0.106882329192860 |
| 57 | 7.7 | 8.07437212369781 | -0.374372123697814 |
| 58 | 7.3 | 8.12069270610321 | -0.820692706103209 |
| 59 | 7.4 | 7.90117342426895 | -0.501173424268948 |
| 60 | 8.1 | 8.30597503572479 | -0.205975035724787 |
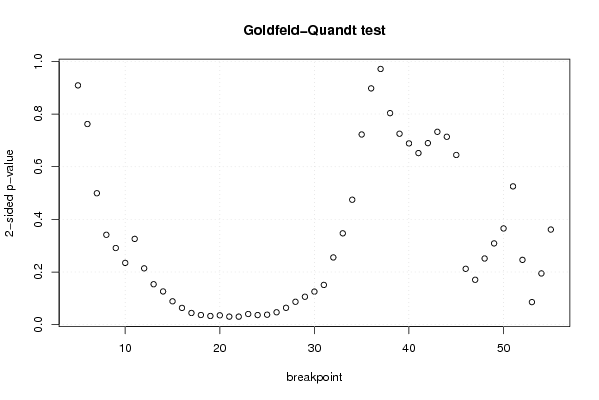
| Goldfeld-Quandt test for Heteroskedasticity | |||
| p-values | Alternative Hypothesis | ||
| breakpoint index | greater | 2-sided | less |
| 5 | 0.545528105638287 | 0.908943788723427 | 0.454471894361713 |
| 6 | 0.381033502204633 | 0.762067004409266 | 0.618966497795367 |
| 7 | 0.249613192264833 | 0.499226384529665 | 0.750386807735167 |
| 8 | 0.170657665924100 | 0.341315331848201 | 0.8293423340759 |
| 9 | 0.145550658975742 | 0.291101317951485 | 0.854449341024258 |
| 10 | 0.117320231263177 | 0.234640462526354 | 0.882679768736823 |
| 11 | 0.162890997287671 | 0.325781994575343 | 0.837109002712329 |
| 12 | 0.106939522794744 | 0.213879045589489 | 0.893060477205256 |
| 13 | 0.076765225673159 | 0.153530451346318 | 0.923234774326841 |
| 14 | 0.0630899906591629 | 0.126179981318326 | 0.936910009340837 |
| 15 | 0.0443609454795889 | 0.0887218909591778 | 0.95563905452041 |
| 16 | 0.0317740563958036 | 0.0635481127916072 | 0.968225943604196 |
| 17 | 0.0221960467878829 | 0.0443920935757658 | 0.977803953212117 |
| 18 | 0.0183109010136444 | 0.0366218020272888 | 0.981689098986356 |
| 19 | 0.0164544101881882 | 0.0329088203763765 | 0.983545589811812 |
| 20 | 0.0177581029501140 | 0.0355162059002281 | 0.982241897049886 |
| 21 | 0.0152219500478522 | 0.0304439000957045 | 0.984778049952148 |
| 22 | 0.0152008144150634 | 0.0304016288301268 | 0.984799185584937 |
| 23 | 0.0202130682479649 | 0.0404261364959298 | 0.979786931752035 |
| 24 | 0.0182038671308683 | 0.0364077342617366 | 0.981796132869132 |
| 25 | 0.0189097068135910 | 0.0378194136271820 | 0.98109029318641 |
| 26 | 0.0235094117128963 | 0.0470188234257925 | 0.976490588287104 |
| 27 | 0.0319614267400515 | 0.063922853480103 | 0.968038573259949 |
| 28 | 0.0434341373215162 | 0.0868682746430323 | 0.956565862678484 |
| 29 | 0.0529997127830285 | 0.105999425566057 | 0.947000287216971 |
| 30 | 0.0627488165471811 | 0.125497633094362 | 0.937251183452819 |
| 31 | 0.0754531112868472 | 0.150906222573694 | 0.924546888713153 |
| 32 | 0.127669730799682 | 0.255339461599364 | 0.872330269200318 |
| 33 | 0.173496291189407 | 0.346992582378813 | 0.826503708810593 |
| 34 | 0.237250109348874 | 0.474500218697749 | 0.762749890651126 |
| 35 | 0.36119682889689 | 0.72239365779378 | 0.63880317110311 |
| 36 | 0.448758499524152 | 0.897516999048304 | 0.551241500475848 |
| 37 | 0.514334783370788 | 0.971330433258423 | 0.485665216629212 |
| 38 | 0.598267072231332 | 0.803465855537335 | 0.401732927768668 |
| 39 | 0.637380567577753 | 0.725238864844494 | 0.362619432422247 |
| 40 | 0.655779559163065 | 0.688440881673871 | 0.344220440836935 |
| 41 | 0.674128238657755 | 0.651743522684489 | 0.325871761342245 |
| 42 | 0.655203549636609 | 0.689592900726783 | 0.344796450363391 |
| 43 | 0.633737060952578 | 0.732525878094844 | 0.366262939047422 |
| 44 | 0.643163006680332 | 0.713673986639335 | 0.356836993319668 |
| 45 | 0.677739293265436 | 0.644521413469127 | 0.322260706734564 |
| 46 | 0.893950680187967 | 0.212098639624065 | 0.106049319812033 |
| 47 | 0.914772726571678 | 0.170454546856644 | 0.0852272734283222 |
| 48 | 0.874339202618679 | 0.251321594762643 | 0.125660797381321 |
| 49 | 0.845645960231083 | 0.308708079537834 | 0.154354039768917 |
| 50 | 0.817232042428698 | 0.365535915142604 | 0.182767957571302 |
| 51 | 0.737339461700033 | 0.525321076599933 | 0.262660538299967 |
| 52 | 0.876932348186234 | 0.246135303627533 | 0.123067651813766 |
| 53 | 0.957134844709529 | 0.0857303105809427 | 0.0428651552904713 |
| 54 | 0.9027064609065 | 0.194587078186999 | 0.0972935390934994 |
| 55 | 0.819381671558883 | 0.361236656882234 | 0.180618328441117 |
| Meta Analysis of Goldfeld-Quandt test for Heteroskedasticity | |||
| Description | # significant tests | % significant tests | OK/NOK |
| 1% type I error level | 0 | 0 | OK |
| 5% type I error level | 10 | 0.196078431372549 | NOK |
| 10% type I error level | 15 | 0.294117647058824 | NOK |