Free Statistics

of Irreproducible Research!

Author's title

Author*The author of this computation has been verified*
R Software Modulerwasp_autocorrelation.wasp
Title produced by software(Partial) Autocorrelation Function
Date of computationThu, 17 Dec 2009 04:48:10 -0700
Cite this page as followsStatistical Computations at FreeStatistics.org, Office for Research Development and Education, URL https://freestatistics.org/blog/index.php?v=date/2009/Dec/17/t1261050523wrkyiv35z02b2vs.htm/, Retrieved Mon, 06 May 2024 13:52:15 +0000
Statistical Computations at FreeStatistics.org, Office for Research Development and Education, URL https://freestatistics.org/blog/index.php?pk=68771, Retrieved Mon, 06 May 2024 13:52:15 +0000
QR Codes:

Original text written by user:
IsPrivate?No (this computation is public)
User-defined keywords
Estimated Impact140
Family? (F = Feedback message, R = changed R code, M = changed R Module, P = changed Parameters, D = changed Data)
-       [(Partial) Autocorrelation Function] [] [2009-12-17 11:48:10] [71596e6a53ccce532e52aaf6113616ef] [Current]
Feedback Forum

Post a new message
Dataseries X:
1322.4
1089.2
1147.3
1196.4
1190.2
1146
1139.8
1045.6
1050.9
1117.3
1120
1052.1
1065.8
1092.5
1422
1367.5
1136.3
1293.7
1154.8
1206.7
1199
1265
1247.1
1116.5
1153.9
1077.4
1132.5
1058.8
1195.1
1263.4
1023.1
1141
1116.3
1135.6
1210.5
1230
1136.5
1068.7
1372.5
1049.9
1302.2
1305.9
1173.5
1277.4
1238.6
1508.6
1423.4
1375.1
1344.1
1287.5
1446.9
1451
1604.4
1501.5
1522.8
1328
1420.5
1648
1631.1
1396.6
1663.4
1283
1582.4
1785.2
1853.6
1994.1
2042.8
1586.1
1942.4
1763.6
1819.9
1836
1449.9
1513.3
1677.7
1494.4
1375.3
1577.7
1537.7
1356.6
1469.6


Summary of computational transaction
Raw Inputview raw input (R code)
Raw Outputview raw output of R engine
Computing time1 seconds
R Server'Gwilym Jenkins' @ 72.249.127.135

\begin{tabular}{lllllllll}
\hline
Summary of computational transaction \tabularnewline
Raw Input & view raw input (R code)  \tabularnewline
Raw Output & view raw output of R engine  \tabularnewline
Computing time & 1 seconds \tabularnewline
R Server & 'Gwilym Jenkins' @ 72.249.127.135 \tabularnewline
\hline
\end{tabular}
%Source: https://freestatistics.org/blog/index.php?pk=68771&T=0

[TABLE]
[ROW][C]Summary of computational transaction[/C][/ROW]
[ROW][C]Raw Input[/C][C]view raw input (R code) [/C][/ROW]
[ROW][C]Raw Output[/C][C]view raw output of R engine [/C][/ROW]
[ROW][C]Computing time[/C][C]1 seconds[/C][/ROW]
[ROW][C]R Server[/C][C]'Gwilym Jenkins' @ 72.249.127.135[/C][/ROW]
[/TABLE]
Source: https://freestatistics.org/blog/index.php?pk=68771&T=0

Globally Unique Identifier (entire table): ba.freestatistics.org/blog/index.php?pk=68771&T=0

As an alternative you can also use a QR Code:  

The GUIDs for individual cells are displayed in the table below:

Summary of computational transaction
Raw Inputview raw input (R code)
Raw Outputview raw output of R engine
Computing time1 seconds
R Server'Gwilym Jenkins' @ 72.249.127.135


Autocorrelation Function
Time lag kACF(k)T-STATP-value
10.7868297.08150
20.7606426.84580
30.7429276.68630
40.6699286.02940
50.6897316.20760
60.6760386.08430
70.5897865.30810
80.5375034.83753e-06
90.4803894.32352.2e-05
100.4316873.88520.000104
110.4405393.96487.9e-05
120.4437143.99347.1e-05
130.3473373.1260.00123
140.3534683.18120.00104
150.2693232.42390.008791
160.2425282.18280.015975
170.2575242.31770.011495
180.2131881.91870.029273
190.1907821.7170.044897
200.1615421.45390.074922
210.1016260.91460.18155
220.0756370.68070.248992
230.0737380.66360.254403
240.0485990.43740.331497
250.0157450.14170.443832
26-0.026636-0.23970.405574
27-0.096908-0.87220.192846
28-0.074645-0.67180.251811
29-0.115509-1.03960.150815
30-0.116267-1.04640.149244
31-0.133282-1.19950.116909
32-0.180606-1.62550.053975
33-0.205784-1.85210.033831
34-0.232077-2.08870.019938
35-0.233395-2.10060.019395
36-0.225521-2.02970.022836

\begin{tabular}{lllllllll}
\hline
Autocorrelation Function \tabularnewline
Time lag k & ACF(k) & T-STAT & P-value \tabularnewline
1 & 0.786829 & 7.0815 & 0 \tabularnewline
2 & 0.760642 & 6.8458 & 0 \tabularnewline
3 & 0.742927 & 6.6863 & 0 \tabularnewline
4 & 0.669928 & 6.0294 & 0 \tabularnewline
5 & 0.689731 & 6.2076 & 0 \tabularnewline
6 & 0.676038 & 6.0843 & 0 \tabularnewline
7 & 0.589786 & 5.3081 & 0 \tabularnewline
8 & 0.537503 & 4.8375 & 3e-06 \tabularnewline
9 & 0.480389 & 4.3235 & 2.2e-05 \tabularnewline
10 & 0.431687 & 3.8852 & 0.000104 \tabularnewline
11 & 0.440539 & 3.9648 & 7.9e-05 \tabularnewline
12 & 0.443714 & 3.9934 & 7.1e-05 \tabularnewline
13 & 0.347337 & 3.126 & 0.00123 \tabularnewline
14 & 0.353468 & 3.1812 & 0.00104 \tabularnewline
15 & 0.269323 & 2.4239 & 0.008791 \tabularnewline
16 & 0.242528 & 2.1828 & 0.015975 \tabularnewline
17 & 0.257524 & 2.3177 & 0.011495 \tabularnewline
18 & 0.213188 & 1.9187 & 0.029273 \tabularnewline
19 & 0.190782 & 1.717 & 0.044897 \tabularnewline
20 & 0.161542 & 1.4539 & 0.074922 \tabularnewline
21 & 0.101626 & 0.9146 & 0.18155 \tabularnewline
22 & 0.075637 & 0.6807 & 0.248992 \tabularnewline
23 & 0.073738 & 0.6636 & 0.254403 \tabularnewline
24 & 0.048599 & 0.4374 & 0.331497 \tabularnewline
25 & 0.015745 & 0.1417 & 0.443832 \tabularnewline
26 & -0.026636 & -0.2397 & 0.405574 \tabularnewline
27 & -0.096908 & -0.8722 & 0.192846 \tabularnewline
28 & -0.074645 & -0.6718 & 0.251811 \tabularnewline
29 & -0.115509 & -1.0396 & 0.150815 \tabularnewline
30 & -0.116267 & -1.0464 & 0.149244 \tabularnewline
31 & -0.133282 & -1.1995 & 0.116909 \tabularnewline
32 & -0.180606 & -1.6255 & 0.053975 \tabularnewline
33 & -0.205784 & -1.8521 & 0.033831 \tabularnewline
34 & -0.232077 & -2.0887 & 0.019938 \tabularnewline
35 & -0.233395 & -2.1006 & 0.019395 \tabularnewline
36 & -0.225521 & -2.0297 & 0.022836 \tabularnewline
\hline
\end{tabular}
%Source: https://freestatistics.org/blog/index.php?pk=68771&T=1

[TABLE]
[ROW][C]Autocorrelation Function[/C][/ROW]
[ROW][C]Time lag k[/C][C]ACF(k)[/C][C]T-STAT[/C][C]P-value[/C][/ROW]
[ROW][C]1[/C][C]0.786829[/C][C]7.0815[/C][C]0[/C][/ROW]
[ROW][C]2[/C][C]0.760642[/C][C]6.8458[/C][C]0[/C][/ROW]
[ROW][C]3[/C][C]0.742927[/C][C]6.6863[/C][C]0[/C][/ROW]
[ROW][C]4[/C][C]0.669928[/C][C]6.0294[/C][C]0[/C][/ROW]
[ROW][C]5[/C][C]0.689731[/C][C]6.2076[/C][C]0[/C][/ROW]
[ROW][C]6[/C][C]0.676038[/C][C]6.0843[/C][C]0[/C][/ROW]
[ROW][C]7[/C][C]0.589786[/C][C]5.3081[/C][C]0[/C][/ROW]
[ROW][C]8[/C][C]0.537503[/C][C]4.8375[/C][C]3e-06[/C][/ROW]
[ROW][C]9[/C][C]0.480389[/C][C]4.3235[/C][C]2.2e-05[/C][/ROW]
[ROW][C]10[/C][C]0.431687[/C][C]3.8852[/C][C]0.000104[/C][/ROW]
[ROW][C]11[/C][C]0.440539[/C][C]3.9648[/C][C]7.9e-05[/C][/ROW]
[ROW][C]12[/C][C]0.443714[/C][C]3.9934[/C][C]7.1e-05[/C][/ROW]
[ROW][C]13[/C][C]0.347337[/C][C]3.126[/C][C]0.00123[/C][/ROW]
[ROW][C]14[/C][C]0.353468[/C][C]3.1812[/C][C]0.00104[/C][/ROW]
[ROW][C]15[/C][C]0.269323[/C][C]2.4239[/C][C]0.008791[/C][/ROW]
[ROW][C]16[/C][C]0.242528[/C][C]2.1828[/C][C]0.015975[/C][/ROW]
[ROW][C]17[/C][C]0.257524[/C][C]2.3177[/C][C]0.011495[/C][/ROW]
[ROW][C]18[/C][C]0.213188[/C][C]1.9187[/C][C]0.029273[/C][/ROW]
[ROW][C]19[/C][C]0.190782[/C][C]1.717[/C][C]0.044897[/C][/ROW]
[ROW][C]20[/C][C]0.161542[/C][C]1.4539[/C][C]0.074922[/C][/ROW]
[ROW][C]21[/C][C]0.101626[/C][C]0.9146[/C][C]0.18155[/C][/ROW]
[ROW][C]22[/C][C]0.075637[/C][C]0.6807[/C][C]0.248992[/C][/ROW]
[ROW][C]23[/C][C]0.073738[/C][C]0.6636[/C][C]0.254403[/C][/ROW]
[ROW][C]24[/C][C]0.048599[/C][C]0.4374[/C][C]0.331497[/C][/ROW]
[ROW][C]25[/C][C]0.015745[/C][C]0.1417[/C][C]0.443832[/C][/ROW]
[ROW][C]26[/C][C]-0.026636[/C][C]-0.2397[/C][C]0.405574[/C][/ROW]
[ROW][C]27[/C][C]-0.096908[/C][C]-0.8722[/C][C]0.192846[/C][/ROW]
[ROW][C]28[/C][C]-0.074645[/C][C]-0.6718[/C][C]0.251811[/C][/ROW]
[ROW][C]29[/C][C]-0.115509[/C][C]-1.0396[/C][C]0.150815[/C][/ROW]
[ROW][C]30[/C][C]-0.116267[/C][C]-1.0464[/C][C]0.149244[/C][/ROW]
[ROW][C]31[/C][C]-0.133282[/C][C]-1.1995[/C][C]0.116909[/C][/ROW]
[ROW][C]32[/C][C]-0.180606[/C][C]-1.6255[/C][C]0.053975[/C][/ROW]
[ROW][C]33[/C][C]-0.205784[/C][C]-1.8521[/C][C]0.033831[/C][/ROW]
[ROW][C]34[/C][C]-0.232077[/C][C]-2.0887[/C][C]0.019938[/C][/ROW]
[ROW][C]35[/C][C]-0.233395[/C][C]-2.1006[/C][C]0.019395[/C][/ROW]
[ROW][C]36[/C][C]-0.225521[/C][C]-2.0297[/C][C]0.022836[/C][/ROW]
[/TABLE]
Source: https://freestatistics.org/blog/index.php?pk=68771&T=1

Globally Unique Identifier (entire table): ba.freestatistics.org/blog/index.php?pk=68771&T=1

As an alternative you can also use a QR Code:  

The GUIDs for individual cells are displayed in the table below:

Autocorrelation Function
Time lag kACF(k)T-STATP-value
10.7868297.08150
20.7606426.84580
30.7429276.68630
40.6699286.02940
50.6897316.20760
60.6760386.08430
70.5897865.30810
80.5375034.83753e-06
90.4803894.32352.2e-05
100.4316873.88520.000104
110.4405393.96487.9e-05
120.4437143.99347.1e-05
130.3473373.1260.00123
140.3534683.18120.00104
150.2693232.42390.008791
160.2425282.18280.015975
170.2575242.31770.011495
180.2131881.91870.029273
190.1907821.7170.044897
200.1615421.45390.074922
210.1016260.91460.18155
220.0756370.68070.248992
230.0737380.66360.254403
240.0485990.43740.331497
250.0157450.14170.443832
26-0.026636-0.23970.405574
27-0.096908-0.87220.192846
28-0.074645-0.67180.251811
29-0.115509-1.03960.150815
30-0.116267-1.04640.149244
31-0.133282-1.19950.116909
32-0.180606-1.62550.053975
33-0.205784-1.85210.033831
34-0.232077-2.08870.019938
35-0.233395-2.10060.019395
36-0.225521-2.02970.022836


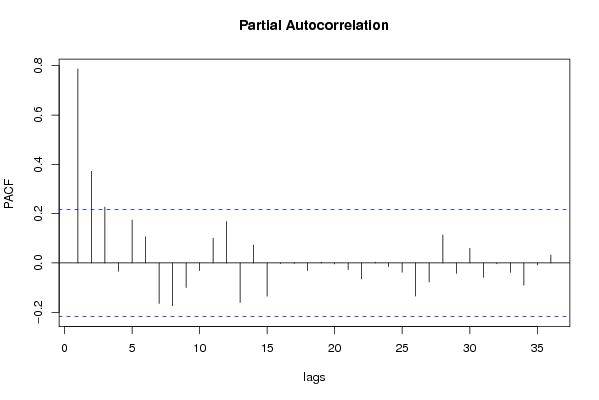
Partial Autocorrelation Function
Time lag kPACF(k)T-STATP-value
10.7868297.08150
20.3715973.34440.000626
30.2267632.04090.02226
4-0.034032-0.30630.380086
50.1739581.56560.060668
60.1066430.95980.17001
7-0.164211-1.47790.071656
8-0.173175-1.55860.061498
9-0.099423-0.89480.186772
10-0.030921-0.27830.39075
110.1005770.90520.184025
120.1679551.51160.067264
13-0.159909-1.43920.076976
140.0729150.65620.256767
15-0.13468-1.21210.114495
16-0.002383-0.02140.49147
17-0.002688-0.02420.490378
18-0.031017-0.27920.390418
190.0025860.02330.490746
20-0.003916-0.03520.485988
21-0.027048-0.24340.404142
22-0.064806-0.58330.280671
230.0029920.02690.489293
24-0.014537-0.13080.448116
25-0.038082-0.34270.366341
26-0.13433-1.2090.115097
27-0.07696-0.69260.245257
280.1136831.02310.154643
29-0.041794-0.37610.353896
300.0595650.53610.296685
31-0.058519-0.52670.299929
32-0.003625-0.03260.487026
33-0.038105-0.34290.366264
34-0.090819-0.81740.208057
35-0.00865-0.07780.469071
360.0323940.29150.385689

\begin{tabular}{lllllllll}
\hline
Partial Autocorrelation Function \tabularnewline
Time lag k & PACF(k) & T-STAT & P-value \tabularnewline
1 & 0.786829 & 7.0815 & 0 \tabularnewline
2 & 0.371597 & 3.3444 & 0.000626 \tabularnewline
3 & 0.226763 & 2.0409 & 0.02226 \tabularnewline
4 & -0.034032 & -0.3063 & 0.380086 \tabularnewline
5 & 0.173958 & 1.5656 & 0.060668 \tabularnewline
6 & 0.106643 & 0.9598 & 0.17001 \tabularnewline
7 & -0.164211 & -1.4779 & 0.071656 \tabularnewline
8 & -0.173175 & -1.5586 & 0.061498 \tabularnewline
9 & -0.099423 & -0.8948 & 0.186772 \tabularnewline
10 & -0.030921 & -0.2783 & 0.39075 \tabularnewline
11 & 0.100577 & 0.9052 & 0.184025 \tabularnewline
12 & 0.167955 & 1.5116 & 0.067264 \tabularnewline
13 & -0.159909 & -1.4392 & 0.076976 \tabularnewline
14 & 0.072915 & 0.6562 & 0.256767 \tabularnewline
15 & -0.13468 & -1.2121 & 0.114495 \tabularnewline
16 & -0.002383 & -0.0214 & 0.49147 \tabularnewline
17 & -0.002688 & -0.0242 & 0.490378 \tabularnewline
18 & -0.031017 & -0.2792 & 0.390418 \tabularnewline
19 & 0.002586 & 0.0233 & 0.490746 \tabularnewline
20 & -0.003916 & -0.0352 & 0.485988 \tabularnewline
21 & -0.027048 & -0.2434 & 0.404142 \tabularnewline
22 & -0.064806 & -0.5833 & 0.280671 \tabularnewline
23 & 0.002992 & 0.0269 & 0.489293 \tabularnewline
24 & -0.014537 & -0.1308 & 0.448116 \tabularnewline
25 & -0.038082 & -0.3427 & 0.366341 \tabularnewline
26 & -0.13433 & -1.209 & 0.115097 \tabularnewline
27 & -0.07696 & -0.6926 & 0.245257 \tabularnewline
28 & 0.113683 & 1.0231 & 0.154643 \tabularnewline
29 & -0.041794 & -0.3761 & 0.353896 \tabularnewline
30 & 0.059565 & 0.5361 & 0.296685 \tabularnewline
31 & -0.058519 & -0.5267 & 0.299929 \tabularnewline
32 & -0.003625 & -0.0326 & 0.487026 \tabularnewline
33 & -0.038105 & -0.3429 & 0.366264 \tabularnewline
34 & -0.090819 & -0.8174 & 0.208057 \tabularnewline
35 & -0.00865 & -0.0778 & 0.469071 \tabularnewline
36 & 0.032394 & 0.2915 & 0.385689 \tabularnewline
\hline
\end{tabular}
%Source: https://freestatistics.org/blog/index.php?pk=68771&T=2

[TABLE]
[ROW][C]Partial Autocorrelation Function[/C][/ROW]
[ROW][C]Time lag k[/C][C]PACF(k)[/C][C]T-STAT[/C][C]P-value[/C][/ROW]
[ROW][C]1[/C][C]0.786829[/C][C]7.0815[/C][C]0[/C][/ROW]
[ROW][C]2[/C][C]0.371597[/C][C]3.3444[/C][C]0.000626[/C][/ROW]
[ROW][C]3[/C][C]0.226763[/C][C]2.0409[/C][C]0.02226[/C][/ROW]
[ROW][C]4[/C][C]-0.034032[/C][C]-0.3063[/C][C]0.380086[/C][/ROW]
[ROW][C]5[/C][C]0.173958[/C][C]1.5656[/C][C]0.060668[/C][/ROW]
[ROW][C]6[/C][C]0.106643[/C][C]0.9598[/C][C]0.17001[/C][/ROW]
[ROW][C]7[/C][C]-0.164211[/C][C]-1.4779[/C][C]0.071656[/C][/ROW]
[ROW][C]8[/C][C]-0.173175[/C][C]-1.5586[/C][C]0.061498[/C][/ROW]
[ROW][C]9[/C][C]-0.099423[/C][C]-0.8948[/C][C]0.186772[/C][/ROW]
[ROW][C]10[/C][C]-0.030921[/C][C]-0.2783[/C][C]0.39075[/C][/ROW]
[ROW][C]11[/C][C]0.100577[/C][C]0.9052[/C][C]0.184025[/C][/ROW]
[ROW][C]12[/C][C]0.167955[/C][C]1.5116[/C][C]0.067264[/C][/ROW]
[ROW][C]13[/C][C]-0.159909[/C][C]-1.4392[/C][C]0.076976[/C][/ROW]
[ROW][C]14[/C][C]0.072915[/C][C]0.6562[/C][C]0.256767[/C][/ROW]
[ROW][C]15[/C][C]-0.13468[/C][C]-1.2121[/C][C]0.114495[/C][/ROW]
[ROW][C]16[/C][C]-0.002383[/C][C]-0.0214[/C][C]0.49147[/C][/ROW]
[ROW][C]17[/C][C]-0.002688[/C][C]-0.0242[/C][C]0.490378[/C][/ROW]
[ROW][C]18[/C][C]-0.031017[/C][C]-0.2792[/C][C]0.390418[/C][/ROW]
[ROW][C]19[/C][C]0.002586[/C][C]0.0233[/C][C]0.490746[/C][/ROW]
[ROW][C]20[/C][C]-0.003916[/C][C]-0.0352[/C][C]0.485988[/C][/ROW]
[ROW][C]21[/C][C]-0.027048[/C][C]-0.2434[/C][C]0.404142[/C][/ROW]
[ROW][C]22[/C][C]-0.064806[/C][C]-0.5833[/C][C]0.280671[/C][/ROW]
[ROW][C]23[/C][C]0.002992[/C][C]0.0269[/C][C]0.489293[/C][/ROW]
[ROW][C]24[/C][C]-0.014537[/C][C]-0.1308[/C][C]0.448116[/C][/ROW]
[ROW][C]25[/C][C]-0.038082[/C][C]-0.3427[/C][C]0.366341[/C][/ROW]
[ROW][C]26[/C][C]-0.13433[/C][C]-1.209[/C][C]0.115097[/C][/ROW]
[ROW][C]27[/C][C]-0.07696[/C][C]-0.6926[/C][C]0.245257[/C][/ROW]
[ROW][C]28[/C][C]0.113683[/C][C]1.0231[/C][C]0.154643[/C][/ROW]
[ROW][C]29[/C][C]-0.041794[/C][C]-0.3761[/C][C]0.353896[/C][/ROW]
[ROW][C]30[/C][C]0.059565[/C][C]0.5361[/C][C]0.296685[/C][/ROW]
[ROW][C]31[/C][C]-0.058519[/C][C]-0.5267[/C][C]0.299929[/C][/ROW]
[ROW][C]32[/C][C]-0.003625[/C][C]-0.0326[/C][C]0.487026[/C][/ROW]
[ROW][C]33[/C][C]-0.038105[/C][C]-0.3429[/C][C]0.366264[/C][/ROW]
[ROW][C]34[/C][C]-0.090819[/C][C]-0.8174[/C][C]0.208057[/C][/ROW]
[ROW][C]35[/C][C]-0.00865[/C][C]-0.0778[/C][C]0.469071[/C][/ROW]
[ROW][C]36[/C][C]0.032394[/C][C]0.2915[/C][C]0.385689[/C][/ROW]
[/TABLE]
Source: https://freestatistics.org/blog/index.php?pk=68771&T=2

Globally Unique Identifier (entire table): ba.freestatistics.org/blog/index.php?pk=68771&T=2

As an alternative you can also use a QR Code:  

The GUIDs for individual cells are displayed in the table below:

Partial Autocorrelation Function
Time lag kPACF(k)T-STATP-value
10.7868297.08150
20.3715973.34440.000626
30.2267632.04090.02226
4-0.034032-0.30630.380086
50.1739581.56560.060668
60.1066430.95980.17001
7-0.164211-1.47790.071656
8-0.173175-1.55860.061498
9-0.099423-0.89480.186772
10-0.030921-0.27830.39075
110.1005770.90520.184025
120.1679551.51160.067264
13-0.159909-1.43920.076976
140.0729150.65620.256767
15-0.13468-1.21210.114495
16-0.002383-0.02140.49147
17-0.002688-0.02420.490378
18-0.031017-0.27920.390418
190.0025860.02330.490746
20-0.003916-0.03520.485988
21-0.027048-0.24340.404142
22-0.064806-0.58330.280671
230.0029920.02690.489293
24-0.014537-0.13080.448116
25-0.038082-0.34270.366341
26-0.13433-1.2090.115097
27-0.07696-0.69260.245257
280.1136831.02310.154643
29-0.041794-0.37610.353896
300.0595650.53610.296685
31-0.058519-0.52670.299929
32-0.003625-0.03260.487026
33-0.038105-0.34290.366264
34-0.090819-0.81740.208057
35-0.00865-0.07780.469071
360.0323940.29150.385689


Parameters (Session):
par1 = 36 ; par2 = 1 ; par3 = 0 ; par4 = 0 ; par5 = 12 ; par6 = MA ; par7 = 0.95 ;
Parameters (R input):
par1 = 36 ; par2 = 1 ; par3 = 0 ; par4 = 0 ; par5 = 12 ; par6 = MA ; par7 = 0.95 ;
R code (references can be found in the software module):
if (par1 == 'Default') {
par1 = 10*log10(length(x))
} else {
par1 <- as.numeric(par1)
}
par2 <- as.numeric(par2)
par3 <- as.numeric(par3)
par4 <- as.numeric(par4)
par5 <- as.numeric(par5)
if (par6 == 'White Noise') par6 <- 'white' else par6 <- 'ma'
par7 <- as.numeric(par7)
if (par2 == 0) {
x <- log(x)
} else {
x <- (x ^ par2 - 1) / par2
}
if (par3 > 0) x <- diff(x,lag=1,difference=par3)
if (par4 > 0) x <- diff(x,lag=par5,difference=par4)
bitmap(file='pic1.png')
racf <- acf(x, par1, main='Autocorrelation', xlab='time lag', ylab='ACF', ci.type=par6, ci=par7, sub=paste('(lambda=',par2,', d=',par3,', D=',par4,', CI=', par7, ', CI type=',par6,')',sep=''))
dev.off()
bitmap(file='pic2.png')
rpacf <- pacf(x,par1,main='Partial Autocorrelation',xlab='lags',ylab='PACF')
dev.off()
(myacf <- c(racf$acf))
(mypacf <- c(rpacf$acf))
lengthx <- length(x)
sqrtn <- sqrt(lengthx)
load(file='createtable')
a<-table.start()
a<-table.row.start(a)
a<-table.element(a,'Autocorrelation Function',4,TRUE)
a<-table.row.end(a)
a<-table.row.start(a)
a<-table.element(a,'Time lag k',header=TRUE)
a<-table.element(a,hyperlink('basics.htm','ACF(k)','click here for more information about the Autocorrelation Function'),header=TRUE)
a<-table.element(a,'T-STAT',header=TRUE)
a<-table.element(a,'P-value',header=TRUE)
a<-table.row.end(a)
for (i in 2:(par1+1)) {
a<-table.row.start(a)
a<-table.element(a,i-1,header=TRUE)
a<-table.element(a,round(myacf[i],6))
mytstat <- myacf[i]*sqrtn
a<-table.element(a,round(mytstat,4))
a<-table.element(a,round(1-pt(abs(mytstat),lengthx),6))
a<-table.row.end(a)
}
a<-table.end(a)
table.save(a,file='mytable.tab')
a<-table.start()
a<-table.row.start(a)
a<-table.element(a,'Partial Autocorrelation Function',4,TRUE)
a<-table.row.end(a)
a<-table.row.start(a)
a<-table.element(a,'Time lag k',header=TRUE)
a<-table.element(a,hyperlink('basics.htm','PACF(k)','click here for more information about the Partial Autocorrelation Function'),header=TRUE)
a<-table.element(a,'T-STAT',header=TRUE)
a<-table.element(a,'P-value',header=TRUE)
a<-table.row.end(a)
for (i in 1:par1) {
a<-table.row.start(a)
a<-table.element(a,i,header=TRUE)
a<-table.element(a,round(mypacf[i],6))
mytstat <- mypacf[i]*sqrtn
a<-table.element(a,round(mytstat,4))
a<-table.element(a,round(1-pt(abs(mytstat),lengthx),6))
a<-table.row.end(a)
}
a<-table.end(a)
table.save(a,file='mytable1.tab')