Free Statistics

of Irreproducible Research!

Author's title

Author*The author of this computation has been verified*
R Software Modulerwasp_autocorrelation.wasp
Title produced by software(Partial) Autocorrelation Function
Date of computationWed, 16 Dec 2009 15:43:21 -0700
Cite this page as followsStatistical Computations at FreeStatistics.org, Office for Research Development and Education, URL https://freestatistics.org/blog/index.php?v=date/2009/Dec/16/t1261003432ni3lzlt9b80evtj.htm/, Retrieved Tue, 30 Apr 2024 19:53:06 +0000
Statistical Computations at FreeStatistics.org, Office for Research Development and Education, URL https://freestatistics.org/blog/index.php?pk=68620, Retrieved Tue, 30 Apr 2024 19:53:06 +0000
QR Codes:

Original text written by user:
IsPrivate?No (this computation is public)
User-defined keywords
Estimated Impact134
Family? (F = Feedback message, R = changed R code, M = changed R Module, P = changed Parameters, D = changed Data)
-     [(Partial) Autocorrelation Function] [Identifying integ...] [2009-11-23 18:42:00] [d46757a0a8c9b00540ab7e7e0c34bfc4]
-    D  [(Partial) Autocorrelation Function] [ACF met: d=1, D=0...] [2009-12-03 22:52:29] [34d27ebe78dc2d31581e8710befe8733]
-   P     [(Partial) Autocorrelation Function] [ACF met: d=0, D=1...] [2009-12-04 14:13:45] [34d27ebe78dc2d31581e8710befe8733]
-    D        [(Partial) Autocorrelation Function] [ACF met: d=0, D=1...] [2009-12-16 22:43:21] [371dc2189c569d90e2c1567f632c3ec0] [Current]
-               [(Partial) Autocorrelation Function] [ACF met: d=1, D=0...] [2009-12-19 11:29:26] [34d27ebe78dc2d31581e8710befe8733]
Feedback Forum

Post a new message
Dataseries X:
441
449
452
462
455
461
461
463
462
456
455
456
472
472
471
465
459
465
468
467
463
460
462
461
476
476
471
453
443
442
444
438
427
424
416
406
431
434
418
412
404
409
412
406
398
397
385
390
413
413
401
397
397
409
419
424
428
430
424
433
456


Summary of computational transaction
Raw Inputview raw input (R code)
Raw Outputview raw output of R engine
Computing time1 seconds
R Server'Gwilym Jenkins' @ 72.249.127.135

\begin{tabular}{lllllllll}
\hline
Summary of computational transaction \tabularnewline
Raw Input & view raw input (R code)  \tabularnewline
Raw Output & view raw output of R engine  \tabularnewline
Computing time & 1 seconds \tabularnewline
R Server & 'Gwilym Jenkins' @ 72.249.127.135 \tabularnewline
\hline
\end{tabular}
%Source: https://freestatistics.org/blog/index.php?pk=68620&T=0

[TABLE]
[ROW][C]Summary of computational transaction[/C][/ROW]
[ROW][C]Raw Input[/C][C]view raw input (R code) [/C][/ROW]
[ROW][C]Raw Output[/C][C]view raw output of R engine [/C][/ROW]
[ROW][C]Computing time[/C][C]1 seconds[/C][/ROW]
[ROW][C]R Server[/C][C]'Gwilym Jenkins' @ 72.249.127.135[/C][/ROW]
[/TABLE]
Source: https://freestatistics.org/blog/index.php?pk=68620&T=0

Globally Unique Identifier (entire table): ba.freestatistics.org/blog/index.php?pk=68620&T=0

As an alternative you can also use a QR Code:  

The GUIDs for individual cells are displayed in the table below:

Summary of computational transaction
Raw Inputview raw input (R code)
Raw Outputview raw output of R engine
Computing time1 seconds
R Server'Gwilym Jenkins' @ 72.249.127.135


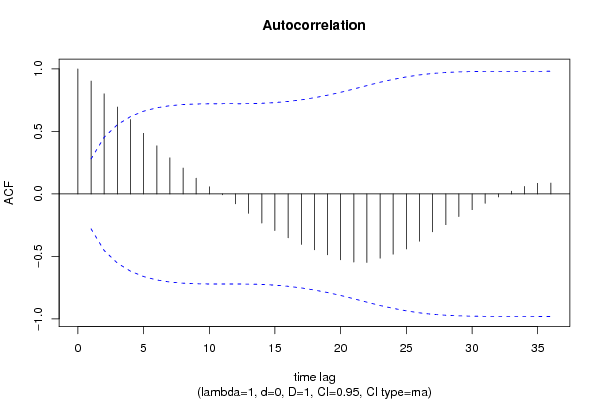
Autocorrelation Function
Time lag kACF(k)T-STATP-value
10.9029766.32080
20.8013235.60930
30.6952864.8676e-06
40.5944754.16136.4e-05
50.4848553.3940.000686
60.3848462.69390.004822
70.288592.02010.024427
80.2064851.44540.077356
90.1253010.87710.192354
100.0566490.39650.346714
11-0.007432-0.0520.479361
12-0.07916-0.55410.291009
13-0.155706-1.08990.140535
14-0.233198-1.63240.054505
15-0.293546-2.05480.022624
16-0.351299-2.45910.008754
17-0.404323-2.83030.003363
18-0.448165-3.13720.001442
19-0.487892-3.41520.000644
20-0.527797-3.69460.000277
21-0.545808-3.82070.000188
22-0.548728-3.84110.000176
23-0.51475-3.60320.000367
24-0.482846-3.37990.000715
25-0.440917-3.08640.001664
26-0.378438-2.64910.005416
27-0.303613-2.12530.019315
28-0.246816-1.72770.045169
29-0.181364-1.26950.105121
30-0.126863-0.8880.189428
31-0.075902-0.53130.2988
32-0.024698-0.17290.431727
330.0216230.15140.440157
340.0599840.41990.338202
350.0848350.59380.277673
360.0862030.60340.274505

\begin{tabular}{lllllllll}
\hline
Autocorrelation Function \tabularnewline
Time lag k & ACF(k) & T-STAT & P-value \tabularnewline
1 & 0.902976 & 6.3208 & 0 \tabularnewline
2 & 0.801323 & 5.6093 & 0 \tabularnewline
3 & 0.695286 & 4.867 & 6e-06 \tabularnewline
4 & 0.594475 & 4.1613 & 6.4e-05 \tabularnewline
5 & 0.484855 & 3.394 & 0.000686 \tabularnewline
6 & 0.384846 & 2.6939 & 0.004822 \tabularnewline
7 & 0.28859 & 2.0201 & 0.024427 \tabularnewline
8 & 0.206485 & 1.4454 & 0.077356 \tabularnewline
9 & 0.125301 & 0.8771 & 0.192354 \tabularnewline
10 & 0.056649 & 0.3965 & 0.346714 \tabularnewline
11 & -0.007432 & -0.052 & 0.479361 \tabularnewline
12 & -0.07916 & -0.5541 & 0.291009 \tabularnewline
13 & -0.155706 & -1.0899 & 0.140535 \tabularnewline
14 & -0.233198 & -1.6324 & 0.054505 \tabularnewline
15 & -0.293546 & -2.0548 & 0.022624 \tabularnewline
16 & -0.351299 & -2.4591 & 0.008754 \tabularnewline
17 & -0.404323 & -2.8303 & 0.003363 \tabularnewline
18 & -0.448165 & -3.1372 & 0.001442 \tabularnewline
19 & -0.487892 & -3.4152 & 0.000644 \tabularnewline
20 & -0.527797 & -3.6946 & 0.000277 \tabularnewline
21 & -0.545808 & -3.8207 & 0.000188 \tabularnewline
22 & -0.548728 & -3.8411 & 0.000176 \tabularnewline
23 & -0.51475 & -3.6032 & 0.000367 \tabularnewline
24 & -0.482846 & -3.3799 & 0.000715 \tabularnewline
25 & -0.440917 & -3.0864 & 0.001664 \tabularnewline
26 & -0.378438 & -2.6491 & 0.005416 \tabularnewline
27 & -0.303613 & -2.1253 & 0.019315 \tabularnewline
28 & -0.246816 & -1.7277 & 0.045169 \tabularnewline
29 & -0.181364 & -1.2695 & 0.105121 \tabularnewline
30 & -0.126863 & -0.888 & 0.189428 \tabularnewline
31 & -0.075902 & -0.5313 & 0.2988 \tabularnewline
32 & -0.024698 & -0.1729 & 0.431727 \tabularnewline
33 & 0.021623 & 0.1514 & 0.440157 \tabularnewline
34 & 0.059984 & 0.4199 & 0.338202 \tabularnewline
35 & 0.084835 & 0.5938 & 0.277673 \tabularnewline
36 & 0.086203 & 0.6034 & 0.274505 \tabularnewline
\hline
\end{tabular}
%Source: https://freestatistics.org/blog/index.php?pk=68620&T=1

[TABLE]
[ROW][C]Autocorrelation Function[/C][/ROW]
[ROW][C]Time lag k[/C][C]ACF(k)[/C][C]T-STAT[/C][C]P-value[/C][/ROW]
[ROW][C]1[/C][C]0.902976[/C][C]6.3208[/C][C]0[/C][/ROW]
[ROW][C]2[/C][C]0.801323[/C][C]5.6093[/C][C]0[/C][/ROW]
[ROW][C]3[/C][C]0.695286[/C][C]4.867[/C][C]6e-06[/C][/ROW]
[ROW][C]4[/C][C]0.594475[/C][C]4.1613[/C][C]6.4e-05[/C][/ROW]
[ROW][C]5[/C][C]0.484855[/C][C]3.394[/C][C]0.000686[/C][/ROW]
[ROW][C]6[/C][C]0.384846[/C][C]2.6939[/C][C]0.004822[/C][/ROW]
[ROW][C]7[/C][C]0.28859[/C][C]2.0201[/C][C]0.024427[/C][/ROW]
[ROW][C]8[/C][C]0.206485[/C][C]1.4454[/C][C]0.077356[/C][/ROW]
[ROW][C]9[/C][C]0.125301[/C][C]0.8771[/C][C]0.192354[/C][/ROW]
[ROW][C]10[/C][C]0.056649[/C][C]0.3965[/C][C]0.346714[/C][/ROW]
[ROW][C]11[/C][C]-0.007432[/C][C]-0.052[/C][C]0.479361[/C][/ROW]
[ROW][C]12[/C][C]-0.07916[/C][C]-0.5541[/C][C]0.291009[/C][/ROW]
[ROW][C]13[/C][C]-0.155706[/C][C]-1.0899[/C][C]0.140535[/C][/ROW]
[ROW][C]14[/C][C]-0.233198[/C][C]-1.6324[/C][C]0.054505[/C][/ROW]
[ROW][C]15[/C][C]-0.293546[/C][C]-2.0548[/C][C]0.022624[/C][/ROW]
[ROW][C]16[/C][C]-0.351299[/C][C]-2.4591[/C][C]0.008754[/C][/ROW]
[ROW][C]17[/C][C]-0.404323[/C][C]-2.8303[/C][C]0.003363[/C][/ROW]
[ROW][C]18[/C][C]-0.448165[/C][C]-3.1372[/C][C]0.001442[/C][/ROW]
[ROW][C]19[/C][C]-0.487892[/C][C]-3.4152[/C][C]0.000644[/C][/ROW]
[ROW][C]20[/C][C]-0.527797[/C][C]-3.6946[/C][C]0.000277[/C][/ROW]
[ROW][C]21[/C][C]-0.545808[/C][C]-3.8207[/C][C]0.000188[/C][/ROW]
[ROW][C]22[/C][C]-0.548728[/C][C]-3.8411[/C][C]0.000176[/C][/ROW]
[ROW][C]23[/C][C]-0.51475[/C][C]-3.6032[/C][C]0.000367[/C][/ROW]
[ROW][C]24[/C][C]-0.482846[/C][C]-3.3799[/C][C]0.000715[/C][/ROW]
[ROW][C]25[/C][C]-0.440917[/C][C]-3.0864[/C][C]0.001664[/C][/ROW]
[ROW][C]26[/C][C]-0.378438[/C][C]-2.6491[/C][C]0.005416[/C][/ROW]
[ROW][C]27[/C][C]-0.303613[/C][C]-2.1253[/C][C]0.019315[/C][/ROW]
[ROW][C]28[/C][C]-0.246816[/C][C]-1.7277[/C][C]0.045169[/C][/ROW]
[ROW][C]29[/C][C]-0.181364[/C][C]-1.2695[/C][C]0.105121[/C][/ROW]
[ROW][C]30[/C][C]-0.126863[/C][C]-0.888[/C][C]0.189428[/C][/ROW]
[ROW][C]31[/C][C]-0.075902[/C][C]-0.5313[/C][C]0.2988[/C][/ROW]
[ROW][C]32[/C][C]-0.024698[/C][C]-0.1729[/C][C]0.431727[/C][/ROW]
[ROW][C]33[/C][C]0.021623[/C][C]0.1514[/C][C]0.440157[/C][/ROW]
[ROW][C]34[/C][C]0.059984[/C][C]0.4199[/C][C]0.338202[/C][/ROW]
[ROW][C]35[/C][C]0.084835[/C][C]0.5938[/C][C]0.277673[/C][/ROW]
[ROW][C]36[/C][C]0.086203[/C][C]0.6034[/C][C]0.274505[/C][/ROW]
[/TABLE]
Source: https://freestatistics.org/blog/index.php?pk=68620&T=1

Globally Unique Identifier (entire table): ba.freestatistics.org/blog/index.php?pk=68620&T=1

As an alternative you can also use a QR Code:  

The GUIDs for individual cells are displayed in the table below:

Autocorrelation Function
Time lag kACF(k)T-STATP-value
10.9029766.32080
20.8013235.60930
30.6952864.8676e-06
40.5944754.16136.4e-05
50.4848553.3940.000686
60.3848462.69390.004822
70.288592.02010.024427
80.2064851.44540.077356
90.1253010.87710.192354
100.0566490.39650.346714
11-0.007432-0.0520.479361
12-0.07916-0.55410.291009
13-0.155706-1.08990.140535
14-0.233198-1.63240.054505
15-0.293546-2.05480.022624
16-0.351299-2.45910.008754
17-0.404323-2.83030.003363
18-0.448165-3.13720.001442
19-0.487892-3.41520.000644
20-0.527797-3.69460.000277
21-0.545808-3.82070.000188
22-0.548728-3.84110.000176
23-0.51475-3.60320.000367
24-0.482846-3.37990.000715
25-0.440917-3.08640.001664
26-0.378438-2.64910.005416
27-0.303613-2.12530.019315
28-0.246816-1.72770.045169
29-0.181364-1.26950.105121
30-0.126863-0.8880.189428
31-0.075902-0.53130.2988
32-0.024698-0.17290.431727
330.0216230.15140.440157
340.0599840.41990.338202
350.0848350.59380.277673
360.0862030.60340.274505


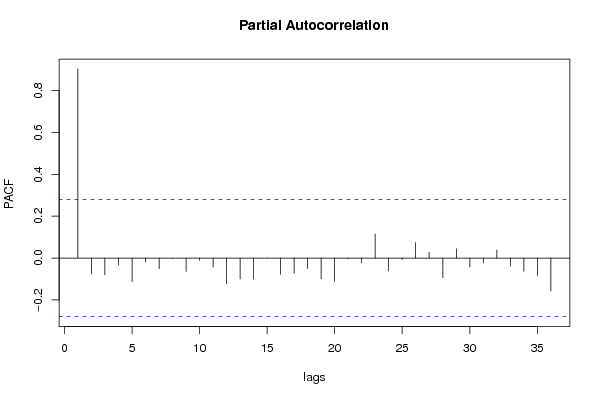
Partial Autocorrelation Function
Time lag kPACF(k)T-STATP-value
10.9029766.32080
2-0.076054-0.53240.298436
3-0.079783-0.55850.28953
4-0.032977-0.23080.409201
5-0.112269-0.78590.21786
6-0.019833-0.13880.445076
7-0.050934-0.35650.361484
8-0.001697-0.01190.495285
9-0.063828-0.44680.328494
10-0.010806-0.07560.470005
11-0.043365-0.30360.381377
12-0.122592-0.85810.197496
13-0.100375-0.70260.242807
14-0.100406-0.70280.242741
150.0003520.00250.499023
16-0.077658-0.54360.294589
17-0.07215-0.5050.307894
18-0.049819-0.34870.364393
19-0.099275-0.69490.245191
20-0.112469-0.78730.217453
21-0.002793-0.01950.492242
22-0.022229-0.15560.438494
230.1152310.80660.211892
24-0.061967-0.43380.333181
25-0.006624-0.04640.481603
260.0729710.51080.305893
270.0265170.18560.426756
28-0.093146-0.6520.258716
290.0442730.30990.378972
30-0.042794-0.29960.382891
31-0.022307-0.15610.438279
320.038380.26870.39466
33-0.039181-0.27430.392515
34-0.0627-0.43890.331331
35-0.083821-0.58670.280035
36-0.157159-1.10010.138329

\begin{tabular}{lllllllll}
\hline
Partial Autocorrelation Function \tabularnewline
Time lag k & PACF(k) & T-STAT & P-value \tabularnewline
1 & 0.902976 & 6.3208 & 0 \tabularnewline
2 & -0.076054 & -0.5324 & 0.298436 \tabularnewline
3 & -0.079783 & -0.5585 & 0.28953 \tabularnewline
4 & -0.032977 & -0.2308 & 0.409201 \tabularnewline
5 & -0.112269 & -0.7859 & 0.21786 \tabularnewline
6 & -0.019833 & -0.1388 & 0.445076 \tabularnewline
7 & -0.050934 & -0.3565 & 0.361484 \tabularnewline
8 & -0.001697 & -0.0119 & 0.495285 \tabularnewline
9 & -0.063828 & -0.4468 & 0.328494 \tabularnewline
10 & -0.010806 & -0.0756 & 0.470005 \tabularnewline
11 & -0.043365 & -0.3036 & 0.381377 \tabularnewline
12 & -0.122592 & -0.8581 & 0.197496 \tabularnewline
13 & -0.100375 & -0.7026 & 0.242807 \tabularnewline
14 & -0.100406 & -0.7028 & 0.242741 \tabularnewline
15 & 0.000352 & 0.0025 & 0.499023 \tabularnewline
16 & -0.077658 & -0.5436 & 0.294589 \tabularnewline
17 & -0.07215 & -0.505 & 0.307894 \tabularnewline
18 & -0.049819 & -0.3487 & 0.364393 \tabularnewline
19 & -0.099275 & -0.6949 & 0.245191 \tabularnewline
20 & -0.112469 & -0.7873 & 0.217453 \tabularnewline
21 & -0.002793 & -0.0195 & 0.492242 \tabularnewline
22 & -0.022229 & -0.1556 & 0.438494 \tabularnewline
23 & 0.115231 & 0.8066 & 0.211892 \tabularnewline
24 & -0.061967 & -0.4338 & 0.333181 \tabularnewline
25 & -0.006624 & -0.0464 & 0.481603 \tabularnewline
26 & 0.072971 & 0.5108 & 0.305893 \tabularnewline
27 & 0.026517 & 0.1856 & 0.426756 \tabularnewline
28 & -0.093146 & -0.652 & 0.258716 \tabularnewline
29 & 0.044273 & 0.3099 & 0.378972 \tabularnewline
30 & -0.042794 & -0.2996 & 0.382891 \tabularnewline
31 & -0.022307 & -0.1561 & 0.438279 \tabularnewline
32 & 0.03838 & 0.2687 & 0.39466 \tabularnewline
33 & -0.039181 & -0.2743 & 0.392515 \tabularnewline
34 & -0.0627 & -0.4389 & 0.331331 \tabularnewline
35 & -0.083821 & -0.5867 & 0.280035 \tabularnewline
36 & -0.157159 & -1.1001 & 0.138329 \tabularnewline
\hline
\end{tabular}
%Source: https://freestatistics.org/blog/index.php?pk=68620&T=2

[TABLE]
[ROW][C]Partial Autocorrelation Function[/C][/ROW]
[ROW][C]Time lag k[/C][C]PACF(k)[/C][C]T-STAT[/C][C]P-value[/C][/ROW]
[ROW][C]1[/C][C]0.902976[/C][C]6.3208[/C][C]0[/C][/ROW]
[ROW][C]2[/C][C]-0.076054[/C][C]-0.5324[/C][C]0.298436[/C][/ROW]
[ROW][C]3[/C][C]-0.079783[/C][C]-0.5585[/C][C]0.28953[/C][/ROW]
[ROW][C]4[/C][C]-0.032977[/C][C]-0.2308[/C][C]0.409201[/C][/ROW]
[ROW][C]5[/C][C]-0.112269[/C][C]-0.7859[/C][C]0.21786[/C][/ROW]
[ROW][C]6[/C][C]-0.019833[/C][C]-0.1388[/C][C]0.445076[/C][/ROW]
[ROW][C]7[/C][C]-0.050934[/C][C]-0.3565[/C][C]0.361484[/C][/ROW]
[ROW][C]8[/C][C]-0.001697[/C][C]-0.0119[/C][C]0.495285[/C][/ROW]
[ROW][C]9[/C][C]-0.063828[/C][C]-0.4468[/C][C]0.328494[/C][/ROW]
[ROW][C]10[/C][C]-0.010806[/C][C]-0.0756[/C][C]0.470005[/C][/ROW]
[ROW][C]11[/C][C]-0.043365[/C][C]-0.3036[/C][C]0.381377[/C][/ROW]
[ROW][C]12[/C][C]-0.122592[/C][C]-0.8581[/C][C]0.197496[/C][/ROW]
[ROW][C]13[/C][C]-0.100375[/C][C]-0.7026[/C][C]0.242807[/C][/ROW]
[ROW][C]14[/C][C]-0.100406[/C][C]-0.7028[/C][C]0.242741[/C][/ROW]
[ROW][C]15[/C][C]0.000352[/C][C]0.0025[/C][C]0.499023[/C][/ROW]
[ROW][C]16[/C][C]-0.077658[/C][C]-0.5436[/C][C]0.294589[/C][/ROW]
[ROW][C]17[/C][C]-0.07215[/C][C]-0.505[/C][C]0.307894[/C][/ROW]
[ROW][C]18[/C][C]-0.049819[/C][C]-0.3487[/C][C]0.364393[/C][/ROW]
[ROW][C]19[/C][C]-0.099275[/C][C]-0.6949[/C][C]0.245191[/C][/ROW]
[ROW][C]20[/C][C]-0.112469[/C][C]-0.7873[/C][C]0.217453[/C][/ROW]
[ROW][C]21[/C][C]-0.002793[/C][C]-0.0195[/C][C]0.492242[/C][/ROW]
[ROW][C]22[/C][C]-0.022229[/C][C]-0.1556[/C][C]0.438494[/C][/ROW]
[ROW][C]23[/C][C]0.115231[/C][C]0.8066[/C][C]0.211892[/C][/ROW]
[ROW][C]24[/C][C]-0.061967[/C][C]-0.4338[/C][C]0.333181[/C][/ROW]
[ROW][C]25[/C][C]-0.006624[/C][C]-0.0464[/C][C]0.481603[/C][/ROW]
[ROW][C]26[/C][C]0.072971[/C][C]0.5108[/C][C]0.305893[/C][/ROW]
[ROW][C]27[/C][C]0.026517[/C][C]0.1856[/C][C]0.426756[/C][/ROW]
[ROW][C]28[/C][C]-0.093146[/C][C]-0.652[/C][C]0.258716[/C][/ROW]
[ROW][C]29[/C][C]0.044273[/C][C]0.3099[/C][C]0.378972[/C][/ROW]
[ROW][C]30[/C][C]-0.042794[/C][C]-0.2996[/C][C]0.382891[/C][/ROW]
[ROW][C]31[/C][C]-0.022307[/C][C]-0.1561[/C][C]0.438279[/C][/ROW]
[ROW][C]32[/C][C]0.03838[/C][C]0.2687[/C][C]0.39466[/C][/ROW]
[ROW][C]33[/C][C]-0.039181[/C][C]-0.2743[/C][C]0.392515[/C][/ROW]
[ROW][C]34[/C][C]-0.0627[/C][C]-0.4389[/C][C]0.331331[/C][/ROW]
[ROW][C]35[/C][C]-0.083821[/C][C]-0.5867[/C][C]0.280035[/C][/ROW]
[ROW][C]36[/C][C]-0.157159[/C][C]-1.1001[/C][C]0.138329[/C][/ROW]
[/TABLE]
Source: https://freestatistics.org/blog/index.php?pk=68620&T=2

Globally Unique Identifier (entire table): ba.freestatistics.org/blog/index.php?pk=68620&T=2

As an alternative you can also use a QR Code:  

The GUIDs for individual cells are displayed in the table below:

Partial Autocorrelation Function
Time lag kPACF(k)T-STATP-value
10.9029766.32080
2-0.076054-0.53240.298436
3-0.079783-0.55850.28953
4-0.032977-0.23080.409201
5-0.112269-0.78590.21786
6-0.019833-0.13880.445076
7-0.050934-0.35650.361484
8-0.001697-0.01190.495285
9-0.063828-0.44680.328494
10-0.010806-0.07560.470005
11-0.043365-0.30360.381377
12-0.122592-0.85810.197496
13-0.100375-0.70260.242807
14-0.100406-0.70280.242741
150.0003520.00250.499023
16-0.077658-0.54360.294589
17-0.07215-0.5050.307894
18-0.049819-0.34870.364393
19-0.099275-0.69490.245191
20-0.112469-0.78730.217453
21-0.002793-0.01950.492242
22-0.022229-0.15560.438494
230.1152310.80660.211892
24-0.061967-0.43380.333181
25-0.006624-0.04640.481603
260.0729710.51080.305893
270.0265170.18560.426756
28-0.093146-0.6520.258716
290.0442730.30990.378972
30-0.042794-0.29960.382891
31-0.022307-0.15610.438279
320.038380.26870.39466
33-0.039181-0.27430.392515
34-0.0627-0.43890.331331
35-0.083821-0.58670.280035
36-0.157159-1.10010.138329


Parameters (Session):
par1 = 36 ; par2 = 1 ; par3 = 0 ; par4 = 1 ; par5 = 12 ; par6 = MA ; par7 = 0.95 ;
Parameters (R input):
par1 = 36 ; par2 = 1 ; par3 = 0 ; par4 = 1 ; par5 = 12 ; par6 = MA ; par7 = 0.95 ;
R code (references can be found in the software module):
if (par1 == 'Default') {
par1 = 10*log10(length(x))
} else {
par1 <- as.numeric(par1)
}
par2 <- as.numeric(par2)
par3 <- as.numeric(par3)
par4 <- as.numeric(par4)
par5 <- as.numeric(par5)
if (par6 == 'White Noise') par6 <- 'white' else par6 <- 'ma'
par7 <- as.numeric(par7)
if (par2 == 0) {
x <- log(x)
} else {
x <- (x ^ par2 - 1) / par2
}
if (par3 > 0) x <- diff(x,lag=1,difference=par3)
if (par4 > 0) x <- diff(x,lag=par5,difference=par4)
bitmap(file='pic1.png')
racf <- acf(x, par1, main='Autocorrelation', xlab='time lag', ylab='ACF', ci.type=par6, ci=par7, sub=paste('(lambda=',par2,', d=',par3,', D=',par4,', CI=', par7, ', CI type=',par6,')',sep=''))
dev.off()
bitmap(file='pic2.png')
rpacf <- pacf(x,par1,main='Partial Autocorrelation',xlab='lags',ylab='PACF')
dev.off()
(myacf <- c(racf$acf))
(mypacf <- c(rpacf$acf))
lengthx <- length(x)
sqrtn <- sqrt(lengthx)
load(file='createtable')
a<-table.start()
a<-table.row.start(a)
a<-table.element(a,'Autocorrelation Function',4,TRUE)
a<-table.row.end(a)
a<-table.row.start(a)
a<-table.element(a,'Time lag k',header=TRUE)
a<-table.element(a,hyperlink('basics.htm','ACF(k)','click here for more information about the Autocorrelation Function'),header=TRUE)
a<-table.element(a,'T-STAT',header=TRUE)
a<-table.element(a,'P-value',header=TRUE)
a<-table.row.end(a)
for (i in 2:(par1+1)) {
a<-table.row.start(a)
a<-table.element(a,i-1,header=TRUE)
a<-table.element(a,round(myacf[i],6))
mytstat <- myacf[i]*sqrtn
a<-table.element(a,round(mytstat,4))
a<-table.element(a,round(1-pt(abs(mytstat),lengthx),6))
a<-table.row.end(a)
}
a<-table.end(a)
table.save(a,file='mytable.tab')
a<-table.start()
a<-table.row.start(a)
a<-table.element(a,'Partial Autocorrelation Function',4,TRUE)
a<-table.row.end(a)
a<-table.row.start(a)
a<-table.element(a,'Time lag k',header=TRUE)
a<-table.element(a,hyperlink('basics.htm','PACF(k)','click here for more information about the Partial Autocorrelation Function'),header=TRUE)
a<-table.element(a,'T-STAT',header=TRUE)
a<-table.element(a,'P-value',header=TRUE)
a<-table.row.end(a)
for (i in 1:par1) {
a<-table.row.start(a)
a<-table.element(a,i,header=TRUE)
a<-table.element(a,round(mypacf[i],6))
mytstat <- mypacf[i]*sqrtn
a<-table.element(a,round(mytstat,4))
a<-table.element(a,round(1-pt(abs(mytstat),lengthx),6))
a<-table.row.end(a)
}
a<-table.end(a)
table.save(a,file='mytable1.tab')