Free Statistics

of Irreproducible Research!

Author's title

Author*The author of this computation has been verified*
R Software Modulerwasp_autocorrelation.wasp
Title produced by software(Partial) Autocorrelation Function
Date of computationWed, 16 Dec 2009 12:19:53 -0700
Cite this page as followsStatistical Computations at FreeStatistics.org, Office for Research Development and Education, URL https://freestatistics.org/blog/index.php?v=date/2009/Dec/16/t1260991229p1vevxw2qrscjqw.htm/, Retrieved Tue, 30 Apr 2024 10:25:30 +0000
Statistical Computations at FreeStatistics.org, Office for Research Development and Education, URL https://freestatistics.org/blog/index.php?pk=68558, Retrieved Tue, 30 Apr 2024 10:25:30 +0000
QR Codes:

Original text written by user:
IsPrivate?No (this computation is public)
User-defined keywords
Estimated Impact134
Family? (F = Feedback message, R = changed R code, M = changed R Module, P = changed Parameters, D = changed Data)
-     [Standard Deviation-Mean Plot] [deel1 st dev mean...] [2009-12-16 19:13:20] [95cead3ebb75668735f848316249436a]
- RMP   [(Partial) Autocorrelation Function] [deel1 acf D=d=0] [2009-12-16 19:17:58] [95cead3ebb75668735f848316249436a]
-           [(Partial) Autocorrelation Function] [deel1 acf D=1] [2009-12-16 19:19:53] [95523ebdb89b97dbf680ec91e0b4bca2] [Current]
Feedback Forum

Post a new message
Dataseries X:
627
696
825
677
656
785
412
352
839
729
696
641
695
638
762
635
721
854
418
367
824
687
601
676
740
691
683
594
729
731
386
331
707
715
657
653
642
643
718
654
632
731
392
344
792
852
649
629
685
617
715
715
629
916
531
357
917
828
708
858
775
785
1006
789
734
906
532
387
991
841


Summary of computational transaction
Raw Inputview raw input (R code)
Raw Outputview raw output of R engine
Computing time2 seconds
R Server'Gwilym Jenkins' @ 72.249.127.135

\begin{tabular}{lllllllll}
\hline
Summary of computational transaction \tabularnewline
Raw Input & view raw input (R code)  \tabularnewline
Raw Output & view raw output of R engine  \tabularnewline
Computing time & 2 seconds \tabularnewline
R Server & 'Gwilym Jenkins' @ 72.249.127.135 \tabularnewline
\hline
\end{tabular}
%Source: https://freestatistics.org/blog/index.php?pk=68558&T=0

[TABLE]
[ROW][C]Summary of computational transaction[/C][/ROW]
[ROW][C]Raw Input[/C][C]view raw input (R code) [/C][/ROW]
[ROW][C]Raw Output[/C][C]view raw output of R engine [/C][/ROW]
[ROW][C]Computing time[/C][C]2 seconds[/C][/ROW]
[ROW][C]R Server[/C][C]'Gwilym Jenkins' @ 72.249.127.135[/C][/ROW]
[/TABLE]
Source: https://freestatistics.org/blog/index.php?pk=68558&T=0

Globally Unique Identifier (entire table): ba.freestatistics.org/blog/index.php?pk=68558&T=0

As an alternative you can also use a QR Code:  

The GUIDs for individual cells are displayed in the table below:

Summary of computational transaction
Raw Inputview raw input (R code)
Raw Outputview raw output of R engine
Computing time2 seconds
R Server'Gwilym Jenkins' @ 72.249.127.135


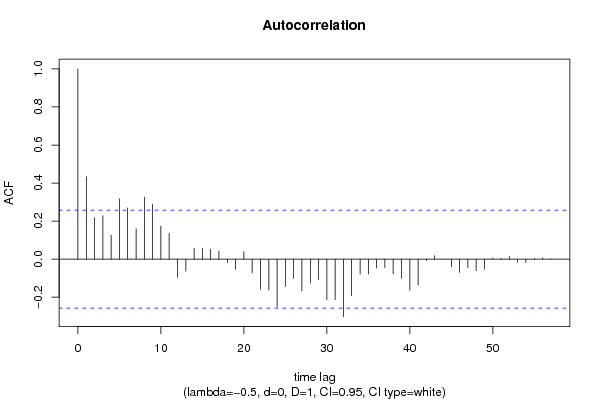
Autocorrelation Function
Time lag kACF(k)T-STATP-value
10.4328013.29610.000838
20.2189471.66750.050408
30.2281431.73750.043804
40.1254870.95570.1716
50.3174882.41790.009386
60.2692652.05070.022414
70.1596061.21550.114545
80.3257162.48060.00802
90.2890882.20160.015841
100.1742481.3270.094849
110.1371441.04450.150304
12-0.095574-0.72790.234811
13-0.063177-0.48110.316114
140.0566980.43180.333745
150.0564880.43020.334323
160.0523140.39840.345893
170.0421270.32080.374745
18-0.01853-0.14110.444132
19-0.054033-0.41150.341111
200.039810.30320.381418
21-0.071795-0.54680.293317
22-0.157764-1.20150.117221
23-0.162336-1.23630.110663
24-0.25214-1.92020.029875
25-0.143935-1.09620.138765
26-0.100827-0.76790.222837
27-0.167324-1.27430.103819
28-0.124997-0.9520.172536
29-0.106652-0.81220.209988
30-0.213134-1.62320.054987
31-0.213918-1.62920.05435
32-0.302277-2.30210.01247
33-0.191729-1.46020.07482
34-0.078277-0.59610.276701
35-0.078331-0.59650.276565
36-0.047025-0.35810.360772
37-0.044216-0.33670.368765
38-0.076974-0.58620.280002
39-0.101464-0.77270.221411
40-0.164052-1.24940.108271
41-0.136292-1.0380.151796
42-0.007658-0.05830.476846
430.0182670.13910.444921
44-0.000816-0.00620.497532
45-0.03951-0.30090.382285
46-0.070053-0.53350.29786
47-0.045559-0.3470.364937
48-0.060577-0.46130.323139
49-0.053038-0.40390.343876
500.0053850.0410.483715
510.0047440.03610.485652
520.0143380.10920.456713
53-0.015728-0.11980.452536
54-0.017399-0.13250.447521
550.0046610.03550.485904
560.0061220.04660.481487
57-0.001776-0.01350.494627
58NANANA
59NANANA
60NANANA

\begin{tabular}{lllllllll}
\hline
Autocorrelation Function \tabularnewline
Time lag k & ACF(k) & T-STAT & P-value \tabularnewline
1 & 0.432801 & 3.2961 & 0.000838 \tabularnewline
2 & 0.218947 & 1.6675 & 0.050408 \tabularnewline
3 & 0.228143 & 1.7375 & 0.043804 \tabularnewline
4 & 0.125487 & 0.9557 & 0.1716 \tabularnewline
5 & 0.317488 & 2.4179 & 0.009386 \tabularnewline
6 & 0.269265 & 2.0507 & 0.022414 \tabularnewline
7 & 0.159606 & 1.2155 & 0.114545 \tabularnewline
8 & 0.325716 & 2.4806 & 0.00802 \tabularnewline
9 & 0.289088 & 2.2016 & 0.015841 \tabularnewline
10 & 0.174248 & 1.327 & 0.094849 \tabularnewline
11 & 0.137144 & 1.0445 & 0.150304 \tabularnewline
12 & -0.095574 & -0.7279 & 0.234811 \tabularnewline
13 & -0.063177 & -0.4811 & 0.316114 \tabularnewline
14 & 0.056698 & 0.4318 & 0.333745 \tabularnewline
15 & 0.056488 & 0.4302 & 0.334323 \tabularnewline
16 & 0.052314 & 0.3984 & 0.345893 \tabularnewline
17 & 0.042127 & 0.3208 & 0.374745 \tabularnewline
18 & -0.01853 & -0.1411 & 0.444132 \tabularnewline
19 & -0.054033 & -0.4115 & 0.341111 \tabularnewline
20 & 0.03981 & 0.3032 & 0.381418 \tabularnewline
21 & -0.071795 & -0.5468 & 0.293317 \tabularnewline
22 & -0.157764 & -1.2015 & 0.117221 \tabularnewline
23 & -0.162336 & -1.2363 & 0.110663 \tabularnewline
24 & -0.25214 & -1.9202 & 0.029875 \tabularnewline
25 & -0.143935 & -1.0962 & 0.138765 \tabularnewline
26 & -0.100827 & -0.7679 & 0.222837 \tabularnewline
27 & -0.167324 & -1.2743 & 0.103819 \tabularnewline
28 & -0.124997 & -0.952 & 0.172536 \tabularnewline
29 & -0.106652 & -0.8122 & 0.209988 \tabularnewline
30 & -0.213134 & -1.6232 & 0.054987 \tabularnewline
31 & -0.213918 & -1.6292 & 0.05435 \tabularnewline
32 & -0.302277 & -2.3021 & 0.01247 \tabularnewline
33 & -0.191729 & -1.4602 & 0.07482 \tabularnewline
34 & -0.078277 & -0.5961 & 0.276701 \tabularnewline
35 & -0.078331 & -0.5965 & 0.276565 \tabularnewline
36 & -0.047025 & -0.3581 & 0.360772 \tabularnewline
37 & -0.044216 & -0.3367 & 0.368765 \tabularnewline
38 & -0.076974 & -0.5862 & 0.280002 \tabularnewline
39 & -0.101464 & -0.7727 & 0.221411 \tabularnewline
40 & -0.164052 & -1.2494 & 0.108271 \tabularnewline
41 & -0.136292 & -1.038 & 0.151796 \tabularnewline
42 & -0.007658 & -0.0583 & 0.476846 \tabularnewline
43 & 0.018267 & 0.1391 & 0.444921 \tabularnewline
44 & -0.000816 & -0.0062 & 0.497532 \tabularnewline
45 & -0.03951 & -0.3009 & 0.382285 \tabularnewline
46 & -0.070053 & -0.5335 & 0.29786 \tabularnewline
47 & -0.045559 & -0.347 & 0.364937 \tabularnewline
48 & -0.060577 & -0.4613 & 0.323139 \tabularnewline
49 & -0.053038 & -0.4039 & 0.343876 \tabularnewline
50 & 0.005385 & 0.041 & 0.483715 \tabularnewline
51 & 0.004744 & 0.0361 & 0.485652 \tabularnewline
52 & 0.014338 & 0.1092 & 0.456713 \tabularnewline
53 & -0.015728 & -0.1198 & 0.452536 \tabularnewline
54 & -0.017399 & -0.1325 & 0.447521 \tabularnewline
55 & 0.004661 & 0.0355 & 0.485904 \tabularnewline
56 & 0.006122 & 0.0466 & 0.481487 \tabularnewline
57 & -0.001776 & -0.0135 & 0.494627 \tabularnewline
58 & NA & NA & NA \tabularnewline
59 & NA & NA & NA \tabularnewline
60 & NA & NA & NA \tabularnewline
\hline
\end{tabular}
%Source: https://freestatistics.org/blog/index.php?pk=68558&T=1

[TABLE]
[ROW][C]Autocorrelation Function[/C][/ROW]
[ROW][C]Time lag k[/C][C]ACF(k)[/C][C]T-STAT[/C][C]P-value[/C][/ROW]
[ROW][C]1[/C][C]0.432801[/C][C]3.2961[/C][C]0.000838[/C][/ROW]
[ROW][C]2[/C][C]0.218947[/C][C]1.6675[/C][C]0.050408[/C][/ROW]
[ROW][C]3[/C][C]0.228143[/C][C]1.7375[/C][C]0.043804[/C][/ROW]
[ROW][C]4[/C][C]0.125487[/C][C]0.9557[/C][C]0.1716[/C][/ROW]
[ROW][C]5[/C][C]0.317488[/C][C]2.4179[/C][C]0.009386[/C][/ROW]
[ROW][C]6[/C][C]0.269265[/C][C]2.0507[/C][C]0.022414[/C][/ROW]
[ROW][C]7[/C][C]0.159606[/C][C]1.2155[/C][C]0.114545[/C][/ROW]
[ROW][C]8[/C][C]0.325716[/C][C]2.4806[/C][C]0.00802[/C][/ROW]
[ROW][C]9[/C][C]0.289088[/C][C]2.2016[/C][C]0.015841[/C][/ROW]
[ROW][C]10[/C][C]0.174248[/C][C]1.327[/C][C]0.094849[/C][/ROW]
[ROW][C]11[/C][C]0.137144[/C][C]1.0445[/C][C]0.150304[/C][/ROW]
[ROW][C]12[/C][C]-0.095574[/C][C]-0.7279[/C][C]0.234811[/C][/ROW]
[ROW][C]13[/C][C]-0.063177[/C][C]-0.4811[/C][C]0.316114[/C][/ROW]
[ROW][C]14[/C][C]0.056698[/C][C]0.4318[/C][C]0.333745[/C][/ROW]
[ROW][C]15[/C][C]0.056488[/C][C]0.4302[/C][C]0.334323[/C][/ROW]
[ROW][C]16[/C][C]0.052314[/C][C]0.3984[/C][C]0.345893[/C][/ROW]
[ROW][C]17[/C][C]0.042127[/C][C]0.3208[/C][C]0.374745[/C][/ROW]
[ROW][C]18[/C][C]-0.01853[/C][C]-0.1411[/C][C]0.444132[/C][/ROW]
[ROW][C]19[/C][C]-0.054033[/C][C]-0.4115[/C][C]0.341111[/C][/ROW]
[ROW][C]20[/C][C]0.03981[/C][C]0.3032[/C][C]0.381418[/C][/ROW]
[ROW][C]21[/C][C]-0.071795[/C][C]-0.5468[/C][C]0.293317[/C][/ROW]
[ROW][C]22[/C][C]-0.157764[/C][C]-1.2015[/C][C]0.117221[/C][/ROW]
[ROW][C]23[/C][C]-0.162336[/C][C]-1.2363[/C][C]0.110663[/C][/ROW]
[ROW][C]24[/C][C]-0.25214[/C][C]-1.9202[/C][C]0.029875[/C][/ROW]
[ROW][C]25[/C][C]-0.143935[/C][C]-1.0962[/C][C]0.138765[/C][/ROW]
[ROW][C]26[/C][C]-0.100827[/C][C]-0.7679[/C][C]0.222837[/C][/ROW]
[ROW][C]27[/C][C]-0.167324[/C][C]-1.2743[/C][C]0.103819[/C][/ROW]
[ROW][C]28[/C][C]-0.124997[/C][C]-0.952[/C][C]0.172536[/C][/ROW]
[ROW][C]29[/C][C]-0.106652[/C][C]-0.8122[/C][C]0.209988[/C][/ROW]
[ROW][C]30[/C][C]-0.213134[/C][C]-1.6232[/C][C]0.054987[/C][/ROW]
[ROW][C]31[/C][C]-0.213918[/C][C]-1.6292[/C][C]0.05435[/C][/ROW]
[ROW][C]32[/C][C]-0.302277[/C][C]-2.3021[/C][C]0.01247[/C][/ROW]
[ROW][C]33[/C][C]-0.191729[/C][C]-1.4602[/C][C]0.07482[/C][/ROW]
[ROW][C]34[/C][C]-0.078277[/C][C]-0.5961[/C][C]0.276701[/C][/ROW]
[ROW][C]35[/C][C]-0.078331[/C][C]-0.5965[/C][C]0.276565[/C][/ROW]
[ROW][C]36[/C][C]-0.047025[/C][C]-0.3581[/C][C]0.360772[/C][/ROW]
[ROW][C]37[/C][C]-0.044216[/C][C]-0.3367[/C][C]0.368765[/C][/ROW]
[ROW][C]38[/C][C]-0.076974[/C][C]-0.5862[/C][C]0.280002[/C][/ROW]
[ROW][C]39[/C][C]-0.101464[/C][C]-0.7727[/C][C]0.221411[/C][/ROW]
[ROW][C]40[/C][C]-0.164052[/C][C]-1.2494[/C][C]0.108271[/C][/ROW]
[ROW][C]41[/C][C]-0.136292[/C][C]-1.038[/C][C]0.151796[/C][/ROW]
[ROW][C]42[/C][C]-0.007658[/C][C]-0.0583[/C][C]0.476846[/C][/ROW]
[ROW][C]43[/C][C]0.018267[/C][C]0.1391[/C][C]0.444921[/C][/ROW]
[ROW][C]44[/C][C]-0.000816[/C][C]-0.0062[/C][C]0.497532[/C][/ROW]
[ROW][C]45[/C][C]-0.03951[/C][C]-0.3009[/C][C]0.382285[/C][/ROW]
[ROW][C]46[/C][C]-0.070053[/C][C]-0.5335[/C][C]0.29786[/C][/ROW]
[ROW][C]47[/C][C]-0.045559[/C][C]-0.347[/C][C]0.364937[/C][/ROW]
[ROW][C]48[/C][C]-0.060577[/C][C]-0.4613[/C][C]0.323139[/C][/ROW]
[ROW][C]49[/C][C]-0.053038[/C][C]-0.4039[/C][C]0.343876[/C][/ROW]
[ROW][C]50[/C][C]0.005385[/C][C]0.041[/C][C]0.483715[/C][/ROW]
[ROW][C]51[/C][C]0.004744[/C][C]0.0361[/C][C]0.485652[/C][/ROW]
[ROW][C]52[/C][C]0.014338[/C][C]0.1092[/C][C]0.456713[/C][/ROW]
[ROW][C]53[/C][C]-0.015728[/C][C]-0.1198[/C][C]0.452536[/C][/ROW]
[ROW][C]54[/C][C]-0.017399[/C][C]-0.1325[/C][C]0.447521[/C][/ROW]
[ROW][C]55[/C][C]0.004661[/C][C]0.0355[/C][C]0.485904[/C][/ROW]
[ROW][C]56[/C][C]0.006122[/C][C]0.0466[/C][C]0.481487[/C][/ROW]
[ROW][C]57[/C][C]-0.001776[/C][C]-0.0135[/C][C]0.494627[/C][/ROW]
[ROW][C]58[/C][C]NA[/C][C]NA[/C][C]NA[/C][/ROW]
[ROW][C]59[/C][C]NA[/C][C]NA[/C][C]NA[/C][/ROW]
[ROW][C]60[/C][C]NA[/C][C]NA[/C][C]NA[/C][/ROW]
[/TABLE]
Source: https://freestatistics.org/blog/index.php?pk=68558&T=1

Globally Unique Identifier (entire table): ba.freestatistics.org/blog/index.php?pk=68558&T=1

As an alternative you can also use a QR Code:  

The GUIDs for individual cells are displayed in the table below:

Autocorrelation Function
Time lag kACF(k)T-STATP-value
10.4328013.29610.000838
20.2189471.66750.050408
30.2281431.73750.043804
40.1254870.95570.1716
50.3174882.41790.009386
60.2692652.05070.022414
70.1596061.21550.114545
80.3257162.48060.00802
90.2890882.20160.015841
100.1742481.3270.094849
110.1371441.04450.150304
12-0.095574-0.72790.234811
13-0.063177-0.48110.316114
140.0566980.43180.333745
150.0564880.43020.334323
160.0523140.39840.345893
170.0421270.32080.374745
18-0.01853-0.14110.444132
19-0.054033-0.41150.341111
200.039810.30320.381418
21-0.071795-0.54680.293317
22-0.157764-1.20150.117221
23-0.162336-1.23630.110663
24-0.25214-1.92020.029875
25-0.143935-1.09620.138765
26-0.100827-0.76790.222837
27-0.167324-1.27430.103819
28-0.124997-0.9520.172536
29-0.106652-0.81220.209988
30-0.213134-1.62320.054987
31-0.213918-1.62920.05435
32-0.302277-2.30210.01247
33-0.191729-1.46020.07482
34-0.078277-0.59610.276701
35-0.078331-0.59650.276565
36-0.047025-0.35810.360772
37-0.044216-0.33670.368765
38-0.076974-0.58620.280002
39-0.101464-0.77270.221411
40-0.164052-1.24940.108271
41-0.136292-1.0380.151796
42-0.007658-0.05830.476846
430.0182670.13910.444921
44-0.000816-0.00620.497532
45-0.03951-0.30090.382285
46-0.070053-0.53350.29786
47-0.045559-0.3470.364937
48-0.060577-0.46130.323139
49-0.053038-0.40390.343876
500.0053850.0410.483715
510.0047440.03610.485652
520.0143380.10920.456713
53-0.015728-0.11980.452536
54-0.017399-0.13250.447521
550.0046610.03550.485904
560.0061220.04660.481487
57-0.001776-0.01350.494627
58NANANA
59NANANA
60NANANA


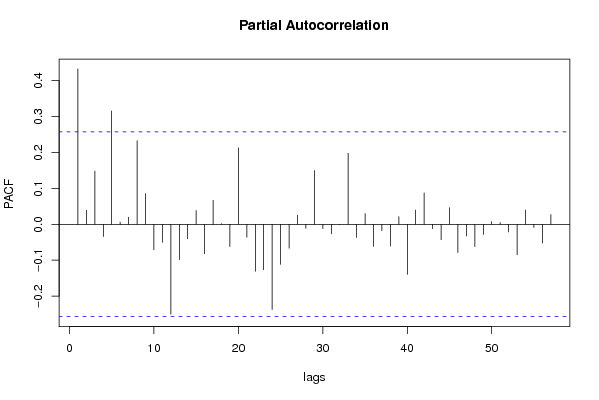
Partial Autocorrelation Function
Time lag kPACF(k)T-STATP-value
10.4328013.29610.000838
20.0389220.29640.383985
30.1481611.12840.131907
4-0.034332-0.26150.397331
50.3154652.40250.009752
60.0060430.0460.481726
70.0197660.15050.440434
80.2330891.77520.04056
90.0856990.65270.258275
10-0.070773-0.5390.295978
11-0.050391-0.38380.351276
12-0.250348-1.90660.030766
13-0.098203-0.74790.228774
14-0.040549-0.30880.379284
150.0381280.29040.386284
16-0.081923-0.62390.267567
170.0666740.50780.30677
180.0015680.01190.495258
19-0.061575-0.46890.320434
200.2131531.62330.054971
21-0.036097-0.27490.392182
22-0.130658-0.99510.161919
23-0.126955-0.96690.168814
24-0.237355-1.80760.037924
25-0.111384-0.84830.199887
26-0.066756-0.50840.306551
270.0254290.19370.42356
28-0.011119-0.08470.466403
290.1495081.13860.129772
30-0.012059-0.09180.463572
31-0.026687-0.20320.41983
32-0.000875-0.00670.497352
330.1976331.50510.068859
34-0.036584-0.27860.390766
350.0298120.2270.410595
36-0.061619-0.46930.320315
37-0.018042-0.13740.445595
38-0.060771-0.46280.322613
390.0210220.16010.43668
40-0.139592-1.06310.146071
410.0396310.30180.381933
420.0873960.66560.254156
43-0.012274-0.09350.462923
44-0.042774-0.32580.372891
450.0461030.35110.363388
46-0.078714-0.59950.275597
47-0.032568-0.2480.402493
48-0.062107-0.4730.318996
49-0.028715-0.21870.413831
500.0076220.0580.476957
510.0047350.03610.485677
52-0.021492-0.16370.435276
53-0.085096-0.64810.259749
540.039690.30230.381764
55-0.008965-0.06830.4729
56-0.052141-0.39710.346377
570.0270130.20570.418864
58NANANA
59NANANA
60NANANA

\begin{tabular}{lllllllll}
\hline
Partial Autocorrelation Function \tabularnewline
Time lag k & PACF(k) & T-STAT & P-value \tabularnewline
1 & 0.432801 & 3.2961 & 0.000838 \tabularnewline
2 & 0.038922 & 0.2964 & 0.383985 \tabularnewline
3 & 0.148161 & 1.1284 & 0.131907 \tabularnewline
4 & -0.034332 & -0.2615 & 0.397331 \tabularnewline
5 & 0.315465 & 2.4025 & 0.009752 \tabularnewline
6 & 0.006043 & 0.046 & 0.481726 \tabularnewline
7 & 0.019766 & 0.1505 & 0.440434 \tabularnewline
8 & 0.233089 & 1.7752 & 0.04056 \tabularnewline
9 & 0.085699 & 0.6527 & 0.258275 \tabularnewline
10 & -0.070773 & -0.539 & 0.295978 \tabularnewline
11 & -0.050391 & -0.3838 & 0.351276 \tabularnewline
12 & -0.250348 & -1.9066 & 0.030766 \tabularnewline
13 & -0.098203 & -0.7479 & 0.228774 \tabularnewline
14 & -0.040549 & -0.3088 & 0.379284 \tabularnewline
15 & 0.038128 & 0.2904 & 0.386284 \tabularnewline
16 & -0.081923 & -0.6239 & 0.267567 \tabularnewline
17 & 0.066674 & 0.5078 & 0.30677 \tabularnewline
18 & 0.001568 & 0.0119 & 0.495258 \tabularnewline
19 & -0.061575 & -0.4689 & 0.320434 \tabularnewline
20 & 0.213153 & 1.6233 & 0.054971 \tabularnewline
21 & -0.036097 & -0.2749 & 0.392182 \tabularnewline
22 & -0.130658 & -0.9951 & 0.161919 \tabularnewline
23 & -0.126955 & -0.9669 & 0.168814 \tabularnewline
24 & -0.237355 & -1.8076 & 0.037924 \tabularnewline
25 & -0.111384 & -0.8483 & 0.199887 \tabularnewline
26 & -0.066756 & -0.5084 & 0.306551 \tabularnewline
27 & 0.025429 & 0.1937 & 0.42356 \tabularnewline
28 & -0.011119 & -0.0847 & 0.466403 \tabularnewline
29 & 0.149508 & 1.1386 & 0.129772 \tabularnewline
30 & -0.012059 & -0.0918 & 0.463572 \tabularnewline
31 & -0.026687 & -0.2032 & 0.41983 \tabularnewline
32 & -0.000875 & -0.0067 & 0.497352 \tabularnewline
33 & 0.197633 & 1.5051 & 0.068859 \tabularnewline
34 & -0.036584 & -0.2786 & 0.390766 \tabularnewline
35 & 0.029812 & 0.227 & 0.410595 \tabularnewline
36 & -0.061619 & -0.4693 & 0.320315 \tabularnewline
37 & -0.018042 & -0.1374 & 0.445595 \tabularnewline
38 & -0.060771 & -0.4628 & 0.322613 \tabularnewline
39 & 0.021022 & 0.1601 & 0.43668 \tabularnewline
40 & -0.139592 & -1.0631 & 0.146071 \tabularnewline
41 & 0.039631 & 0.3018 & 0.381933 \tabularnewline
42 & 0.087396 & 0.6656 & 0.254156 \tabularnewline
43 & -0.012274 & -0.0935 & 0.462923 \tabularnewline
44 & -0.042774 & -0.3258 & 0.372891 \tabularnewline
45 & 0.046103 & 0.3511 & 0.363388 \tabularnewline
46 & -0.078714 & -0.5995 & 0.275597 \tabularnewline
47 & -0.032568 & -0.248 & 0.402493 \tabularnewline
48 & -0.062107 & -0.473 & 0.318996 \tabularnewline
49 & -0.028715 & -0.2187 & 0.413831 \tabularnewline
50 & 0.007622 & 0.058 & 0.476957 \tabularnewline
51 & 0.004735 & 0.0361 & 0.485677 \tabularnewline
52 & -0.021492 & -0.1637 & 0.435276 \tabularnewline
53 & -0.085096 & -0.6481 & 0.259749 \tabularnewline
54 & 0.03969 & 0.3023 & 0.381764 \tabularnewline
55 & -0.008965 & -0.0683 & 0.4729 \tabularnewline
56 & -0.052141 & -0.3971 & 0.346377 \tabularnewline
57 & 0.027013 & 0.2057 & 0.418864 \tabularnewline
58 & NA & NA & NA \tabularnewline
59 & NA & NA & NA \tabularnewline
60 & NA & NA & NA \tabularnewline
\hline
\end{tabular}
%Source: https://freestatistics.org/blog/index.php?pk=68558&T=2

[TABLE]
[ROW][C]Partial Autocorrelation Function[/C][/ROW]
[ROW][C]Time lag k[/C][C]PACF(k)[/C][C]T-STAT[/C][C]P-value[/C][/ROW]
[ROW][C]1[/C][C]0.432801[/C][C]3.2961[/C][C]0.000838[/C][/ROW]
[ROW][C]2[/C][C]0.038922[/C][C]0.2964[/C][C]0.383985[/C][/ROW]
[ROW][C]3[/C][C]0.148161[/C][C]1.1284[/C][C]0.131907[/C][/ROW]
[ROW][C]4[/C][C]-0.034332[/C][C]-0.2615[/C][C]0.397331[/C][/ROW]
[ROW][C]5[/C][C]0.315465[/C][C]2.4025[/C][C]0.009752[/C][/ROW]
[ROW][C]6[/C][C]0.006043[/C][C]0.046[/C][C]0.481726[/C][/ROW]
[ROW][C]7[/C][C]0.019766[/C][C]0.1505[/C][C]0.440434[/C][/ROW]
[ROW][C]8[/C][C]0.233089[/C][C]1.7752[/C][C]0.04056[/C][/ROW]
[ROW][C]9[/C][C]0.085699[/C][C]0.6527[/C][C]0.258275[/C][/ROW]
[ROW][C]10[/C][C]-0.070773[/C][C]-0.539[/C][C]0.295978[/C][/ROW]
[ROW][C]11[/C][C]-0.050391[/C][C]-0.3838[/C][C]0.351276[/C][/ROW]
[ROW][C]12[/C][C]-0.250348[/C][C]-1.9066[/C][C]0.030766[/C][/ROW]
[ROW][C]13[/C][C]-0.098203[/C][C]-0.7479[/C][C]0.228774[/C][/ROW]
[ROW][C]14[/C][C]-0.040549[/C][C]-0.3088[/C][C]0.379284[/C][/ROW]
[ROW][C]15[/C][C]0.038128[/C][C]0.2904[/C][C]0.386284[/C][/ROW]
[ROW][C]16[/C][C]-0.081923[/C][C]-0.6239[/C][C]0.267567[/C][/ROW]
[ROW][C]17[/C][C]0.066674[/C][C]0.5078[/C][C]0.30677[/C][/ROW]
[ROW][C]18[/C][C]0.001568[/C][C]0.0119[/C][C]0.495258[/C][/ROW]
[ROW][C]19[/C][C]-0.061575[/C][C]-0.4689[/C][C]0.320434[/C][/ROW]
[ROW][C]20[/C][C]0.213153[/C][C]1.6233[/C][C]0.054971[/C][/ROW]
[ROW][C]21[/C][C]-0.036097[/C][C]-0.2749[/C][C]0.392182[/C][/ROW]
[ROW][C]22[/C][C]-0.130658[/C][C]-0.9951[/C][C]0.161919[/C][/ROW]
[ROW][C]23[/C][C]-0.126955[/C][C]-0.9669[/C][C]0.168814[/C][/ROW]
[ROW][C]24[/C][C]-0.237355[/C][C]-1.8076[/C][C]0.037924[/C][/ROW]
[ROW][C]25[/C][C]-0.111384[/C][C]-0.8483[/C][C]0.199887[/C][/ROW]
[ROW][C]26[/C][C]-0.066756[/C][C]-0.5084[/C][C]0.306551[/C][/ROW]
[ROW][C]27[/C][C]0.025429[/C][C]0.1937[/C][C]0.42356[/C][/ROW]
[ROW][C]28[/C][C]-0.011119[/C][C]-0.0847[/C][C]0.466403[/C][/ROW]
[ROW][C]29[/C][C]0.149508[/C][C]1.1386[/C][C]0.129772[/C][/ROW]
[ROW][C]30[/C][C]-0.012059[/C][C]-0.0918[/C][C]0.463572[/C][/ROW]
[ROW][C]31[/C][C]-0.026687[/C][C]-0.2032[/C][C]0.41983[/C][/ROW]
[ROW][C]32[/C][C]-0.000875[/C][C]-0.0067[/C][C]0.497352[/C][/ROW]
[ROW][C]33[/C][C]0.197633[/C][C]1.5051[/C][C]0.068859[/C][/ROW]
[ROW][C]34[/C][C]-0.036584[/C][C]-0.2786[/C][C]0.390766[/C][/ROW]
[ROW][C]35[/C][C]0.029812[/C][C]0.227[/C][C]0.410595[/C][/ROW]
[ROW][C]36[/C][C]-0.061619[/C][C]-0.4693[/C][C]0.320315[/C][/ROW]
[ROW][C]37[/C][C]-0.018042[/C][C]-0.1374[/C][C]0.445595[/C][/ROW]
[ROW][C]38[/C][C]-0.060771[/C][C]-0.4628[/C][C]0.322613[/C][/ROW]
[ROW][C]39[/C][C]0.021022[/C][C]0.1601[/C][C]0.43668[/C][/ROW]
[ROW][C]40[/C][C]-0.139592[/C][C]-1.0631[/C][C]0.146071[/C][/ROW]
[ROW][C]41[/C][C]0.039631[/C][C]0.3018[/C][C]0.381933[/C][/ROW]
[ROW][C]42[/C][C]0.087396[/C][C]0.6656[/C][C]0.254156[/C][/ROW]
[ROW][C]43[/C][C]-0.012274[/C][C]-0.0935[/C][C]0.462923[/C][/ROW]
[ROW][C]44[/C][C]-0.042774[/C][C]-0.3258[/C][C]0.372891[/C][/ROW]
[ROW][C]45[/C][C]0.046103[/C][C]0.3511[/C][C]0.363388[/C][/ROW]
[ROW][C]46[/C][C]-0.078714[/C][C]-0.5995[/C][C]0.275597[/C][/ROW]
[ROW][C]47[/C][C]-0.032568[/C][C]-0.248[/C][C]0.402493[/C][/ROW]
[ROW][C]48[/C][C]-0.062107[/C][C]-0.473[/C][C]0.318996[/C][/ROW]
[ROW][C]49[/C][C]-0.028715[/C][C]-0.2187[/C][C]0.413831[/C][/ROW]
[ROW][C]50[/C][C]0.007622[/C][C]0.058[/C][C]0.476957[/C][/ROW]
[ROW][C]51[/C][C]0.004735[/C][C]0.0361[/C][C]0.485677[/C][/ROW]
[ROW][C]52[/C][C]-0.021492[/C][C]-0.1637[/C][C]0.435276[/C][/ROW]
[ROW][C]53[/C][C]-0.085096[/C][C]-0.6481[/C][C]0.259749[/C][/ROW]
[ROW][C]54[/C][C]0.03969[/C][C]0.3023[/C][C]0.381764[/C][/ROW]
[ROW][C]55[/C][C]-0.008965[/C][C]-0.0683[/C][C]0.4729[/C][/ROW]
[ROW][C]56[/C][C]-0.052141[/C][C]-0.3971[/C][C]0.346377[/C][/ROW]
[ROW][C]57[/C][C]0.027013[/C][C]0.2057[/C][C]0.418864[/C][/ROW]
[ROW][C]58[/C][C]NA[/C][C]NA[/C][C]NA[/C][/ROW]
[ROW][C]59[/C][C]NA[/C][C]NA[/C][C]NA[/C][/ROW]
[ROW][C]60[/C][C]NA[/C][C]NA[/C][C]NA[/C][/ROW]
[/TABLE]
Source: https://freestatistics.org/blog/index.php?pk=68558&T=2

Globally Unique Identifier (entire table): ba.freestatistics.org/blog/index.php?pk=68558&T=2

As an alternative you can also use a QR Code:  

The GUIDs for individual cells are displayed in the table below:

Partial Autocorrelation Function
Time lag kPACF(k)T-STATP-value
10.4328013.29610.000838
20.0389220.29640.383985
30.1481611.12840.131907
4-0.034332-0.26150.397331
50.3154652.40250.009752
60.0060430.0460.481726
70.0197660.15050.440434
80.2330891.77520.04056
90.0856990.65270.258275
10-0.070773-0.5390.295978
11-0.050391-0.38380.351276
12-0.250348-1.90660.030766
13-0.098203-0.74790.228774
14-0.040549-0.30880.379284
150.0381280.29040.386284
16-0.081923-0.62390.267567
170.0666740.50780.30677
180.0015680.01190.495258
19-0.061575-0.46890.320434
200.2131531.62330.054971
21-0.036097-0.27490.392182
22-0.130658-0.99510.161919
23-0.126955-0.96690.168814
24-0.237355-1.80760.037924
25-0.111384-0.84830.199887
26-0.066756-0.50840.306551
270.0254290.19370.42356
28-0.011119-0.08470.466403
290.1495081.13860.129772
30-0.012059-0.09180.463572
31-0.026687-0.20320.41983
32-0.000875-0.00670.497352
330.1976331.50510.068859
34-0.036584-0.27860.390766
350.0298120.2270.410595
36-0.061619-0.46930.320315
37-0.018042-0.13740.445595
38-0.060771-0.46280.322613
390.0210220.16010.43668
40-0.139592-1.06310.146071
410.0396310.30180.381933
420.0873960.66560.254156
43-0.012274-0.09350.462923
44-0.042774-0.32580.372891
450.0461030.35110.363388
46-0.078714-0.59950.275597
47-0.032568-0.2480.402493
48-0.062107-0.4730.318996
49-0.028715-0.21870.413831
500.0076220.0580.476957
510.0047350.03610.485677
52-0.021492-0.16370.435276
53-0.085096-0.64810.259749
540.039690.30230.381764
55-0.008965-0.06830.4729
56-0.052141-0.39710.346377
570.0270130.20570.418864
58NANANA
59NANANA
60NANANA


Parameters (Session):
par1 = FALSE ; par2 = 1 ; par3 = 2 ; par4 = 0 ; par5 = 12 ; par6 = 3 ; par7 = 1 ; par8 = 2 ; par9 = 1 ;
Parameters (R input):
par1 = 60 ; par2 = -0.5 ; par3 = 0 ; par4 = 1 ; par5 = 12 ; par6 = White Noise ; par7 = 0.95 ;
R code (references can be found in the software module):
if (par1 == 'Default') {
par1 = 10*log10(length(x))
} else {
par1 <- as.numeric(par1)
}
par2 <- as.numeric(par2)
par3 <- as.numeric(par3)
par4 <- as.numeric(par4)
par5 <- as.numeric(par5)
if (par6 == 'White Noise') par6 <- 'white' else par6 <- 'ma'
par7 <- as.numeric(par7)
if (par2 == 0) {
x <- log(x)
} else {
x <- (x ^ par2 - 1) / par2
}
if (par3 > 0) x <- diff(x,lag=1,difference=par3)
if (par4 > 0) x <- diff(x,lag=par5,difference=par4)
bitmap(file='pic1.png')
racf <- acf(x, par1, main='Autocorrelation', xlab='time lag', ylab='ACF', ci.type=par6, ci=par7, sub=paste('(lambda=',par2,', d=',par3,', D=',par4,', CI=', par7, ', CI type=',par6,')',sep=''))
dev.off()
bitmap(file='pic2.png')
rpacf <- pacf(x,par1,main='Partial Autocorrelation',xlab='lags',ylab='PACF')
dev.off()
(myacf <- c(racf$acf))
(mypacf <- c(rpacf$acf))
lengthx <- length(x)
sqrtn <- sqrt(lengthx)
load(file='createtable')
a<-table.start()
a<-table.row.start(a)
a<-table.element(a,'Autocorrelation Function',4,TRUE)
a<-table.row.end(a)
a<-table.row.start(a)
a<-table.element(a,'Time lag k',header=TRUE)
a<-table.element(a,hyperlink('basics.htm','ACF(k)','click here for more information about the Autocorrelation Function'),header=TRUE)
a<-table.element(a,'T-STAT',header=TRUE)
a<-table.element(a,'P-value',header=TRUE)
a<-table.row.end(a)
for (i in 2:(par1+1)) {
a<-table.row.start(a)
a<-table.element(a,i-1,header=TRUE)
a<-table.element(a,round(myacf[i],6))
mytstat <- myacf[i]*sqrtn
a<-table.element(a,round(mytstat,4))
a<-table.element(a,round(1-pt(abs(mytstat),lengthx),6))
a<-table.row.end(a)
}
a<-table.end(a)
table.save(a,file='mytable.tab')
a<-table.start()
a<-table.row.start(a)
a<-table.element(a,'Partial Autocorrelation Function',4,TRUE)
a<-table.row.end(a)
a<-table.row.start(a)
a<-table.element(a,'Time lag k',header=TRUE)
a<-table.element(a,hyperlink('basics.htm','PACF(k)','click here for more information about the Partial Autocorrelation Function'),header=TRUE)
a<-table.element(a,'T-STAT',header=TRUE)
a<-table.element(a,'P-value',header=TRUE)
a<-table.row.end(a)
for (i in 1:par1) {
a<-table.row.start(a)
a<-table.element(a,i,header=TRUE)
a<-table.element(a,round(mypacf[i],6))
mytstat <- mypacf[i]*sqrtn
a<-table.element(a,round(mytstat,4))
a<-table.element(a,round(1-pt(abs(mytstat),lengthx),6))
a<-table.row.end(a)
}
a<-table.end(a)
table.save(a,file='mytable1.tab')