Free Statistics

of Irreproducible Research!

Author's title

Author*Unverified author*
R Software Modulerwasp_autocorrelation.wasp
Title produced by software(Partial) Autocorrelation Function
Date of computationWed, 16 Dec 2009 12:04:29 -0700
Cite this page as followsStatistical Computations at FreeStatistics.org, Office for Research Development and Education, URL https://freestatistics.org/blog/index.php?v=date/2009/Dec/16/t1260990409ctlkielqrkadkqu.htm/, Retrieved Tue, 30 Apr 2024 17:54:35 +0000
Statistical Computations at FreeStatistics.org, Office for Research Development and Education, URL https://freestatistics.org/blog/index.php?pk=68543, Retrieved Tue, 30 Apr 2024 17:54:35 +0000
QR Codes:

Original text written by user:
IsPrivate?No (this computation is public)
User-defined keywordsKDGP2W21
Estimated Impact109
Family? (F = Feedback message, R = changed R code, M = changed R Module, P = changed Parameters, D = changed Data)
-       [(Partial) Autocorrelation Function] [autocorralation a...] [2009-12-16 19:04:29] [8dade33360a3d9627a19ab7d33b79ad8] [Current]
Feedback Forum

Post a new message
Dataseries X:
 2357402 
 2199181 
 2603060 
 2629720 
 2638792 
 2717481 
 3810804 
 3871664 
 2998364 
 2923432 
 2712359 
 2996099 
 2395029 
 2483862 
 3120231 
 3360606 
 3177203 
 3062783 
 4242509 
 4026394 
 3192481 
 3118695 
 2782482 
 3209833 
 2630190 
 2592882 
 3785309 
 3231539 
 3421369 
 3312134 
 4647303 
 4289177 
 3463853 
 3304422 
 3006121 
 3464238 
 2921118 
 2624018 
 3500718 
 3939351 
 3467672 
 3343628 
 4852445 
 4597807 
 3653145 
 3572079 
 3334861 
 3695369 
 3075704 
 2852998 
 3942704 
 4004560 
 3822145 
 3760085 
 5267816 
 5271333 
 4144142 
 4109749 
 3896808 
 4211074 
 3402318 
 3279817 
 4706628 
 4079499 
 4344530 
 4048625 
 5394915 
 5611967 
 4145481 
 4025610 
 3552218 
 3910443 


Summary of computational transaction
Raw Inputview raw input (R code)
Raw Outputview raw output of R engine
Computing time1 seconds
R Server'Gwilym Jenkins' @ 72.249.127.135

\begin{tabular}{lllllllll}
\hline
Summary of computational transaction \tabularnewline
Raw Input & view raw input (R code)  \tabularnewline
Raw Output & view raw output of R engine  \tabularnewline
Computing time & 1 seconds \tabularnewline
R Server & 'Gwilym Jenkins' @ 72.249.127.135 \tabularnewline
\hline
\end{tabular}
%Source: https://freestatistics.org/blog/index.php?pk=68543&T=0

[TABLE]
[ROW][C]Summary of computational transaction[/C][/ROW]
[ROW][C]Raw Input[/C][C]view raw input (R code) [/C][/ROW]
[ROW][C]Raw Output[/C][C]view raw output of R engine [/C][/ROW]
[ROW][C]Computing time[/C][C]1 seconds[/C][/ROW]
[ROW][C]R Server[/C][C]'Gwilym Jenkins' @ 72.249.127.135[/C][/ROW]
[/TABLE]
Source: https://freestatistics.org/blog/index.php?pk=68543&T=0

Globally Unique Identifier (entire table): ba.freestatistics.org/blog/index.php?pk=68543&T=0

As an alternative you can also use a QR Code:  

The GUIDs for individual cells are displayed in the table below:

Summary of computational transaction
Raw Inputview raw input (R code)
Raw Outputview raw output of R engine
Computing time1 seconds
R Server'Gwilym Jenkins' @ 72.249.127.135


Autocorrelation Function
Time lag kACF(k)T-STATP-value
10.6310165.35430
20.3635283.08460.001445
30.3427042.90790.002417
40.3293872.79490.003325
50.131661.11720.133818
6-0.142909-1.21260.114619
70.1042740.88480.189605
80.2874292.43890.008599
90.2692722.28480.012635
100.2437352.06820.021109
110.4231843.59080.000299
120.6692455.67870
130.3742953.1760.001099
140.1252361.06270.145744
150.1184931.00540.159024
160.1075940.9130.182154
17-0.053875-0.45710.324473
18-0.269393-2.28590.012603
19-0.067831-0.57560.283351
200.0834160.70780.240673
210.0559290.47460.318264
220.0472570.4010.344809
230.1874241.59030.058069
240.390383.31250.000724
250.1678461.42420.079351
26-0.030265-0.25680.399031
27-0.023996-0.20360.419614
28-0.036552-0.31020.378671
29-0.155473-1.31920.095636
30-0.327202-2.77640.0035
31-0.171495-1.45520.074982
32-0.04095-0.34750.364625
33-0.055532-0.47120.31946
34-0.062747-0.53240.298034
350.0284910.24180.40483
360.1995231.6930.047388
370.0345150.29290.385233
38-0.119433-1.01340.157125
39-0.134397-1.14040.128951
40-0.137749-1.16880.123162
41-0.209089-1.77420.040131
42-0.348697-2.95880.002089
43-0.225753-1.91560.029695
44-0.135407-1.1490.127186
45-0.146271-1.24110.10929
46-0.138842-1.17810.121315
47-0.073626-0.62470.26706
480.0242860.20610.418657

\begin{tabular}{lllllllll}
\hline
Autocorrelation Function \tabularnewline
Time lag k & ACF(k) & T-STAT & P-value \tabularnewline
1 & 0.631016 & 5.3543 & 0 \tabularnewline
2 & 0.363528 & 3.0846 & 0.001445 \tabularnewline
3 & 0.342704 & 2.9079 & 0.002417 \tabularnewline
4 & 0.329387 & 2.7949 & 0.003325 \tabularnewline
5 & 0.13166 & 1.1172 & 0.133818 \tabularnewline
6 & -0.142909 & -1.2126 & 0.114619 \tabularnewline
7 & 0.104274 & 0.8848 & 0.189605 \tabularnewline
8 & 0.287429 & 2.4389 & 0.008599 \tabularnewline
9 & 0.269272 & 2.2848 & 0.012635 \tabularnewline
10 & 0.243735 & 2.0682 & 0.021109 \tabularnewline
11 & 0.423184 & 3.5908 & 0.000299 \tabularnewline
12 & 0.669245 & 5.6787 & 0 \tabularnewline
13 & 0.374295 & 3.176 & 0.001099 \tabularnewline
14 & 0.125236 & 1.0627 & 0.145744 \tabularnewline
15 & 0.118493 & 1.0054 & 0.159024 \tabularnewline
16 & 0.107594 & 0.913 & 0.182154 \tabularnewline
17 & -0.053875 & -0.4571 & 0.324473 \tabularnewline
18 & -0.269393 & -2.2859 & 0.012603 \tabularnewline
19 & -0.067831 & -0.5756 & 0.283351 \tabularnewline
20 & 0.083416 & 0.7078 & 0.240673 \tabularnewline
21 & 0.055929 & 0.4746 & 0.318264 \tabularnewline
22 & 0.047257 & 0.401 & 0.344809 \tabularnewline
23 & 0.187424 & 1.5903 & 0.058069 \tabularnewline
24 & 0.39038 & 3.3125 & 0.000724 \tabularnewline
25 & 0.167846 & 1.4242 & 0.079351 \tabularnewline
26 & -0.030265 & -0.2568 & 0.399031 \tabularnewline
27 & -0.023996 & -0.2036 & 0.419614 \tabularnewline
28 & -0.036552 & -0.3102 & 0.378671 \tabularnewline
29 & -0.155473 & -1.3192 & 0.095636 \tabularnewline
30 & -0.327202 & -2.7764 & 0.0035 \tabularnewline
31 & -0.171495 & -1.4552 & 0.074982 \tabularnewline
32 & -0.04095 & -0.3475 & 0.364625 \tabularnewline
33 & -0.055532 & -0.4712 & 0.31946 \tabularnewline
34 & -0.062747 & -0.5324 & 0.298034 \tabularnewline
35 & 0.028491 & 0.2418 & 0.40483 \tabularnewline
36 & 0.199523 & 1.693 & 0.047388 \tabularnewline
37 & 0.034515 & 0.2929 & 0.385233 \tabularnewline
38 & -0.119433 & -1.0134 & 0.157125 \tabularnewline
39 & -0.134397 & -1.1404 & 0.128951 \tabularnewline
40 & -0.137749 & -1.1688 & 0.123162 \tabularnewline
41 & -0.209089 & -1.7742 & 0.040131 \tabularnewline
42 & -0.348697 & -2.9588 & 0.002089 \tabularnewline
43 & -0.225753 & -1.9156 & 0.029695 \tabularnewline
44 & -0.135407 & -1.149 & 0.127186 \tabularnewline
45 & -0.146271 & -1.2411 & 0.10929 \tabularnewline
46 & -0.138842 & -1.1781 & 0.121315 \tabularnewline
47 & -0.073626 & -0.6247 & 0.26706 \tabularnewline
48 & 0.024286 & 0.2061 & 0.418657 \tabularnewline
\hline
\end{tabular}
%Source: https://freestatistics.org/blog/index.php?pk=68543&T=1

[TABLE]
[ROW][C]Autocorrelation Function[/C][/ROW]
[ROW][C]Time lag k[/C][C]ACF(k)[/C][C]T-STAT[/C][C]P-value[/C][/ROW]
[ROW][C]1[/C][C]0.631016[/C][C]5.3543[/C][C]0[/C][/ROW]
[ROW][C]2[/C][C]0.363528[/C][C]3.0846[/C][C]0.001445[/C][/ROW]
[ROW][C]3[/C][C]0.342704[/C][C]2.9079[/C][C]0.002417[/C][/ROW]
[ROW][C]4[/C][C]0.329387[/C][C]2.7949[/C][C]0.003325[/C][/ROW]
[ROW][C]5[/C][C]0.13166[/C][C]1.1172[/C][C]0.133818[/C][/ROW]
[ROW][C]6[/C][C]-0.142909[/C][C]-1.2126[/C][C]0.114619[/C][/ROW]
[ROW][C]7[/C][C]0.104274[/C][C]0.8848[/C][C]0.189605[/C][/ROW]
[ROW][C]8[/C][C]0.287429[/C][C]2.4389[/C][C]0.008599[/C][/ROW]
[ROW][C]9[/C][C]0.269272[/C][C]2.2848[/C][C]0.012635[/C][/ROW]
[ROW][C]10[/C][C]0.243735[/C][C]2.0682[/C][C]0.021109[/C][/ROW]
[ROW][C]11[/C][C]0.423184[/C][C]3.5908[/C][C]0.000299[/C][/ROW]
[ROW][C]12[/C][C]0.669245[/C][C]5.6787[/C][C]0[/C][/ROW]
[ROW][C]13[/C][C]0.374295[/C][C]3.176[/C][C]0.001099[/C][/ROW]
[ROW][C]14[/C][C]0.125236[/C][C]1.0627[/C][C]0.145744[/C][/ROW]
[ROW][C]15[/C][C]0.118493[/C][C]1.0054[/C][C]0.159024[/C][/ROW]
[ROW][C]16[/C][C]0.107594[/C][C]0.913[/C][C]0.182154[/C][/ROW]
[ROW][C]17[/C][C]-0.053875[/C][C]-0.4571[/C][C]0.324473[/C][/ROW]
[ROW][C]18[/C][C]-0.269393[/C][C]-2.2859[/C][C]0.012603[/C][/ROW]
[ROW][C]19[/C][C]-0.067831[/C][C]-0.5756[/C][C]0.283351[/C][/ROW]
[ROW][C]20[/C][C]0.083416[/C][C]0.7078[/C][C]0.240673[/C][/ROW]
[ROW][C]21[/C][C]0.055929[/C][C]0.4746[/C][C]0.318264[/C][/ROW]
[ROW][C]22[/C][C]0.047257[/C][C]0.401[/C][C]0.344809[/C][/ROW]
[ROW][C]23[/C][C]0.187424[/C][C]1.5903[/C][C]0.058069[/C][/ROW]
[ROW][C]24[/C][C]0.39038[/C][C]3.3125[/C][C]0.000724[/C][/ROW]
[ROW][C]25[/C][C]0.167846[/C][C]1.4242[/C][C]0.079351[/C][/ROW]
[ROW][C]26[/C][C]-0.030265[/C][C]-0.2568[/C][C]0.399031[/C][/ROW]
[ROW][C]27[/C][C]-0.023996[/C][C]-0.2036[/C][C]0.419614[/C][/ROW]
[ROW][C]28[/C][C]-0.036552[/C][C]-0.3102[/C][C]0.378671[/C][/ROW]
[ROW][C]29[/C][C]-0.155473[/C][C]-1.3192[/C][C]0.095636[/C][/ROW]
[ROW][C]30[/C][C]-0.327202[/C][C]-2.7764[/C][C]0.0035[/C][/ROW]
[ROW][C]31[/C][C]-0.171495[/C][C]-1.4552[/C][C]0.074982[/C][/ROW]
[ROW][C]32[/C][C]-0.04095[/C][C]-0.3475[/C][C]0.364625[/C][/ROW]
[ROW][C]33[/C][C]-0.055532[/C][C]-0.4712[/C][C]0.31946[/C][/ROW]
[ROW][C]34[/C][C]-0.062747[/C][C]-0.5324[/C][C]0.298034[/C][/ROW]
[ROW][C]35[/C][C]0.028491[/C][C]0.2418[/C][C]0.40483[/C][/ROW]
[ROW][C]36[/C][C]0.199523[/C][C]1.693[/C][C]0.047388[/C][/ROW]
[ROW][C]37[/C][C]0.034515[/C][C]0.2929[/C][C]0.385233[/C][/ROW]
[ROW][C]38[/C][C]-0.119433[/C][C]-1.0134[/C][C]0.157125[/C][/ROW]
[ROW][C]39[/C][C]-0.134397[/C][C]-1.1404[/C][C]0.128951[/C][/ROW]
[ROW][C]40[/C][C]-0.137749[/C][C]-1.1688[/C][C]0.123162[/C][/ROW]
[ROW][C]41[/C][C]-0.209089[/C][C]-1.7742[/C][C]0.040131[/C][/ROW]
[ROW][C]42[/C][C]-0.348697[/C][C]-2.9588[/C][C]0.002089[/C][/ROW]
[ROW][C]43[/C][C]-0.225753[/C][C]-1.9156[/C][C]0.029695[/C][/ROW]
[ROW][C]44[/C][C]-0.135407[/C][C]-1.149[/C][C]0.127186[/C][/ROW]
[ROW][C]45[/C][C]-0.146271[/C][C]-1.2411[/C][C]0.10929[/C][/ROW]
[ROW][C]46[/C][C]-0.138842[/C][C]-1.1781[/C][C]0.121315[/C][/ROW]
[ROW][C]47[/C][C]-0.073626[/C][C]-0.6247[/C][C]0.26706[/C][/ROW]
[ROW][C]48[/C][C]0.024286[/C][C]0.2061[/C][C]0.418657[/C][/ROW]
[/TABLE]
Source: https://freestatistics.org/blog/index.php?pk=68543&T=1

Globally Unique Identifier (entire table): ba.freestatistics.org/blog/index.php?pk=68543&T=1

As an alternative you can also use a QR Code:  

The GUIDs for individual cells are displayed in the table below:

Autocorrelation Function
Time lag kACF(k)T-STATP-value
10.6310165.35430
20.3635283.08460.001445
30.3427042.90790.002417
40.3293872.79490.003325
50.131661.11720.133818
6-0.142909-1.21260.114619
70.1042740.88480.189605
80.2874292.43890.008599
90.2692722.28480.012635
100.2437352.06820.021109
110.4231843.59080.000299
120.6692455.67870
130.3742953.1760.001099
140.1252361.06270.145744
150.1184931.00540.159024
160.1075940.9130.182154
17-0.053875-0.45710.324473
18-0.269393-2.28590.012603
19-0.067831-0.57560.283351
200.0834160.70780.240673
210.0559290.47460.318264
220.0472570.4010.344809
230.1874241.59030.058069
240.390383.31250.000724
250.1678461.42420.079351
26-0.030265-0.25680.399031
27-0.023996-0.20360.419614
28-0.036552-0.31020.378671
29-0.155473-1.31920.095636
30-0.327202-2.77640.0035
31-0.171495-1.45520.074982
32-0.04095-0.34750.364625
33-0.055532-0.47120.31946
34-0.062747-0.53240.298034
350.0284910.24180.40483
360.1995231.6930.047388
370.0345150.29290.385233
38-0.119433-1.01340.157125
39-0.134397-1.14040.128951
40-0.137749-1.16880.123162
41-0.209089-1.77420.040131
42-0.348697-2.95880.002089
43-0.225753-1.91560.029695
44-0.135407-1.1490.127186
45-0.146271-1.24110.10929
46-0.138842-1.17810.121315
47-0.073626-0.62470.26706
480.0242860.20610.418657


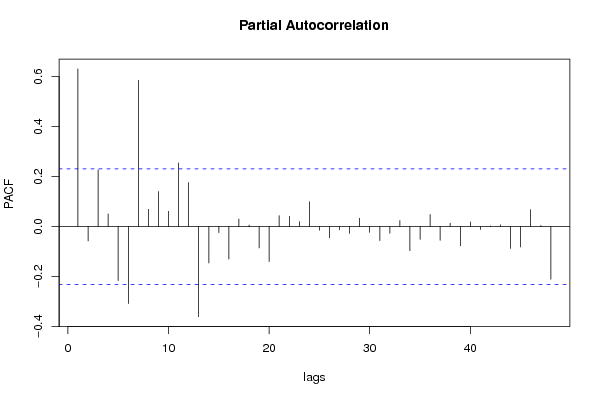
Partial Autocorrelation Function
Time lag kPACF(k)T-STATP-value
10.6310165.35430
2-0.057581-0.48860.313309
30.2274631.93010.028768
40.0505930.42930.334495
5-0.216195-1.83450.035357
6-0.308165-2.61490.005433
70.585514.96822e-06
80.0692950.5880.279189
90.1404221.19150.118681
100.0609650.51730.303265
110.2549432.16330.016921
120.1763031.4960.069515
13-0.36058-3.05960.001556
14-0.145666-1.2360.110235
15-0.023811-0.2020.420225
16-0.12992-1.10240.136978
170.0302870.2570.398959
180.0059040.05010.480092
19-0.085406-0.72470.235493
20-0.140037-1.18820.11932
210.0437340.37110.355828
220.0412350.34990.363722
230.0199510.16930.433023
240.0991050.84090.201585
25-0.014498-0.1230.451217
26-0.045181-0.38340.351287
27-0.012826-0.10880.456819
28-0.027272-0.23140.408827
290.0335620.28480.388315
30-0.023133-0.19630.422469
31-0.055817-0.47360.318601
32-0.026369-0.22370.411793
330.0238890.20270.419968
34-0.096342-0.81750.208174
35-0.050897-0.43190.333562
360.0483550.41030.3414
37-0.054898-0.46580.321374
380.0137290.11650.453793
39-0.076896-0.65250.258084
400.0182980.15530.438524
41-0.012016-0.1020.459535
420.0027110.0230.490856
430.0070820.06010.476124
44-0.087466-0.74220.230199
45-0.081682-0.69310.245241
460.0674760.57260.284366
470.0042080.03570.485807
48-0.210672-1.78760.039024

\begin{tabular}{lllllllll}
\hline
Partial Autocorrelation Function \tabularnewline
Time lag k & PACF(k) & T-STAT & P-value \tabularnewline
1 & 0.631016 & 5.3543 & 0 \tabularnewline
2 & -0.057581 & -0.4886 & 0.313309 \tabularnewline
3 & 0.227463 & 1.9301 & 0.028768 \tabularnewline
4 & 0.050593 & 0.4293 & 0.334495 \tabularnewline
5 & -0.216195 & -1.8345 & 0.035357 \tabularnewline
6 & -0.308165 & -2.6149 & 0.005433 \tabularnewline
7 & 0.58551 & 4.9682 & 2e-06 \tabularnewline
8 & 0.069295 & 0.588 & 0.279189 \tabularnewline
9 & 0.140422 & 1.1915 & 0.118681 \tabularnewline
10 & 0.060965 & 0.5173 & 0.303265 \tabularnewline
11 & 0.254943 & 2.1633 & 0.016921 \tabularnewline
12 & 0.176303 & 1.496 & 0.069515 \tabularnewline
13 & -0.36058 & -3.0596 & 0.001556 \tabularnewline
14 & -0.145666 & -1.236 & 0.110235 \tabularnewline
15 & -0.023811 & -0.202 & 0.420225 \tabularnewline
16 & -0.12992 & -1.1024 & 0.136978 \tabularnewline
17 & 0.030287 & 0.257 & 0.398959 \tabularnewline
18 & 0.005904 & 0.0501 & 0.480092 \tabularnewline
19 & -0.085406 & -0.7247 & 0.235493 \tabularnewline
20 & -0.140037 & -1.1882 & 0.11932 \tabularnewline
21 & 0.043734 & 0.3711 & 0.355828 \tabularnewline
22 & 0.041235 & 0.3499 & 0.363722 \tabularnewline
23 & 0.019951 & 0.1693 & 0.433023 \tabularnewline
24 & 0.099105 & 0.8409 & 0.201585 \tabularnewline
25 & -0.014498 & -0.123 & 0.451217 \tabularnewline
26 & -0.045181 & -0.3834 & 0.351287 \tabularnewline
27 & -0.012826 & -0.1088 & 0.456819 \tabularnewline
28 & -0.027272 & -0.2314 & 0.408827 \tabularnewline
29 & 0.033562 & 0.2848 & 0.388315 \tabularnewline
30 & -0.023133 & -0.1963 & 0.422469 \tabularnewline
31 & -0.055817 & -0.4736 & 0.318601 \tabularnewline
32 & -0.026369 & -0.2237 & 0.411793 \tabularnewline
33 & 0.023889 & 0.2027 & 0.419968 \tabularnewline
34 & -0.096342 & -0.8175 & 0.208174 \tabularnewline
35 & -0.050897 & -0.4319 & 0.333562 \tabularnewline
36 & 0.048355 & 0.4103 & 0.3414 \tabularnewline
37 & -0.054898 & -0.4658 & 0.321374 \tabularnewline
38 & 0.013729 & 0.1165 & 0.453793 \tabularnewline
39 & -0.076896 & -0.6525 & 0.258084 \tabularnewline
40 & 0.018298 & 0.1553 & 0.438524 \tabularnewline
41 & -0.012016 & -0.102 & 0.459535 \tabularnewline
42 & 0.002711 & 0.023 & 0.490856 \tabularnewline
43 & 0.007082 & 0.0601 & 0.476124 \tabularnewline
44 & -0.087466 & -0.7422 & 0.230199 \tabularnewline
45 & -0.081682 & -0.6931 & 0.245241 \tabularnewline
46 & 0.067476 & 0.5726 & 0.284366 \tabularnewline
47 & 0.004208 & 0.0357 & 0.485807 \tabularnewline
48 & -0.210672 & -1.7876 & 0.039024 \tabularnewline
\hline
\end{tabular}
%Source: https://freestatistics.org/blog/index.php?pk=68543&T=2

[TABLE]
[ROW][C]Partial Autocorrelation Function[/C][/ROW]
[ROW][C]Time lag k[/C][C]PACF(k)[/C][C]T-STAT[/C][C]P-value[/C][/ROW]
[ROW][C]1[/C][C]0.631016[/C][C]5.3543[/C][C]0[/C][/ROW]
[ROW][C]2[/C][C]-0.057581[/C][C]-0.4886[/C][C]0.313309[/C][/ROW]
[ROW][C]3[/C][C]0.227463[/C][C]1.9301[/C][C]0.028768[/C][/ROW]
[ROW][C]4[/C][C]0.050593[/C][C]0.4293[/C][C]0.334495[/C][/ROW]
[ROW][C]5[/C][C]-0.216195[/C][C]-1.8345[/C][C]0.035357[/C][/ROW]
[ROW][C]6[/C][C]-0.308165[/C][C]-2.6149[/C][C]0.005433[/C][/ROW]
[ROW][C]7[/C][C]0.58551[/C][C]4.9682[/C][C]2e-06[/C][/ROW]
[ROW][C]8[/C][C]0.069295[/C][C]0.588[/C][C]0.279189[/C][/ROW]
[ROW][C]9[/C][C]0.140422[/C][C]1.1915[/C][C]0.118681[/C][/ROW]
[ROW][C]10[/C][C]0.060965[/C][C]0.5173[/C][C]0.303265[/C][/ROW]
[ROW][C]11[/C][C]0.254943[/C][C]2.1633[/C][C]0.016921[/C][/ROW]
[ROW][C]12[/C][C]0.176303[/C][C]1.496[/C][C]0.069515[/C][/ROW]
[ROW][C]13[/C][C]-0.36058[/C][C]-3.0596[/C][C]0.001556[/C][/ROW]
[ROW][C]14[/C][C]-0.145666[/C][C]-1.236[/C][C]0.110235[/C][/ROW]
[ROW][C]15[/C][C]-0.023811[/C][C]-0.202[/C][C]0.420225[/C][/ROW]
[ROW][C]16[/C][C]-0.12992[/C][C]-1.1024[/C][C]0.136978[/C][/ROW]
[ROW][C]17[/C][C]0.030287[/C][C]0.257[/C][C]0.398959[/C][/ROW]
[ROW][C]18[/C][C]0.005904[/C][C]0.0501[/C][C]0.480092[/C][/ROW]
[ROW][C]19[/C][C]-0.085406[/C][C]-0.7247[/C][C]0.235493[/C][/ROW]
[ROW][C]20[/C][C]-0.140037[/C][C]-1.1882[/C][C]0.11932[/C][/ROW]
[ROW][C]21[/C][C]0.043734[/C][C]0.3711[/C][C]0.355828[/C][/ROW]
[ROW][C]22[/C][C]0.041235[/C][C]0.3499[/C][C]0.363722[/C][/ROW]
[ROW][C]23[/C][C]0.019951[/C][C]0.1693[/C][C]0.433023[/C][/ROW]
[ROW][C]24[/C][C]0.099105[/C][C]0.8409[/C][C]0.201585[/C][/ROW]
[ROW][C]25[/C][C]-0.014498[/C][C]-0.123[/C][C]0.451217[/C][/ROW]
[ROW][C]26[/C][C]-0.045181[/C][C]-0.3834[/C][C]0.351287[/C][/ROW]
[ROW][C]27[/C][C]-0.012826[/C][C]-0.1088[/C][C]0.456819[/C][/ROW]
[ROW][C]28[/C][C]-0.027272[/C][C]-0.2314[/C][C]0.408827[/C][/ROW]
[ROW][C]29[/C][C]0.033562[/C][C]0.2848[/C][C]0.388315[/C][/ROW]
[ROW][C]30[/C][C]-0.023133[/C][C]-0.1963[/C][C]0.422469[/C][/ROW]
[ROW][C]31[/C][C]-0.055817[/C][C]-0.4736[/C][C]0.318601[/C][/ROW]
[ROW][C]32[/C][C]-0.026369[/C][C]-0.2237[/C][C]0.411793[/C][/ROW]
[ROW][C]33[/C][C]0.023889[/C][C]0.2027[/C][C]0.419968[/C][/ROW]
[ROW][C]34[/C][C]-0.096342[/C][C]-0.8175[/C][C]0.208174[/C][/ROW]
[ROW][C]35[/C][C]-0.050897[/C][C]-0.4319[/C][C]0.333562[/C][/ROW]
[ROW][C]36[/C][C]0.048355[/C][C]0.4103[/C][C]0.3414[/C][/ROW]
[ROW][C]37[/C][C]-0.054898[/C][C]-0.4658[/C][C]0.321374[/C][/ROW]
[ROW][C]38[/C][C]0.013729[/C][C]0.1165[/C][C]0.453793[/C][/ROW]
[ROW][C]39[/C][C]-0.076896[/C][C]-0.6525[/C][C]0.258084[/C][/ROW]
[ROW][C]40[/C][C]0.018298[/C][C]0.1553[/C][C]0.438524[/C][/ROW]
[ROW][C]41[/C][C]-0.012016[/C][C]-0.102[/C][C]0.459535[/C][/ROW]
[ROW][C]42[/C][C]0.002711[/C][C]0.023[/C][C]0.490856[/C][/ROW]
[ROW][C]43[/C][C]0.007082[/C][C]0.0601[/C][C]0.476124[/C][/ROW]
[ROW][C]44[/C][C]-0.087466[/C][C]-0.7422[/C][C]0.230199[/C][/ROW]
[ROW][C]45[/C][C]-0.081682[/C][C]-0.6931[/C][C]0.245241[/C][/ROW]
[ROW][C]46[/C][C]0.067476[/C][C]0.5726[/C][C]0.284366[/C][/ROW]
[ROW][C]47[/C][C]0.004208[/C][C]0.0357[/C][C]0.485807[/C][/ROW]
[ROW][C]48[/C][C]-0.210672[/C][C]-1.7876[/C][C]0.039024[/C][/ROW]
[/TABLE]
Source: https://freestatistics.org/blog/index.php?pk=68543&T=2

Globally Unique Identifier (entire table): ba.freestatistics.org/blog/index.php?pk=68543&T=2

As an alternative you can also use a QR Code:  

The GUIDs for individual cells are displayed in the table below:

Partial Autocorrelation Function
Time lag kPACF(k)T-STATP-value
10.6310165.35430
2-0.057581-0.48860.313309
30.2274631.93010.028768
40.0505930.42930.334495
5-0.216195-1.83450.035357
6-0.308165-2.61490.005433
70.585514.96822e-06
80.0692950.5880.279189
90.1404221.19150.118681
100.0609650.51730.303265
110.2549432.16330.016921
120.1763031.4960.069515
13-0.36058-3.05960.001556
14-0.145666-1.2360.110235
15-0.023811-0.2020.420225
16-0.12992-1.10240.136978
170.0302870.2570.398959
180.0059040.05010.480092
19-0.085406-0.72470.235493
20-0.140037-1.18820.11932
210.0437340.37110.355828
220.0412350.34990.363722
230.0199510.16930.433023
240.0991050.84090.201585
25-0.014498-0.1230.451217
26-0.045181-0.38340.351287
27-0.012826-0.10880.456819
28-0.027272-0.23140.408827
290.0335620.28480.388315
30-0.023133-0.19630.422469
31-0.055817-0.47360.318601
32-0.026369-0.22370.411793
330.0238890.20270.419968
34-0.096342-0.81750.208174
35-0.050897-0.43190.333562
360.0483550.41030.3414
37-0.054898-0.46580.321374
380.0137290.11650.453793
39-0.076896-0.65250.258084
400.0182980.15530.438524
41-0.012016-0.1020.459535
420.0027110.0230.490856
430.0070820.06010.476124
44-0.087466-0.74220.230199
45-0.081682-0.69310.245241
460.0674760.57260.284366
470.0042080.03570.485807
48-0.210672-1.78760.039024


Parameters (Session):
par1 = 48 ; par2 = 1 ; par3 = 0 ; par4 = 0 ; par5 = 12 ; par6 = White Noise ; par7 = 0.95 ;
Parameters (R input):
par1 = 48 ; par2 = 1 ; par3 = 0 ; par4 = 0 ; par5 = 12 ; par6 = White Noise ; par7 = 0.95 ;
R code (references can be found in the software module):
if (par1 == 'Default') {
par1 = 10*log10(length(x))
} else {
par1 <- as.numeric(par1)
}
par2 <- as.numeric(par2)
par3 <- as.numeric(par3)
par4 <- as.numeric(par4)
par5 <- as.numeric(par5)
if (par6 == 'White Noise') par6 <- 'white' else par6 <- 'ma'
par7 <- as.numeric(par7)
if (par2 == 0) {
x <- log(x)
} else {
x <- (x ^ par2 - 1) / par2
}
if (par3 > 0) x <- diff(x,lag=1,difference=par3)
if (par4 > 0) x <- diff(x,lag=par5,difference=par4)
bitmap(file='pic1.png')
racf <- acf(x, par1, main='Autocorrelation', xlab='time lag', ylab='ACF', ci.type=par6, ci=par7, sub=paste('(lambda=',par2,', d=',par3,', D=',par4,', CI=', par7, ', CI type=',par6,')',sep=''))
dev.off()
bitmap(file='pic2.png')
rpacf <- pacf(x,par1,main='Partial Autocorrelation',xlab='lags',ylab='PACF')
dev.off()
(myacf <- c(racf$acf))
(mypacf <- c(rpacf$acf))
lengthx <- length(x)
sqrtn <- sqrt(lengthx)
load(file='createtable')
a<-table.start()
a<-table.row.start(a)
a<-table.element(a,'Autocorrelation Function',4,TRUE)
a<-table.row.end(a)
a<-table.row.start(a)
a<-table.element(a,'Time lag k',header=TRUE)
a<-table.element(a,hyperlink('basics.htm','ACF(k)','click here for more information about the Autocorrelation Function'),header=TRUE)
a<-table.element(a,'T-STAT',header=TRUE)
a<-table.element(a,'P-value',header=TRUE)
a<-table.row.end(a)
for (i in 2:(par1+1)) {
a<-table.row.start(a)
a<-table.element(a,i-1,header=TRUE)
a<-table.element(a,round(myacf[i],6))
mytstat <- myacf[i]*sqrtn
a<-table.element(a,round(mytstat,4))
a<-table.element(a,round(1-pt(abs(mytstat),lengthx),6))
a<-table.row.end(a)
}
a<-table.end(a)
table.save(a,file='mytable.tab')
a<-table.start()
a<-table.row.start(a)
a<-table.element(a,'Partial Autocorrelation Function',4,TRUE)
a<-table.row.end(a)
a<-table.row.start(a)
a<-table.element(a,'Time lag k',header=TRUE)
a<-table.element(a,hyperlink('basics.htm','PACF(k)','click here for more information about the Partial Autocorrelation Function'),header=TRUE)
a<-table.element(a,'T-STAT',header=TRUE)
a<-table.element(a,'P-value',header=TRUE)
a<-table.row.end(a)
for (i in 1:par1) {
a<-table.row.start(a)
a<-table.element(a,i,header=TRUE)
a<-table.element(a,round(mypacf[i],6))
mytstat <- mypacf[i]*sqrtn
a<-table.element(a,round(mytstat,4))
a<-table.element(a,round(1-pt(abs(mytstat),lengthx),6))
a<-table.row.end(a)
}
a<-table.end(a)
table.save(a,file='mytable1.tab')