Free Statistics

of Irreproducible Research!

Author's title

Author*The author of this computation has been verified*
R Software Modulerwasp_bidensity.wasp
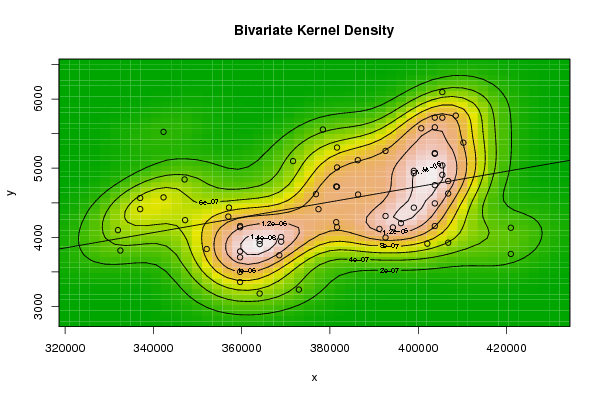
Title produced by softwareBivariate Kernel Density Estimation
Date of computationWed, 16 Dec 2009 11:14:36 -0700
Cite this page as followsStatistical Computations at FreeStatistics.org, Office for Research Development and Education, URL https://freestatistics.org/blog/index.php?v=date/2009/Dec/16/t1260987324t7jlvcbcfcw8y0s.htm/, Retrieved Tue, 30 Apr 2024 12:55:34 +0000
Statistical Computations at FreeStatistics.org, Office for Research Development and Education, URL https://freestatistics.org/blog/index.php?pk=68522, Retrieved Tue, 30 Apr 2024 12:55:34 +0000
QR Codes:

Original text written by user:
IsPrivate?No (this computation is public)
User-defined keywords
Estimated Impact94
Family? (F = Feedback message, R = changed R code, M = changed R Module, P = changed Parameters, D = changed Data)
-     [Bivariate Kernel Density Estimation] [3/11/2009] [2009-11-02 21:54:51] [b98453cac15ba1066b407e146608df68]
- R PD    [Bivariate Kernel Density Estimation] [] [2009-12-16 18:14:36] [e76c6d261190c0179bc6006a5cdb804c] [Current]
Feedback Forum

Post a new message
Dataseries X:
359640
364080
364080
359640
359640
359640
359640
359640
364080
368520
372960
377400
406780
402050
392590
368940
368940
378400
406780
420970
420970
406780
392590
392590
394250
399000
403750
399000
408500
403750
403750
399000
403750
403750
403750
403750
405450
405450
405450
405450
410220
400680
386370
381600
381600
381600
381600
376830
381420
381420
386310
396090
391200
371640
356970
342300
332520
342300
347190
352080
357130
347070
337010
337010
331980
Dataseries Y:
3353
3186
3902
4164
3499
4145
3796
3711
3949
3740
3243
4407
4814
3908
5250
3937
4004
5560
3922
3759
4138
4634
3996
4308
4143
4429
5219
4929
5761
5592
4163
4962
5208
4755
4491
5732
5731
5040
6102
4904
5369
5578
4619
4731
5011
5299
4146
4625
4736
4219
5116
4205
4121
5103
4300
4578
3809
5526
4248
3830
4430
4837
4408
4569
4104


Summary of computational transaction
Raw Inputview raw input (R code)
Raw Outputview raw output of R engine
Computing time1 seconds
R Server'Gwilym Jenkins' @ 72.249.127.135

\begin{tabular}{lllllllll}
\hline
Summary of computational transaction \tabularnewline
Raw Input & view raw input (R code)  \tabularnewline
Raw Output & view raw output of R engine  \tabularnewline
Computing time & 1 seconds \tabularnewline
R Server & 'Gwilym Jenkins' @ 72.249.127.135 \tabularnewline
\hline
\end{tabular}
%Source: https://freestatistics.org/blog/index.php?pk=68522&T=0

[TABLE]
[ROW][C]Summary of computational transaction[/C][/ROW]
[ROW][C]Raw Input[/C][C]view raw input (R code) [/C][/ROW]
[ROW][C]Raw Output[/C][C]view raw output of R engine [/C][/ROW]
[ROW][C]Computing time[/C][C]1 seconds[/C][/ROW]
[ROW][C]R Server[/C][C]'Gwilym Jenkins' @ 72.249.127.135[/C][/ROW]
[/TABLE]
Source: https://freestatistics.org/blog/index.php?pk=68522&T=0

Globally Unique Identifier (entire table): ba.freestatistics.org/blog/index.php?pk=68522&T=0

As an alternative you can also use a QR Code:  

The GUIDs for individual cells are displayed in the table below:

Summary of computational transaction
Raw Inputview raw input (R code)
Raw Outputview raw output of R engine
Computing time1 seconds
R Server'Gwilym Jenkins' @ 72.249.127.135


Bandwidth
x axis8128.21968507244
y axis292.677648561916
Correlation
correlation used in KDE0.387190053391992
correlation(x,y)0.387190053391992

\begin{tabular}{lllllllll}
\hline
Bandwidth \tabularnewline
x axis & 8128.21968507244 \tabularnewline
y axis & 292.677648561916 \tabularnewline
Correlation \tabularnewline
correlation used in KDE & 0.387190053391992 \tabularnewline
correlation(x,y) & 0.387190053391992 \tabularnewline
\hline
\end{tabular}
%Source: https://freestatistics.org/blog/index.php?pk=68522&T=1

[TABLE]
[ROW][C]Bandwidth[/C][/ROW]
[ROW][C]x axis[/C][C]8128.21968507244[/C][/ROW]
[ROW][C]y axis[/C][C]292.677648561916[/C][/ROW]
[ROW][C]Correlation[/C][/ROW]
[ROW][C]correlation used in KDE[/C][C]0.387190053391992[/C][/ROW]
[ROW][C]correlation(x,y)[/C][C]0.387190053391992[/C][/ROW]
[/TABLE]
Source: https://freestatistics.org/blog/index.php?pk=68522&T=1

Globally Unique Identifier (entire table): ba.freestatistics.org/blog/index.php?pk=68522&T=1

As an alternative you can also use a QR Code:  

The GUIDs for individual cells are displayed in the table below:

Bandwidth
x axis8128.21968507244
y axis292.677648561916
Correlation
correlation used in KDE0.387190053391992
correlation(x,y)0.387190053391992


Parameters (Session):
par1 = 50 ; par2 = 50 ; par3 = 0 ; par4 = 0 ; par5 = 0 ; par6 = Y ; par7 = Y ;
Parameters (R input):
par1 = 50 ; par2 = 50 ; par3 = 0 ; par4 = 0 ; par5 = 0 ; par6 = Y ; par7 = Y ;
R code (references can be found in the software module):
par1 <- as(par1,'numeric')
par2 <- as(par2,'numeric')
par3 <- as(par3,'numeric')
par4 <- as(par4,'numeric')
par5 <- as(par5,'numeric')
library('GenKern')
if (par3==0) par3 <- dpik(x)
if (par4==0) par4 <- dpik(y)
if (par5==0) par5 <- cor(x,y)
if (par1 > 500) par1 <- 500
if (par2 > 500) par2 <- 500
bitmap(file='bidensity.png')
op <- KernSur(x,y, xgridsize=par1, ygridsize=par2, correlation=par5, xbandwidth=par3, ybandwidth=par4)
image(op$xords, op$yords, op$zden, col=terrain.colors(100), axes=TRUE,main=main,xlab=xlab,ylab=ylab)
if (par6=='Y') contour(op$xords, op$yords, op$zden, add=TRUE)
if (par7=='Y') points(x,y)
(r<-lm(y ~ x))
abline(r)
box()
dev.off()
load(file='createtable')
a<-table.start()
a<-table.row.start(a)
a<-table.element(a,'Bandwidth',2,TRUE)
a<-table.row.end(a)
a<-table.row.start(a)
a<-table.element(a,'x axis',header=TRUE)
a<-table.element(a,par3)
a<-table.row.end(a)
a<-table.row.start(a)
a<-table.element(a,'y axis',header=TRUE)
a<-table.element(a,par4)
a<-table.row.end(a)
a<-table.row.start(a)
a<-table.element(a,'Correlation',2,TRUE)
a<-table.row.end(a)
a<-table.row.start(a)
a<-table.element(a,'correlation used in KDE',header=TRUE)
a<-table.element(a,par5)
a<-table.row.end(a)
a<-table.row.start(a)
a<-table.element(a,'correlation(x,y)',header=TRUE)
a<-table.element(a,cor(x,y))
a<-table.row.end(a)
a<-table.end(a)
table.save(a,file='mytable.tab')