Free Statistics

of Irreproducible Research!

Author's title

Author*The author of this computation has been verified*
R Software Modulerwasp_arimabackwardselection.wasp
Title produced by softwareARIMA Backward Selection
Date of computationWed, 16 Dec 2009 10:51:41 -0700
Cite this page as followsStatistical Computations at FreeStatistics.org, Office for Research Development and Education, URL https://freestatistics.org/blog/index.php?v=date/2009/Dec/16/t1260985977tdeakqatoxk1s8r.htm/, Retrieved Tue, 30 Apr 2024 14:38:03 +0000
Statistical Computations at FreeStatistics.org, Office for Research Development and Education, URL https://freestatistics.org/blog/index.php?pk=68507, Retrieved Tue, 30 Apr 2024 14:38:03 +0000
QR Codes:

Original text written by user:
IsPrivate?No (this computation is public)
User-defined keywords
Estimated Impact117
Family? (F = Feedback message, R = changed R code, M = changed R Module, P = changed Parameters, D = changed Data)
-     [Bivariate Granger Causality] [] [2009-12-07 08:54:13] [b98453cac15ba1066b407e146608df68]
-   PD  [Bivariate Granger Causality] [WS10 g] [2009-12-11 15:33:28] [626f1d98f4a7f05bcb9f17666b672c60]
- RMPD      [ARIMA Backward Selection] [Verbetering works...] [2009-12-16 17:51:41] [3d2053c5f7c50d3c075d87ce0bd87294] [Current]
Feedback Forum

Post a new message
Dataseries X:
258596
259056
264193
260325
261890
260683
257941
258151
262434
261577
262188
261092
263571
265031
270388
265458
266218
266386
263486
263620
267755
266554
266981
264133
265980
267183
272113
267261
269117
269034
266609
267261
271406
269529
270282
268663
269847
270998
277068
273529
275307
276488
274455
274507
279528
277673
278102
275131
277162
278799
285502
280672
281342
281132
278286
279120
289131
294453
295733
302233
308859
311054
318130
315823
316517
316907
314969
316107


Summary of computational transaction
Raw Inputview raw input (R code)
Raw Outputview raw output of R engine
Computing time3 seconds
R Server'Gwilym Jenkins' @ 72.249.127.135

\begin{tabular}{lllllllll}
\hline
Summary of computational transaction \tabularnewline
Raw Input & view raw input (R code)  \tabularnewline
Raw Output & view raw output of R engine  \tabularnewline
Computing time & 3 seconds \tabularnewline
R Server & 'Gwilym Jenkins' @ 72.249.127.135 \tabularnewline
\hline
\end{tabular}
%Source: https://freestatistics.org/blog/index.php?pk=68507&T=0

[TABLE]
[ROW][C]Summary of computational transaction[/C][/ROW]
[ROW][C]Raw Input[/C][C]view raw input (R code) [/C][/ROW]
[ROW][C]Raw Output[/C][C]view raw output of R engine [/C][/ROW]
[ROW][C]Computing time[/C][C]3 seconds[/C][/ROW]
[ROW][C]R Server[/C][C]'Gwilym Jenkins' @ 72.249.127.135[/C][/ROW]
[/TABLE]
Source: https://freestatistics.org/blog/index.php?pk=68507&T=0

Globally Unique Identifier (entire table): ba.freestatistics.org/blog/index.php?pk=68507&T=0

As an alternative you can also use a QR Code:  

The GUIDs for individual cells are displayed in the table below:

Summary of computational transaction
Raw Inputview raw input (R code)
Raw Outputview raw output of R engine
Computing time3 seconds
R Server'Gwilym Jenkins' @ 72.249.127.135


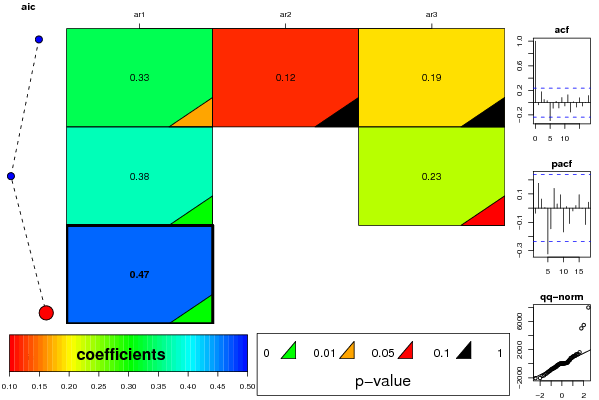
ARIMA Parameter Estimation and Backward Selection
Iterationar1ar2ar3
Estimates ( 1 )0.33360.11990.1931
(p-val)(0.0132 )(0.3849 )(0.1413 )
Estimates ( 2 )0.376400.2341
(p-val)(0.0031 )(NA )(0.0586 )
Estimates ( 3 )0.467900
(p-val)(2e-04 )(NA )(NA )
Estimates ( 4 )NANANA
(p-val)(NA )(NA )(NA )
Estimates ( 5 )NANANA
(p-val)(NA )(NA )(NA )

\begin{tabular}{lllllllll}
\hline
ARIMA Parameter Estimation and Backward Selection \tabularnewline
Iteration & ar1 & ar2 & ar3 \tabularnewline
Estimates ( 1 ) & 0.3336 & 0.1199 & 0.1931 \tabularnewline
(p-val) & (0.0132 ) & (0.3849 ) & (0.1413 ) \tabularnewline
Estimates ( 2 ) & 0.3764 & 0 & 0.2341 \tabularnewline
(p-val) & (0.0031 ) & (NA ) & (0.0586 ) \tabularnewline
Estimates ( 3 ) & 0.4679 & 0 & 0 \tabularnewline
(p-val) & (2e-04 ) & (NA ) & (NA ) \tabularnewline
Estimates ( 4 ) & NA & NA & NA \tabularnewline
(p-val) & (NA ) & (NA ) & (NA ) \tabularnewline
Estimates ( 5 ) & NA & NA & NA \tabularnewline
(p-val) & (NA ) & (NA ) & (NA ) \tabularnewline
\hline
\end{tabular}
%Source: https://freestatistics.org/blog/index.php?pk=68507&T=1

[TABLE]
[ROW][C]ARIMA Parameter Estimation and Backward Selection[/C][/ROW]
[ROW][C]Iteration[/C][C]ar1[/C][C]ar2[/C][C]ar3[/C][/ROW]
[ROW][C]Estimates ( 1 )[/C][C]0.3336[/C][C]0.1199[/C][C]0.1931[/C][/ROW]
[ROW][C](p-val)[/C][C](0.0132 )[/C][C](0.3849 )[/C][C](0.1413 )[/C][/ROW]
[ROW][C]Estimates ( 2 )[/C][C]0.3764[/C][C]0[/C][C]0.2341[/C][/ROW]
[ROW][C](p-val)[/C][C](0.0031 )[/C][C](NA )[/C][C](0.0586 )[/C][/ROW]
[ROW][C]Estimates ( 3 )[/C][C]0.4679[/C][C]0[/C][C]0[/C][/ROW]
[ROW][C](p-val)[/C][C](2e-04 )[/C][C](NA )[/C][C](NA )[/C][/ROW]
[ROW][C]Estimates ( 4 )[/C][C]NA[/C][C]NA[/C][C]NA[/C][/ROW]
[ROW][C](p-val)[/C][C](NA )[/C][C](NA )[/C][C](NA )[/C][/ROW]
[ROW][C]Estimates ( 5 )[/C][C]NA[/C][C]NA[/C][C]NA[/C][/ROW]
[ROW][C](p-val)[/C][C](NA )[/C][C](NA )[/C][C](NA )[/C][/ROW]
[/TABLE]
Source: https://freestatistics.org/blog/index.php?pk=68507&T=1

Globally Unique Identifier (entire table): ba.freestatistics.org/blog/index.php?pk=68507&T=1

As an alternative you can also use a QR Code:  

The GUIDs for individual cells are displayed in the table below:

ARIMA Parameter Estimation and Backward Selection
Iterationar1ar2ar3
Estimates ( 1 )0.33360.11990.1931
(p-val)(0.0132 )(0.3849 )(0.1413 )
Estimates ( 2 )0.376400.2341
(p-val)(0.0031 )(NA )(0.0586 )
Estimates ( 3 )0.467900
(p-val)(2e-04 )(NA )(NA )
Estimates ( 4 )NANANA
(p-val)(NA )(NA )(NA )
Estimates ( 5 )NANANA
(p-val)(NA )(NA )(NA )


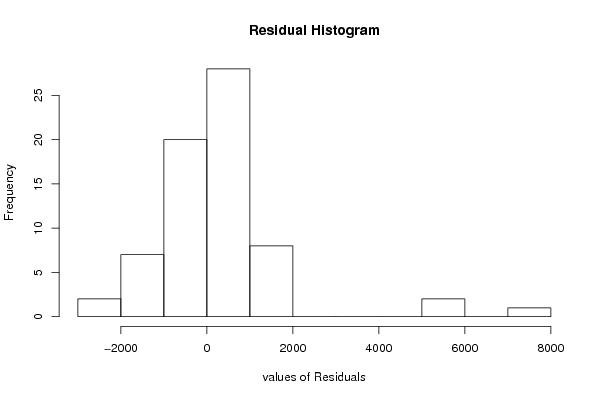
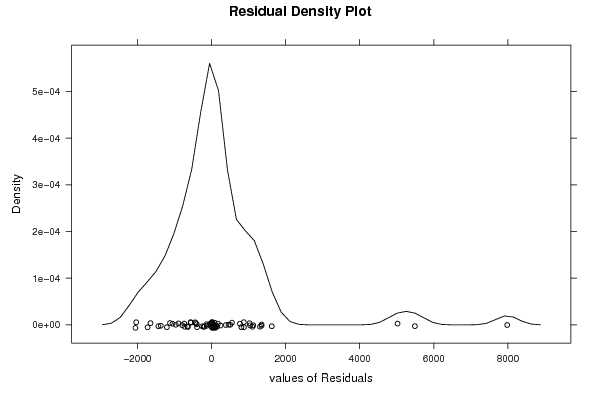
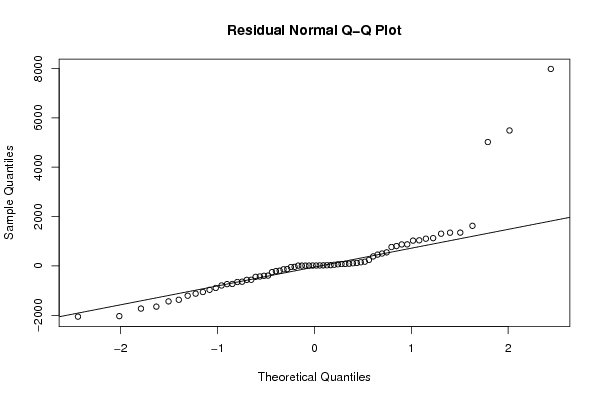
Estimated ARIMA Residuals
Value
-892.545814632062
875.376506388964
-210.019639516243
-1206.61835515086
-639.345858292826
1626.52138762498
-426.961818541304
171.938892418660
-441.299828308186
-251.298027515305
-36.715055706624
-1648.08767365664
108.042353800629
23.9814564699490
79.9127458136486
386.696815255292
1126.80603845420
-563.600866181369
551.2231246343
82.6049997886294
-126.228185903747
-790.9690848217
459.195454687695
1103.94242049172
-967.37144184718
121.251996413572
871.846670318277
1039.08739622752
-560.079585341503
1026.47013349202
-391.201890886238
-729.299861164007
805.93668812915
-399.526547504065
-191.812284285203
-1435.12145601946
1350.78384442412
243.016513927781
766.578566210576
-1727.57634476537
-735.807940403231
-1122.10972078791
12.8580597861437
1347.43797942723
5021.28556007561
5488.94628552138
-2033.72171311709
7982.42197744572
-650.421341289069
-1370.93145945732
-2054.35456261679
1306.83143021061
-1056.37114507513
503.640647298016
91.4685929073022
-43.4178937146790

\begin{tabular}{lllllllll}
\hline
Estimated ARIMA Residuals \tabularnewline
Value \tabularnewline
-892.545814632062 \tabularnewline
875.376506388964 \tabularnewline
-210.019639516243 \tabularnewline
-1206.61835515086 \tabularnewline
-639.345858292826 \tabularnewline
1626.52138762498 \tabularnewline
-426.961818541304 \tabularnewline
171.938892418660 \tabularnewline
-441.299828308186 \tabularnewline
-251.298027515305 \tabularnewline
-36.715055706624 \tabularnewline
-1648.08767365664 \tabularnewline
108.042353800629 \tabularnewline
23.9814564699490 \tabularnewline
79.9127458136486 \tabularnewline
386.696815255292 \tabularnewline
1126.80603845420 \tabularnewline
-563.600866181369 \tabularnewline
551.2231246343 \tabularnewline
82.6049997886294 \tabularnewline
-126.228185903747 \tabularnewline
-790.9690848217 \tabularnewline
459.195454687695 \tabularnewline
1103.94242049172 \tabularnewline
-967.37144184718 \tabularnewline
121.251996413572 \tabularnewline
871.846670318277 \tabularnewline
1039.08739622752 \tabularnewline
-560.079585341503 \tabularnewline
1026.47013349202 \tabularnewline
-391.201890886238 \tabularnewline
-729.299861164007 \tabularnewline
805.93668812915 \tabularnewline
-399.526547504065 \tabularnewline
-191.812284285203 \tabularnewline
-1435.12145601946 \tabularnewline
1350.78384442412 \tabularnewline
243.016513927781 \tabularnewline
766.578566210576 \tabularnewline
-1727.57634476537 \tabularnewline
-735.807940403231 \tabularnewline
-1122.10972078791 \tabularnewline
12.8580597861437 \tabularnewline
1347.43797942723 \tabularnewline
5021.28556007561 \tabularnewline
5488.94628552138 \tabularnewline
-2033.72171311709 \tabularnewline
7982.42197744572 \tabularnewline
-650.421341289069 \tabularnewline
-1370.93145945732 \tabularnewline
-2054.35456261679 \tabularnewline
1306.83143021061 \tabularnewline
-1056.37114507513 \tabularnewline
503.640647298016 \tabularnewline
91.4685929073022 \tabularnewline
-43.4178937146790 \tabularnewline
\hline
\end{tabular}
%Source: https://freestatistics.org/blog/index.php?pk=68507&T=2

[TABLE]
[ROW][C]Estimated ARIMA Residuals[/C][/ROW]
[ROW][C]Value[/C][/ROW]
[ROW][C]-892.545814632062[/C][/ROW]
[ROW][C]875.376506388964[/C][/ROW]
[ROW][C]-210.019639516243[/C][/ROW]
[ROW][C]-1206.61835515086[/C][/ROW]
[ROW][C]-639.345858292826[/C][/ROW]
[ROW][C]1626.52138762498[/C][/ROW]
[ROW][C]-426.961818541304[/C][/ROW]
[ROW][C]171.938892418660[/C][/ROW]
[ROW][C]-441.299828308186[/C][/ROW]
[ROW][C]-251.298027515305[/C][/ROW]
[ROW][C]-36.715055706624[/C][/ROW]
[ROW][C]-1648.08767365664[/C][/ROW]
[ROW][C]108.042353800629[/C][/ROW]
[ROW][C]23.9814564699490[/C][/ROW]
[ROW][C]79.9127458136486[/C][/ROW]
[ROW][C]386.696815255292[/C][/ROW]
[ROW][C]1126.80603845420[/C][/ROW]
[ROW][C]-563.600866181369[/C][/ROW]
[ROW][C]551.2231246343[/C][/ROW]
[ROW][C]82.6049997886294[/C][/ROW]
[ROW][C]-126.228185903747[/C][/ROW]
[ROW][C]-790.9690848217[/C][/ROW]
[ROW][C]459.195454687695[/C][/ROW]
[ROW][C]1103.94242049172[/C][/ROW]
[ROW][C]-967.37144184718[/C][/ROW]
[ROW][C]121.251996413572[/C][/ROW]
[ROW][C]871.846670318277[/C][/ROW]
[ROW][C]1039.08739622752[/C][/ROW]
[ROW][C]-560.079585341503[/C][/ROW]
[ROW][C]1026.47013349202[/C][/ROW]
[ROW][C]-391.201890886238[/C][/ROW]
[ROW][C]-729.299861164007[/C][/ROW]
[ROW][C]805.93668812915[/C][/ROW]
[ROW][C]-399.526547504065[/C][/ROW]
[ROW][C]-191.812284285203[/C][/ROW]
[ROW][C]-1435.12145601946[/C][/ROW]
[ROW][C]1350.78384442412[/C][/ROW]
[ROW][C]243.016513927781[/C][/ROW]
[ROW][C]766.578566210576[/C][/ROW]
[ROW][C]-1727.57634476537[/C][/ROW]
[ROW][C]-735.807940403231[/C][/ROW]
[ROW][C]-1122.10972078791[/C][/ROW]
[ROW][C]12.8580597861437[/C][/ROW]
[ROW][C]1347.43797942723[/C][/ROW]
[ROW][C]5021.28556007561[/C][/ROW]
[ROW][C]5488.94628552138[/C][/ROW]
[ROW][C]-2033.72171311709[/C][/ROW]
[ROW][C]7982.42197744572[/C][/ROW]
[ROW][C]-650.421341289069[/C][/ROW]
[ROW][C]-1370.93145945732[/C][/ROW]
[ROW][C]-2054.35456261679[/C][/ROW]
[ROW][C]1306.83143021061[/C][/ROW]
[ROW][C]-1056.37114507513[/C][/ROW]
[ROW][C]503.640647298016[/C][/ROW]
[ROW][C]91.4685929073022[/C][/ROW]
[ROW][C]-43.4178937146790[/C][/ROW]
[/TABLE]
Source: https://freestatistics.org/blog/index.php?pk=68507&T=2

Globally Unique Identifier (entire table): ba.freestatistics.org/blog/index.php?pk=68507&T=2

As an alternative you can also use a QR Code:  

The GUIDs for individual cells are displayed in the table below:

Estimated ARIMA Residuals
Value
-892.545814632062
875.376506388964
-210.019639516243
-1206.61835515086
-639.345858292826
1626.52138762498
-426.961818541304
171.938892418660
-441.299828308186
-251.298027515305
-36.715055706624
-1648.08767365664
108.042353800629
23.9814564699490
79.9127458136486
386.696815255292
1126.80603845420
-563.600866181369
551.2231246343
82.6049997886294
-126.228185903747
-790.9690848217
459.195454687695
1103.94242049172
-967.37144184718
121.251996413572
871.846670318277
1039.08739622752
-560.079585341503
1026.47013349202
-391.201890886238
-729.299861164007
805.93668812915
-399.526547504065
-191.812284285203
-1435.12145601946
1350.78384442412
243.016513927781
766.578566210576
-1727.57634476537
-735.807940403231
-1122.10972078791
12.8580597861437
1347.43797942723
5021.28556007561
5488.94628552138
-2033.72171311709
7982.42197744572
-650.421341289069
-1370.93145945732
-2054.35456261679
1306.83143021061
-1056.37114507513
503.640647298016
91.4685929073022
-43.4178937146790


Parameters (Session):
par1 = FALSE ; par2 = 1 ; par3 = 1 ; par4 = 1 ; par5 = 1 ; par6 = 1 ; par7 = 0 ; par8 = 0 ; par9 = 0 ;
Parameters (R input):
par1 = FALSE ; par2 = 1 ; par3 = 1 ; par4 = 1 ; par5 = 12 ; par6 = 3 ; par7 = 0 ; par8 = 0 ; par9 = 0 ;
R code (references can be found in the software module):
library(lattice)
if (par1 == 'TRUE') par1 <- TRUE
if (par1 == 'FALSE') par1 <- FALSE
par2 <- as.numeric(par2) #Box-Cox lambda transformation parameter
par3 <- as.numeric(par3) #degree of non-seasonal differencing
par4 <- as.numeric(par4) #degree of seasonal differencing
par5 <- as.numeric(par5) #seasonal period
par6 <- as.numeric(par6) #degree (p) of the non-seasonal AR(p) polynomial
par7 <- as.numeric(par7) #degree (q) of the non-seasonal MA(q) polynomial
par8 <- as.numeric(par8) #degree (P) of the seasonal AR(P) polynomial
par9 <- as.numeric(par9) #degree (Q) of the seasonal MA(Q) polynomial
armaGR <- function(arima.out, names, n){
try1 <- arima.out$coef
try2 <- sqrt(diag(arima.out$var.coef))
try.data.frame <- data.frame(matrix(NA,ncol=4,nrow=length(names)))
dimnames(try.data.frame) <- list(names,c('coef','std','tstat','pv'))
try.data.frame[,1] <- try1
for(i in 1:length(try2)) try.data.frame[which(rownames(try.data.frame)==names(try2)[i]),2] <- try2[i]
try.data.frame[,3] <- try.data.frame[,1] / try.data.frame[,2]
try.data.frame[,4] <- round((1-pt(abs(try.data.frame[,3]),df=n-(length(try2)+1)))*2,5)
vector <- rep(NA,length(names))
vector[is.na(try.data.frame[,4])] <- 0
maxi <- which.max(try.data.frame[,4])
continue <- max(try.data.frame[,4],na.rm=TRUE) > .05
vector[maxi] <- 0
list(summary=try.data.frame,next.vector=vector,continue=continue)
}
arimaSelect <- function(series, order=c(13,0,0), seasonal=list(order=c(2,0,0),period=12), include.mean=F){
nrc <- order[1]+order[3]+seasonal$order[1]+seasonal$order[3]
coeff <- matrix(NA, nrow=nrc*2, ncol=nrc)
pval <- matrix(NA, nrow=nrc*2, ncol=nrc)
mylist <- rep(list(NULL), nrc)
names <- NULL
if(order[1] > 0) names <- paste('ar',1:order[1],sep='')
if(order[3] > 0) names <- c( names , paste('ma',1:order[3],sep='') )
if(seasonal$order[1] > 0) names <- c(names, paste('sar',1:seasonal$order[1],sep=''))
if(seasonal$order[3] > 0) names <- c(names, paste('sma',1:seasonal$order[3],sep=''))
arima.out <- arima(series, order=order, seasonal=seasonal, include.mean=include.mean, method='ML')
mylist[[1]] <- arima.out
last.arma <- armaGR(arima.out, names, length(series))
mystop <- FALSE
i <- 1
coeff[i,] <- last.arma[[1]][,1]
pval [i,] <- last.arma[[1]][,4]
i <- 2
aic <- arima.out$aic
while(!mystop){
mylist[[i]] <- arima.out
arima.out <- arima(series, order=order, seasonal=seasonal, include.mean=include.mean, method='ML', fixed=last.arma$next.vector)
aic <- c(aic, arima.out$aic)
last.arma <- armaGR(arima.out, names, length(series))
mystop <- !last.arma$continue
coeff[i,] <- last.arma[[1]][,1]
pval [i,] <- last.arma[[1]][,4]
i <- i+1
}
list(coeff, pval, mylist, aic=aic)
}
arimaSelectplot <- function(arimaSelect.out,noms,choix){
noms <- names(arimaSelect.out[[3]][[1]]$coef)
coeff <- arimaSelect.out[[1]]
k <- min(which(is.na(coeff[,1])))-1
coeff <- coeff[1:k,]
pval <- arimaSelect.out[[2]][1:k,]
aic <- arimaSelect.out$aic[1:k]
coeff[coeff==0] <- NA
n <- ncol(coeff)
if(missing(choix)) choix <- k
layout(matrix(c(1,1,1,2,
3,3,3,2,
3,3,3,4,
5,6,7,7),nr=4),
widths=c(10,35,45,15),
heights=c(30,30,15,15))
couleurs <- rainbow(75)[1:50]#(50)
ticks <- pretty(coeff)
par(mar=c(1,1,3,1))
plot(aic,k:1-.5,type='o',pch=21,bg='blue',cex=2,axes=F,lty=2,xpd=NA)
points(aic[choix],k-choix+.5,pch=21,cex=4,bg=2,xpd=NA)
title('aic',line=2)
par(mar=c(3,0,0,0))
plot(0,axes=F,xlab='',ylab='',xlim=range(ticks),ylim=c(.1,1))
rect(xleft = min(ticks) + (0:49)/50*(max(ticks)-min(ticks)),
xright = min(ticks) + (1:50)/50*(max(ticks)-min(ticks)),
ytop = rep(1,50),
ybottom= rep(0,50),col=couleurs,border=NA)
axis(1,ticks)
rect(xleft=min(ticks),xright=max(ticks),ytop=1,ybottom=0)
text(mean(coeff,na.rm=T),.5,'coefficients',cex=2,font=2)
par(mar=c(1,1,3,1))
image(1:n,1:k,t(coeff[k:1,]),axes=F,col=couleurs,zlim=range(ticks))
for(i in 1:n) for(j in 1:k) if(!is.na(coeff[j,i])) {
if(pval[j,i]<.01) symb = 'green'
else if( (pval[j,i]<.05) & (pval[j,i]>=.01)) symb = 'orange'
else if( (pval[j,i]<.1) & (pval[j,i]>=.05)) symb = 'red'
else symb = 'black'
polygon(c(i+.5 ,i+.2 ,i+.5 ,i+.5),
c(k-j+0.5,k-j+0.5,k-j+0.8,k-j+0.5),
col=symb)
if(j==choix) {
rect(xleft=i-.5,
xright=i+.5,
ybottom=k-j+1.5,
ytop=k-j+.5,
lwd=4)
text(i,
k-j+1,
round(coeff[j,i],2),
cex=1.2,
font=2)
}
else{
rect(xleft=i-.5,xright=i+.5,ybottom=k-j+1.5,ytop=k-j+.5)
text(i,k-j+1,round(coeff[j,i],2),cex=1.2,font=1)
}
}
axis(3,1:n,noms)
par(mar=c(0.5,0,0,0.5))
plot(0,axes=F,xlab='',ylab='',type='n',xlim=c(0,8),ylim=c(-.2,.8))
cols <- c('green','orange','red','black')
niv <- c('0','0.01','0.05','0.1')
for(i in 0:3){
polygon(c(1+2*i ,1+2*i ,1+2*i-.5 ,1+2*i),
c(.4 ,.7 , .4 , .4),
col=cols[i+1])
text(2*i,0.5,niv[i+1],cex=1.5)
}
text(8,.5,1,cex=1.5)
text(4,0,'p-value',cex=2)
box()
residus <- arimaSelect.out[[3]][[choix]]$res
par(mar=c(1,2,4,1))
acf(residus,main='')
title('acf',line=.5)
par(mar=c(1,2,4,1))
pacf(residus,main='')
title('pacf',line=.5)
par(mar=c(2,2,4,1))
qqnorm(residus,main='')
title('qq-norm',line=.5)
qqline(residus)
residus
}
if (par2 == 0) x <- log(x)
if (par2 != 0) x <- x^par2
(selection <- arimaSelect(x, order=c(par6,par3,par7), seasonal=list(order=c(par8,par4,par9), period=par5)))
bitmap(file='test1.png')
resid <- arimaSelectplot(selection)
dev.off()
resid
bitmap(file='test2.png')
acf(resid,length(resid)/2, main='Residual Autocorrelation Function')
dev.off()
bitmap(file='test3.png')
pacf(resid,length(resid)/2, main='Residual Partial Autocorrelation Function')
dev.off()
bitmap(file='test4.png')
cpgram(resid, main='Residual Cumulative Periodogram')
dev.off()
bitmap(file='test5.png')
hist(resid, main='Residual Histogram', xlab='values of Residuals')
dev.off()
bitmap(file='test6.png')
densityplot(~resid,col='black',main='Residual Density Plot', xlab='values of Residuals')
dev.off()
bitmap(file='test7.png')
qqnorm(resid, main='Residual Normal Q-Q Plot')
qqline(resid)
dev.off()
ncols <- length(selection[[1]][1,])
nrows <- length(selection[[2]][,1])-1
load(file='createtable')
a<-table.start()
a<-table.row.start(a)
a<-table.element(a,'ARIMA Parameter Estimation and Backward Selection', ncols+1,TRUE)
a<-table.row.end(a)
a<-table.row.start(a)
a<-table.element(a,'Iteration', header=TRUE)
for (i in 1:ncols) {
a<-table.element(a,names(selection[[3]][[1]]$coef)[i],header=TRUE)
}
a<-table.row.end(a)
for (j in 1:nrows) {
a<-table.row.start(a)
mydum <- 'Estimates ('
mydum <- paste(mydum,j)
mydum <- paste(mydum,')')
a<-table.element(a,mydum, header=TRUE)
for (i in 1:ncols) {
a<-table.element(a,round(selection[[1]][j,i],4))
}
a<-table.row.end(a)
a<-table.row.start(a)
a<-table.element(a,'(p-val)', header=TRUE)
for (i in 1:ncols) {
mydum <- '('
mydum <- paste(mydum,round(selection[[2]][j,i],4),sep='')
mydum <- paste(mydum,')')
a<-table.element(a,mydum)
}
a<-table.row.end(a)
}
a<-table.end(a)
table.save(a,file='mytable.tab')
a<-table.start()
a<-table.row.start(a)
a<-table.element(a,'Estimated ARIMA Residuals', 1,TRUE)
a<-table.row.end(a)
a<-table.row.start(a)
a<-table.element(a,'Value', 1,TRUE)
a<-table.row.end(a)
for (i in (par4*par5+par3):length(resid)) {
a<-table.row.start(a)
a<-table.element(a,resid[i])
a<-table.row.end(a)
}
a<-table.end(a)
table.save(a,file='mytable1.tab')